
所屬合集: 投資人簡報案例
Honeywell Technologies' Third Quarter 2026 earnings presentation (October 22, 2026): the first quarterly results deck under the Honeywell Technologies brand following the completed separation of Honeywell Technologies and Honeywell Aerospace. It reports 3Q26 sales of $5.0B (up 7% organic), segment margin of 21.3% (up 370 bps), adjusted EPS of $2.27 (up 34%) and free cash flow of $0.7B (95% conversion), and raises full-year 2026 guidance to $20.0B-$20.1B sales and $8.40-$8.45 adjusted EPS, alongside orders, backlog, deleveraging and stranded-cost updates and a full non-GAAP reconciliation appendix.
以這份簡報的封面作為風格參考,用您自己的內容產生幻燈片。 也可以在下方任選一頁,以它的版面作為參考。
快速導航
標籤
分享幻燈片
Honeywell Technologies' Third Quarter 2026 earnings presentation (October 22, 2026): the first quarterly results deck under the Honeywell Technologies brand following the completed separation of Honeywell Technologies and Honeywell Aerospace. It reports 3Q26 sales of $5.0B (up 7% organic), segment margin of 21.3% (up 370 bps), adjusted EPS of $2.27 (up 34%) and free cash flow of $0.7B (95% conversion), and raises full-year 2026 guidance to $20.0B-$20.1B sales and $8.40-$8.45 adjusted EPS, alongside orders, backlog, deleveraging and stranded-cost updates and a full non-GAAP reconciliation appendix.
每張幻燈片頁面的詳細視圖,包括版面、關鍵內容和視覺元素。
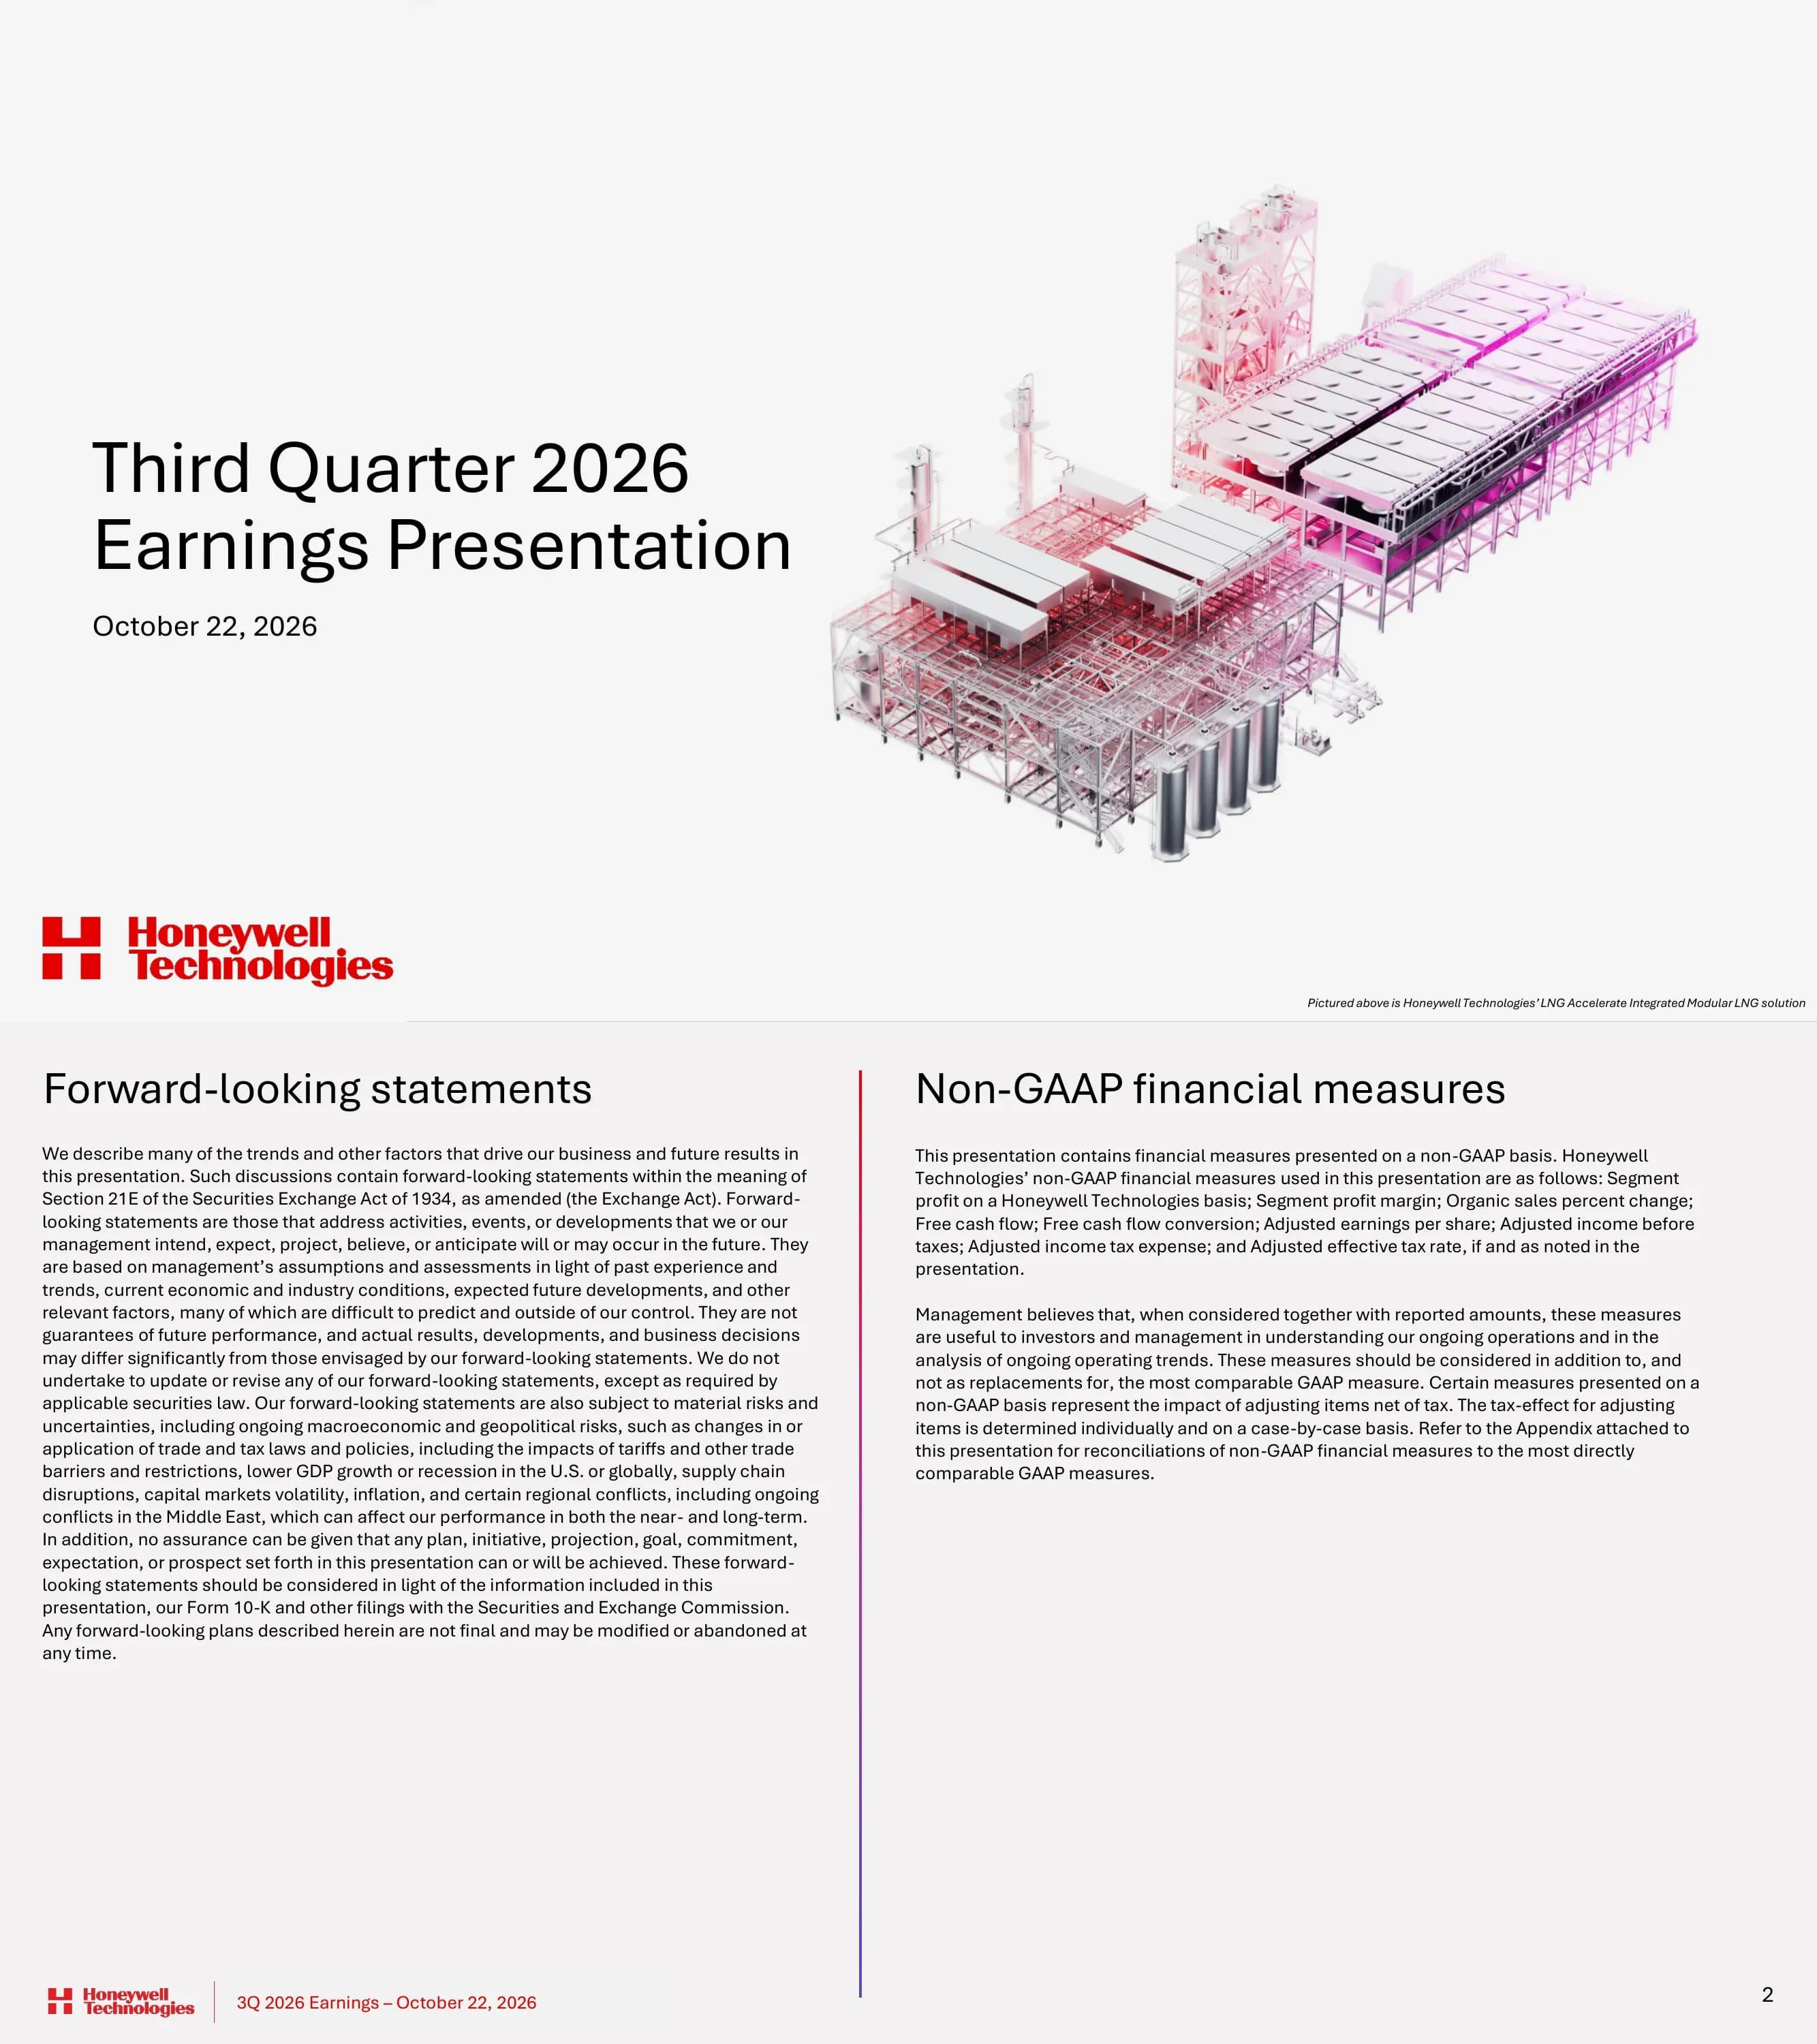
Cover slide titled 'Third Quarter 2026 Earnings Presentation', dated October 22, 2026, branded Honeywell Technologies. A caption identifies the image as Honeywell Technologies' LNG Accelerate Integrated Modular LNG solution.
Split cover: large left-aligned title and date on the left half, 3D rendering of a modular LNG plant filling the right half, Honeywell Technologies logo lockup bottom-left and caption bottom-right.
Legal disclaimer covering forward-looking statements under Section 21E of the Exchange Act, citing risks such as tariffs, recession, supply chain disruptions and conflicts in the Middle East. The right column lists the non-GAAP measures used, including segment profit, organic sales change, free cash flow conversion, adjusted EPS and adjusted effective tax rate.
Two text columns separated by a thin vertical red-to-purple gradient rule, each with its own heading; standard footer with logo and '3Q 2026 Earnings – October 22, 2026'.
Five numbered key messages: broad-based strength across all segments, short-cycle demand +8% and backlog +7% (excluding WWS and PSS, divested in 3Q 2026), BA strength plus PA&T growth inflection and IA recovery, accelerating free cash flow and debt paydown, and raised 2026 guidance. A results panel shows sales $5.0B (7% organic), segment margin 21.3% (+370 bps), adjusted EPS $2.27 (+34%) and free cash flow $0.7B (95% conversion).
Left two-thirds: numbered list 01-05 with large numerals and thin gradient separators; right third: stacked KPI panel with gradient maroon header and four metric rows.
Orders by quarter from 3Q25 to 4Q26E with an LTM organic orders growth line rising 1%, 3%, 6%, 11% then 8% in 3Q26. Commentary: short-cycle orders +8% organic, underlying orders +3% excluding a prior-year large low-carbon energy award, book-to-bill ~1.0x, backlog up 7% to ~$19B with PA&T backlog up double digits, and 4Q orders expected up ~HSD.
Two panels with gradient header bars ('Orders by quarter' chart left, '3Q commentary' bullets right) and a full-width red takeaway banner: 'Higher backlog and continued short-cycle demand driving momentum'.
World map pinpointing energy projects such as US LNG liquefaction, Brazil SAF refining, Africa refining and petchem, Middle East LNG and refining, Korea and APAC petchem, and Singapore refining. Bullets note >$1B of incremental energy orders since 1Q26, low carbon energy growing at double digits and stable catalyst demand; banner says DD+ PA&T backlog growth supports a robust 2027 outlook.
Grey world map with colored pins and callout labels on the left two-thirds, legend row beneath, bullet list on the right, red conclusion banner at bottom.
Four paired bar charts compare 3Q25 to 3Q26: sales $4.9B to $5.0B (up 7% organic), segment margin 17.6% to 21.3% (up 370 bps), adjusted EPS $1.70 to $2.27 (up 34%), and free cash flow $0.6B to $0.7B (95% conversion). Plus/minus driver bullets sit under each chart, including segment profit growth of +23% and timing of Middle East collections.
Four equal columns, each with metric header and growth subtitle, two-bar chart, and +/- driver list; red banner 'Organic growth and margin expansion driving >30% earnings growth'.
Margin bridge from 17.6% to 21.3%: volume leverage +70 bps, price and productivity +630 bps, inflation (350) bps, portfolio/other +20 bps. EPS bridge from $1.70 to $2.27: operational segment profit +$0.28, divestitures ($0.13), corporate/stranded cost takeout +$0.36, below the line +$0.12, tax ($0.06).
Two side-by-side waterfall charts split by a vertical gradient line, each with driver bullets below; circular mint badges ('+370 bps', 'Up 34%') on the ending bars; red conclusion banner.
Debt waterfall from a ~$18B 2Q balance through 3Q and 4Q term loan repayments, a 4Q bond maturity and net commercial paper repayment to an expected year-end balance below $13B. Bullets target <3.0x gross or <2.25x net leverage, ~$3.5B of planned 4Q repayments, and ~$3B year-end cash for net debt of ~$10B.
Waterfall chart on a light grey panel on the left, four large bullets on the right, red banner 'Meaningful deleveraging expected through year-end'.
Fixed cost as a percent of sales falls from 36.6% (2025) to 33.9% (2026 YTD) to a 31.3% 2027 target, a ~500 bps improvement. Text says all remaining stranded cost will be removed by end of 2026, ~270 bps improvement year-to-date while increasing R&D across all SBGs, via a cross-functional shared service model.
Three-bar chart on a grey panel with a bracket annotation on the left; three text statements separated by thin rules on the right; red banner 'Expect all stranded cost to be eliminated by end of 2026'.
Guidance table: sales raised from $19.8B-$20.0B to $20.0B-$20.1B (organic 4%-5%), segment margin ~20.5% (~290 bps expansion), adjusted EPS from $8.05-$8.35 to $8.40-$8.45 (30%-31% growth), free cash flow from ~$2.0B to ~$2.1B. 4Q26 guidance is $5.0B-$5.1B sales, ~22.0% margin and $2.42-$2.47 adjusted EPS.
Matrix table with grey row-label column and three column headers (outlined 'Prior 2026', maroon 'Revised 2026' and 'Revised 4Q26') with a chevron between prior and revised; commentary panel on the right; red banner 'Raising full-year adjusted EPS midpoint by $0.23'.
Five closing takeaways: 3Q results exceeded expectations on growth, margin and EPS; short-cycle demand resilient and PA&T entering a multi-year upcycle; free cash flow accelerating in the second half; raising 2026 guidance; and strong results plus backlog growth support the setup for 2027.
Single-column numbered list 01-05 with large numerals and thin gradient vertical separators on a white background.
Section divider introducing the appendix of supporting segment data, model inputs and non-GAAP reconciliations.
Full-bleed solid red slide with large white 'Appendix' title top-left and abstract gradient blocks on the right; white footer.
Building Automation sales $2,020M (up 8% organic), margin 27.0% (up 30 bps); Process Automation & Technology $1,859M (up 8% organic), margin 22.2% (down 210 bps on mix and acquisition dilution, project sales up 14%); Industrial Automation $1,115M (up 4% organic), margin 18.4% (up 350 bps, orders up 16%).
Table with grey segment-name column, maroon headers for Sales, Segment Margin and Commentary, bullet commentary per row; red banner 'Strong growth across all businesses, margin expansion in BA and IA offsetting anticipated mix impacts'.
Reported vs organic sales growth by segment and sub-business: BA 8%/8% (products 10%/11%, solutions 4%/4%); PA&T 16%/8% (aftermarket 17%/4%, projects 16%/14%); IA (23%)/4% (products (15%)/flat, solutions (40%)/16%).
Clean two-column data table with maroon headers '3Q Reported' and '3Q Organic', grey shaded segment rows and white sub-rows.
Modeling inputs for 2025, 2026E, 3Q26 and 4Q26E: total corporate ($884M) in 2025 vs ~($575M) 2026E, net interest ($646M) vs ~($475M), total below the line ($865M) vs ~($740M), adjusted effective tax rate 19.5% vs ~19% (~16% in 4Q26E), share count 321M vs ~319M. A footnote notes the outlook includes a $73M 2026 benefit from the Honeywell Aerospace trademark agreement.
Four-column table alternating outlined (actual) and filled maroon (estimate) headers, grey banded rows, separate 'Other inputs' block.
Brand image with the Honeywell Technologies logo and the tagline 'At the heart of it' over an aerial city skyline at dusk. It contains no financial data.
Full-bleed photograph split into quadrants, logo centred in the upper-left quadrant and tagline in a red-to-violet gradient overlay in the lower-right quadrant.
Explains why non-GAAP measures are presented, their limitations, and that certain forward-looking non-GAAP measures are not reconciled because some items cannot be reliably predicted.
Centred bold 'Appendix' label, left-aligned subheading and four justified paragraphs on a white page.
Company reported sales change of 1% becomes 7% organic after an (8)% divestiture impact and 2% acquisitions. PA&T goes from 16% reported to 8% organic (8% acquisitions), BA is 8% on both bases, and IA moves from (23)% reported to 4% organic after a (27)% divestiture impact.
Four reconciliation blocks in a 2x2 grid with underlined and double-underlined totals, definition paragraphs at the bottom.
3Q26 operating income of $740M reconciles to segment profit of $1,062M on segment sales of $4,994M, a 21.3% segment profit margin (operating income margin 14.8%), versus $866M and 17.6% in 3Q25. Adjustments include stock compensation ($104M), acquisition intangibles amortization ($131M) and trademark licensing income ($36M); full-year 2025 segment profit was $3,507M on $19,915M sales.
Dense four-column financial table (3Q 2026, 3Q 2025, 4Q 2025, 2025) with numbered footnotes below.
Defines operating income, segment profit and segment profit margin on a Honeywell Technologies basis, noting exclusions such as stock compensation, acquisition amortization, repositioning, trademark licensing income and Quantinuum results, and why forward-looking reconciliations are not provided.
Bold heading followed by three justified text paragraphs.
Diluted EPS to adjusted EPS from 3Q25 to 2026E: 3Q26 GAAP EPS $2.40 becomes adjusted $2.27 after items such as a ($0.67) gain on sale of business and $0.35 Quantinuum equity loss. 2Q26 GAAP EPS of $16.64 includes a ($15.87) gain on deconsolidation of Quantinuum, and 2026E GAAP EPS of $21.88-$21.93 corresponds to adjusted $8.40-$8.45.
Wide eight-column reconciliation table (3Q25, 4Q25, FY2025, 1Q26, 2Q26, 3Q26, 4Q26E, 2026E) with 'No Forecast' entries for unpredictable items.
Eighteen footnotes detail share counts (about 319.2 million weighted average shares for 3Q26) and the pre- and after-tax size of each adjustment, including the $5,057 million gain on deconsolidation of Quantinuum and the $216 million 3Q26 gain on sale of business.
Numbered footnote list in small justified type filling the page under a bold heading.
Defines adjusted EPS and explains that pension income, divestiture-related costs tied to the recently completed separation of Honeywell Technologies and Honeywell Aerospace, and Quantinuum equity losses are not forecast.
Bold heading with two justified paragraphs; the rest of the page is white space.
3Q26 income before taxes of $839M and tax expense of $60M give a 7.2% effective tax rate; adjusted figures of $908M and $172M give a 19.0% adjusted rate. For 2025 the effective rate was 22.2% and the adjusted rate 19.5%.
Two-column ($M: 3Q 2026, 2025) reconciliation table in three stacked blocks: pre-tax income, tax expense and rate calculations.
Defines adjusted income before taxes, adjusted income tax expense and adjusted effective tax rate, and explains why GAAP effective tax rate guidance is not provided.
Bold heading with two short justified paragraphs on an otherwise empty page.
3Q26 operating cash flow of $607M less capex of $77M plus $158M separation-related payments gives free cash flow of $688M, versus $599M in 3Q25. The 2026E free cash flow is ~$2.1B (operating cash flow 2.1, capex ~(0.6), separation payments ~0.5, Quantinuum ~0.1, in $B).
Three-column table (3Q26, 3Q25, 2026E) followed by two definition paragraphs.
Net income attributable to Honeywell Technologies from continuing operations of $767M adjusts to $724M after items including a ($216M) gain on sale of business and $112M Quantinuum equity loss. Operating cash flow conversion is 79% and adjusted free cash flow conversion is 95% ($688M / $724M).
Single-column 3Q 2026 reconciliation table in four blocks, seven numbered footnotes and two definition paragraphs.
關於此幻燈片和基礎簡報內容的常見問題。
The 27-page deck, dated October 22, 2026 and branded Honeywell Technologies, covers third-quarter results, orders and backlog, energy-sector project wins, margin and EPS bridges, debt paydown, stranded-cost elimination, revised 2026 guidance, segment results and an appendix of non-GAAP reconciliations.
Sales were $5.0B with 7% organic growth, segment margin was 21.3% (up 370 bps), adjusted EPS was $2.27 (up 34% from $1.70), and free cash flow was $0.7B ($688M) with 95% conversion. Backlog rose 7% to about $19B, excluding the divested WWS and PSS businesses.
The appendix refers to the recently completed separation of Honeywell Technologies and Honeywell Aerospace. Other slides mention corporate costs previously allocated to Aerospace and a Honeywell Aerospace trademark agreement, which contributes a $73M benefit in 2026. The deck also notes the divestiture of Warehouse and Workflow Solutions and Productivity Solutions and Services in 3Q 2026, plus the deconsolidation of Quantinuum.
Full-year sales guidance rose to $20.0B-$20.1B (4%-5% organic) from $19.8B-$20.0B. Adjusted EPS rose to $8.40-$8.45 from $8.05-$8.35, which raises the midpoint by $0.23. Free cash flow guidance rose to ~$2.1B from ~$2.0B, and segment margin is expected at ~20.5%. For 4Q26 the company guides to $5.0B-$5.1B sales and $2.42-$2.47 adjusted EPS.
It uses a clean white canvas with deep maroon-to-red gradient headers and mint-green highlights for current-period bars. Every core slide closes with a full-width red takeaway banner. Waterfall bridges, paired bar charts, a world project map and outlined-versus-filled table headers (separating actuals from estimates) make it a strong reference for corporate earnings decks.
Yes. This page offers the original PDF and an editable PPTX download. Honeywell publishes the deck as a PDF; the PPTX is a conversion of that PDF, so every slide's text, charts and layout can be edited in PowerPoint, Keynote or Google Slides. You can also use the Create Slides Like This flow on 2Slides to generate a new deck in the same style with your own content.
Keep the narrative order: key messages with a KPI card stack, orders and demand, a four-metric financial summary, margin and EPS bridges, balance sheet actions, guidance table, takeaways, then an appendix. Swap in your own metrics, keep one conclusion banner per slide, and use grey for prior-period figures and an accent colour for current-period figures.
It is the company's official third-quarter 2026 earnings presentation from October 22, 2026, available through Honeywell Investor Relations at investor.honeywell.com. Always check figures against the official filings before relying on them.
Official investor relations site hosting Honeywell's quarterly earnings presentations, press releases and SEC filings.

Create Your Own Slides
Turn your ideas into professional presentations in seconds with 2slides AI.
參考專業設計,選擇您的風格,產生具有完美文字渲染的投影片。由 Nano Banana 提供支援—立即開始建立您的簡報。


