
eBay Q3 2026 Earnings Presentation — the 43-slide 'Q3'26 Business & Financial Highlights' deck eBay Inc. released on October 28, 2026, covering GMV of $23.2B, revenue of $3.2B, non-GAAP EPS of $1.51, strategic priorities (Focus Categories, C2C, Recommerce), Depop, eBay Live, Q4 and FY'26 guidance, preliminary FY'27 commentary and a full non-GAAP reconciliation appendix.
以這份簡報的封面作為風格參考,用您自己的內容產生幻燈片。 也可以在下方任選一頁,以它的版面作為參考。
快速導航
標籤
分享幻燈片
eBay Q3 2026 Earnings Presentation — the 43-slide 'Q3'26 Business & Financial Highlights' deck eBay Inc. released on October 28, 2026, covering GMV of $23.2B, revenue of $3.2B, non-GAAP EPS of $1.51, strategic priorities (Focus Categories, C2C, Recommerce), Depop, eBay Live, Q4 and FY'26 guidance, preliminary FY'27 commentary and a full non-GAAP reconciliation appendix.
每張幻燈片頁面的詳細視圖,包括版面、關鍵內容和視覺元素。
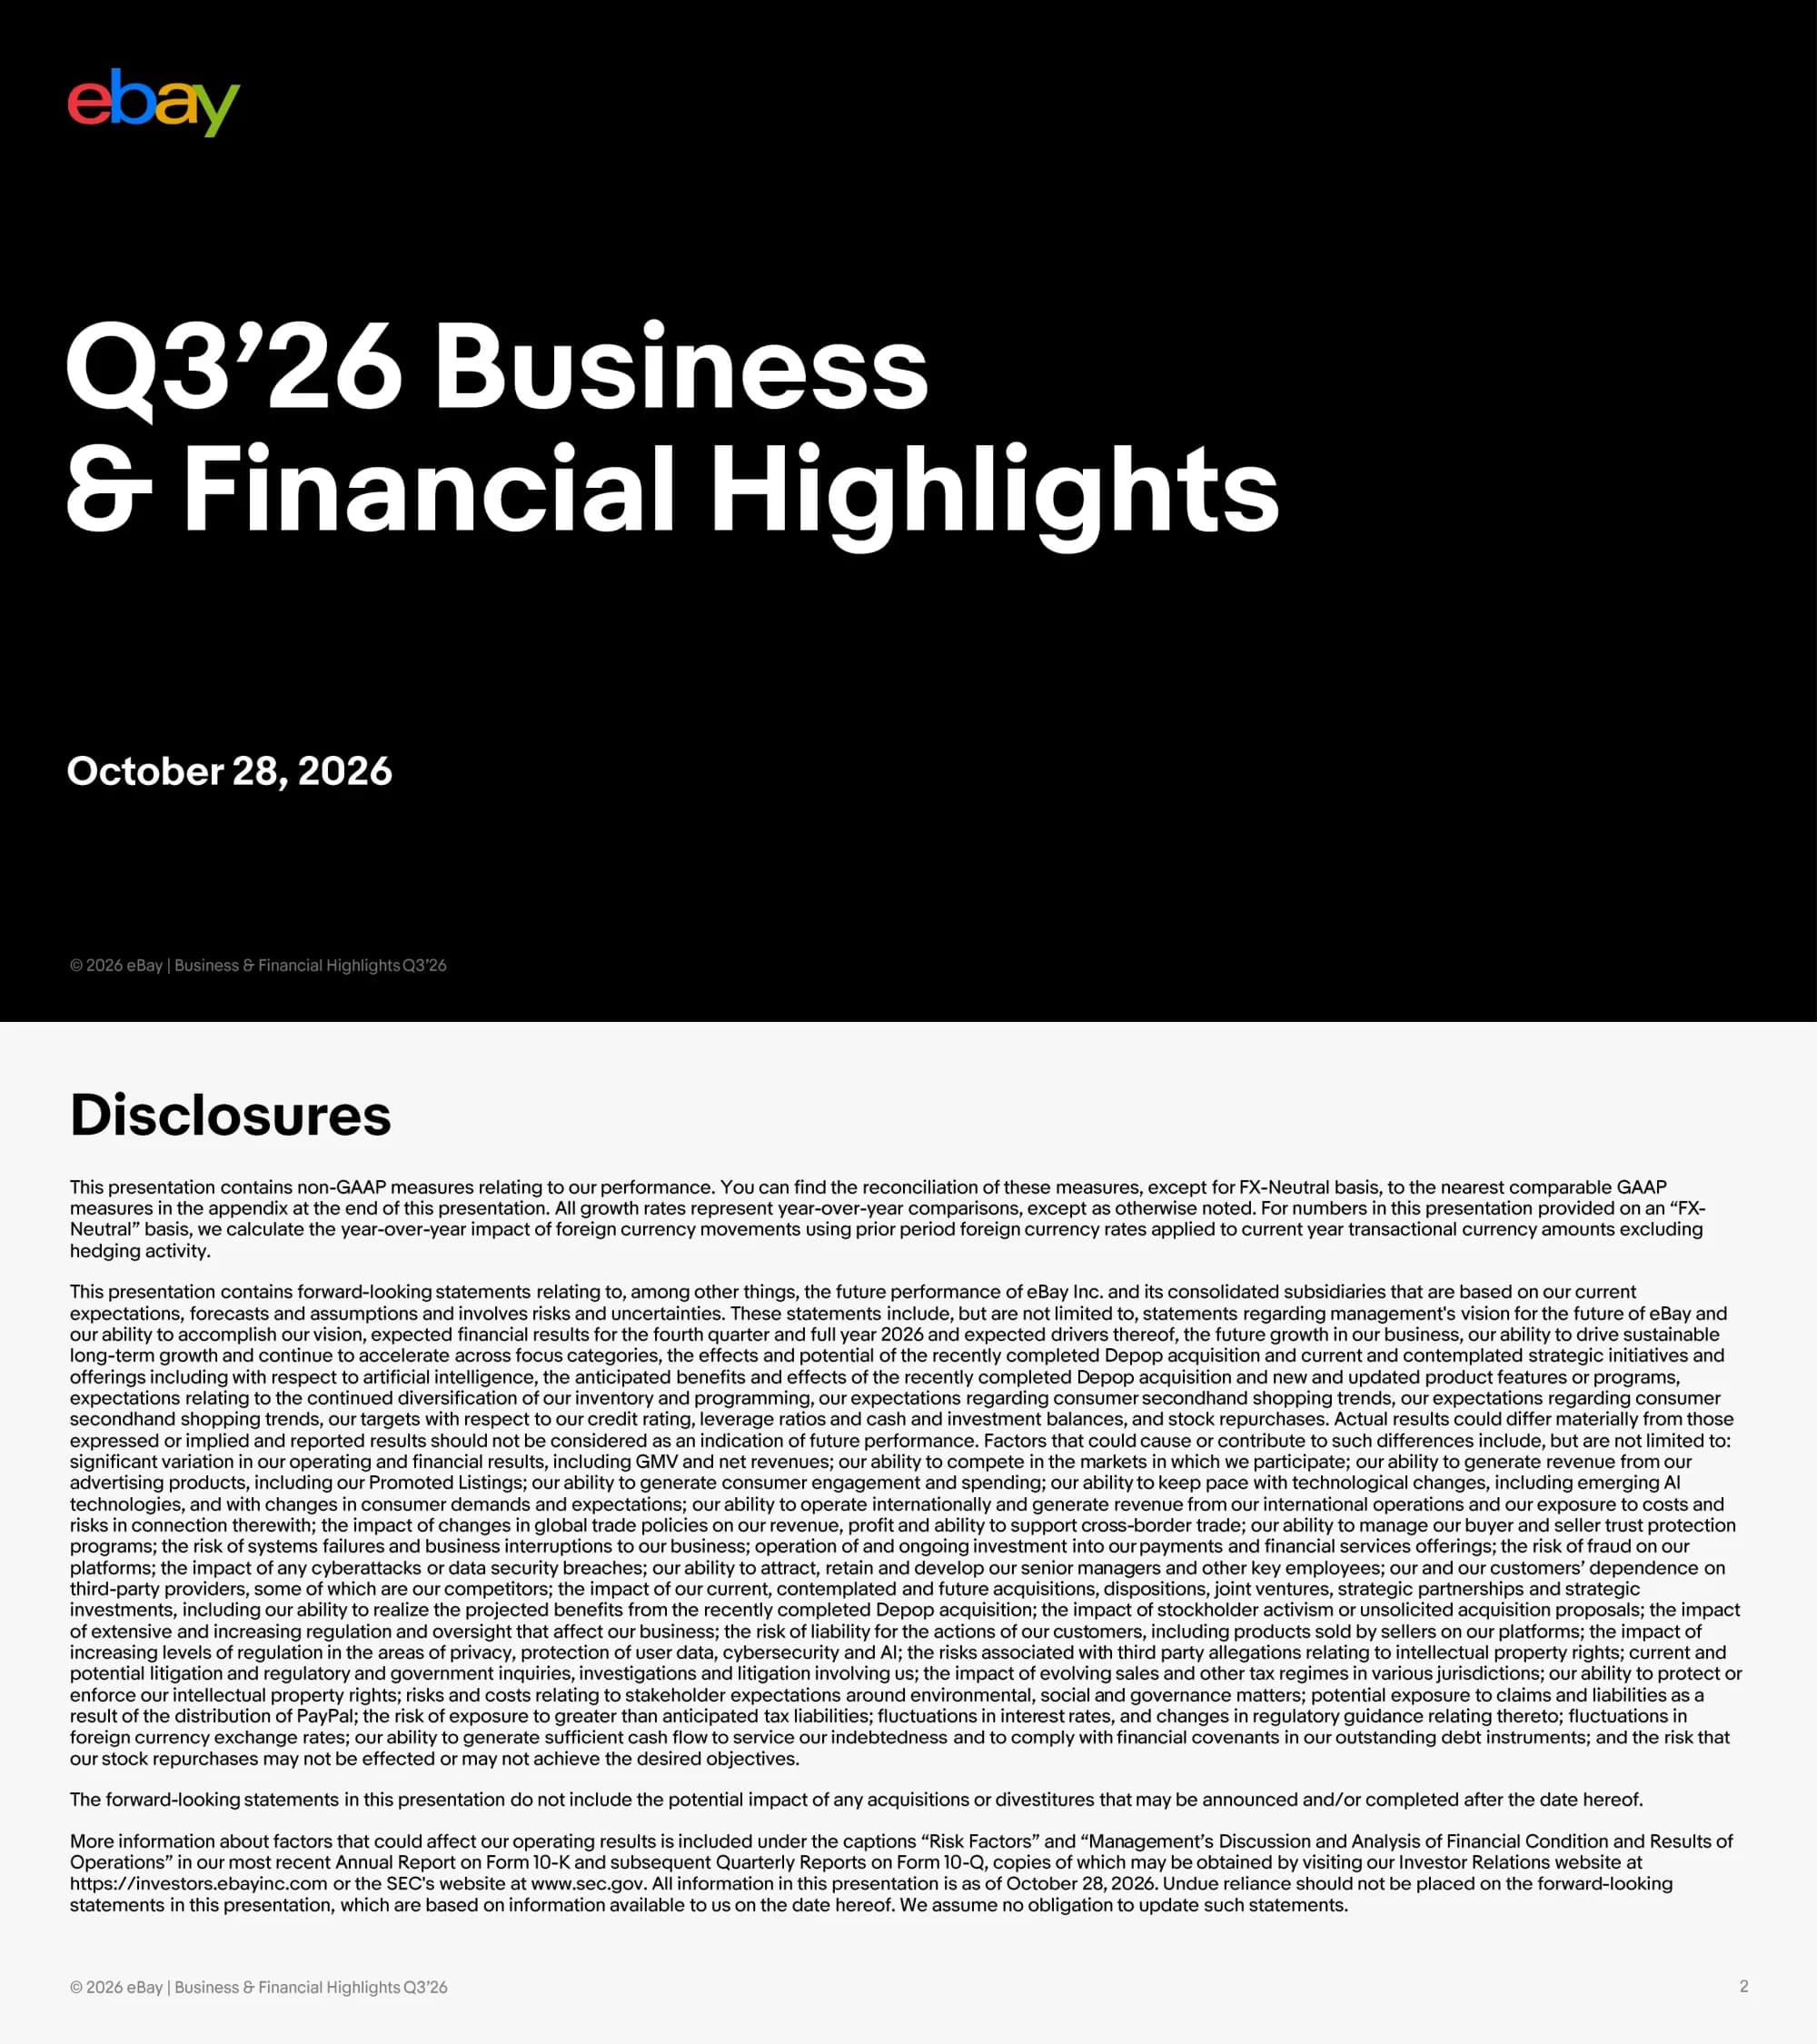
Cover slide for eBay's third-quarter 2026 earnings presentation, dated October 28, 2026, with the multicolor eBay wordmark and the footer '© 2026 eBay | Business & Financial Highlights Q3'26'.
Full-bleed black background with the eBay logo top-left, a two-line oversized white headline in the left half and the date beneath it.
Dense legal page explaining non-GAAP measures and the FX-Neutral calculation (prior-period FX rates applied to current transactional amounts, excluding hedging), followed by the forward-looking statements safe harbor covering Q4 and full-year 2026 expectations, the recently completed Depop acquisition, AI initiatives, secondhand shopping trends, credit rating and leverage targets and stock repurchases; it points readers to the 10-K and 10-Q risk factors and states all information is as of October 28, 2026.
Light grey background with a bold black 'Disclosures' heading and four justified paragraphs of small body text filling the slide.
Section divider opening the business review portion of the deck.
Solid navy-blue full-bleed slide with a white eBay logo top-left and a very large pale-blue 'Business Highlights' title across the middle.
Five headline numbers for the quarter: $23.2B Gross Merchandise Volume, $3.2B revenue, $0.84B non-GAAP operating income, $1.51 diluted non-GAAP EPS and 16 million Enthusiast Buyers. A footnote defines Enthusiast Buyers as buyers with at least 6 purchase days and $800+ annual spend on a trailing-12-month basis, excluding off-platform businesses, and notes that 'Revenue' means net revenue.
Left half is a stacked KPI list with huge bright-blue figures and right-aligned black labels separated by thin rules; right half is a rounded lifestyle photo of luxury handbags and a hand holding a phone showing an eBay listing feed.
Three strategic priorities: Focus Categories (global GMV grew 24% Y/Y FXN, led by Collectibles, eBay Motors, Fashion and Refurbished; Collectible Coins added in the US as the newest Focus Category), C2C (global GMV grew more than 20% Y/Y FXN, healthy double-digit growth in the US, UK and Australia, AI-powered Magical Listing expanding supply) and Recommerce (global GMV grew more than 20% Y/Y FXN, 47% of consumers surveyed buy secondhand at least monthly, younger consumers expanding the TAM). Together the de-duplicated priorities represent 72% of total GMV and grew ~20% Y/Y in Q3; strategic-priority figures exclude Depop.
White rounded panel holding three photo-topped colored cards (green, yellow, blue) with bullet lists, plus a three-circle Venn diagram on the right with a summary caption below it.
Collectibles remained eBay's largest contributor to GMV growth in Q3. Sports Trading Cards and Collectible Card Games sustained strong growth despite tougher comparisons; AI-powered card scanning passed 130M+ cumulative scans, expanded to the UK and added TCGplayer and Goldin transaction data to the price guide; Authenticity Guarantee thresholds for trading cards were lowered from $250 to $200 in the US and £350 to £250 in the UK, and Collectible Coins AG launched in the US (first coin: 2026 Cook Islands Thunder Dragon). Among complementary marketplaces, TCGplayer surpassed $1 billion+ in trailing-12-month GMV for the first time and Goldin sold a rare 1776 Exeter Broadside Declaration of Independence for $3.65M.
Two-zone layout: left 'eBay Core Collectibles Marketplace' with three white rounded cards (trading cards, card scanning with phone screenshots, authentication), right 'Complementary Marketplaces' column with TCGplayer and Goldin logos and big blue figures.
Parts & Accessories: Easy & Free Returns expanded to Germany after US and UK rollouts drove higher conversion and incremental GMV with stable return rates; Certified Recycled badging introduced in the US to flag high-quality recycled OEM parts. Vehicles: GMV grew well into the triple digits Y/Y in Q3, hundreds of independent dealers onboarded to Trusted Dealer, Secure Purchase Express streamlines C2C checkout, and Vehicle Purchase Protection rose to up to $500K. Several Q3 vehicle sales exceeded $1M: a 2005 Porsche Carrera GT ($5M), a 2020 Ferrari 488 ($1.5M) and a 2020 Ford GT Coupe ($1.1M).
Left column of two white cards for Parts & Accessories with line icons and a listing screenshot; right large white card for Vehicles with a 2x2 text grid above a three-car photo row with blue sale prices.
eBay calls itself the #1 online marketplace for secondhand Luxury Fashion in the US and UK (based on its H1 2026 estimates) and reports another quarter of healthy double-digit Luxury Fashion GMV growth. Q3 Authenticity Guarantee expansion: France & Italy extended AG to eligible watches, handbags, clothing, shoes and accessories; buyers in 23 European countries can access authenticated luxury items from sellers in France, Italy and Germany; Australia rolled out AG across eligible watches.
Left white card with '#1', US/UK flag icons and 'Strong Growth' with a rising-chart icon; right wide white card split into three columns (France & Italy, European Countries, Australia), each with flag or big number, caption and a product photo.
Depop's US GMV, monthly active users and sold items more than doubled Y/Y on a pro forma basis, and repurchase, relist and resell rates all improved Y/Y. Strengthening Depop: personalized homepage for better discovery, a streamlined AI-assisted listing flow, and full-funnel marketing to attract first-time customers. Leveraging eBay's scale: testing a dedicated module of Depop listings inside eBay search results for select fashion queries, and giving Depop access to eBay carrier rates for lower-cost shipping.
Top white banner with two red headline stats separated by a divider; below, a left card listing three initiatives and a right card with a laptop screenshot of eBay search showing a 'Refresh your closet on Depop' module beside two text blocks.
Global C2C GMV grew more than 20% Y/Y, with healthy double-digit C2C growth across the US, UK and Australia. The latest AI-powered Magical Listing experience is available to all new and reactivated listers across 6 major markets, to all C2C sellers in Australia, France and Italy, and is ramping to all active sellers in the US, UK and Germany. In France and Italy a broader C2C experience (free selling, Magical Listing, eBay Balance, buyer protection, local discovery, simpler shipping) is driving an uplift in new and reactivated listers.
Top white banner with two blue headline stats; below, two white cards — left with three stacked text blocks on AI listing, right with French/Italian flags and a two-column bullet list.
eBay Live delivered another record quarter and is generating GMV at a multi-billion-dollar annualized run-rate. Four initiatives: improved buyer discovery (Live-specific search, filters and personalized recommendations in a redesigned feed-based hub), broader seller access (self-service onboarding to more markets), greater audience reach (multistreaming via Live Studio to YouTube, Facebook, Instagram and Twitch) and trust at scale (AI-powered chat, audio and video moderation plus pre-event screening). GMV growth remained well into the triple digits Y/Y with participation expanding across 7 markets.
Phone mock-up of the redesigned Live Hub on the left; 2x2 grid of white cards with blue line icons and blue headings on the right; full-width bright-blue banner with white text at the bottom.
Findings from eBay's 2026 Recommerce Report (global survey respondents): the share of consumers shopping secondhand at least monthly rose from 35% in 2025 to 47% in 2026 (+12 pts Y/Y); 89% expect to spend the same or more on secondhand in 2027; 53% of ages 18–29, 43% of ages 30–45 and 36% overall expect to buy more secondhand next year (+17 pts for 18–29 vs. overall); among Gen Z, 61% say community matters to secondhand shoppers, and 54% say community and shared connections are important.
Top row: blue photo tile of four young people with 'Our 2026 Recommerce Report' and a navy stat card showing 35% → 47%; bottom row: three white cards with an 89% callout, a three-bar column chart and a 61%/54% Gen Z card.
Section divider opening the financial results portion of the deck.
Solid dark teal full-bleed slide with a pale eBay logo top-left and an oversized pale-cyan 'Financial Highlights' title.
Guidance versus actuals: GMV guidance $22.0–$22.4B vs. actual $23.2B (15% spot, 16% FXN, 13% organic FXN); revenue guidance $3.07–$3.12B vs. actual $3.21B (14% spot, 13% FXN, 11% organic FXN); non-GAAP operating income guidance $0.77–$0.80B vs. actual $0.84B (11% spot); diluted non-GAAP EPS guidance $1.36–$1.42 vs. actual $1.51 (12% spot). Non-GAAP growth rates are based on financials recast for the retrospective adoption of ASU 2025-06.
Four-row comparison table with grey 'GUIDANCE' and dark-teal 'ACTUALS' header tabs and row labels on the left; a tall rounded photo of a man in a classic-car garage on the right.
Quarterly GMV ($ billions, Y/Y FXN growth) from Q2 25 to Q3 26: 19.5 (4%), 20.1 (8%), 21.2 (8%), 22.2 (14%), 22.4 (14%), 23.2 (16%). Q3 26 splits into US GMV 12.5 (27%) and International GMV 10.6 (4%). Organic FXN growth: 4%, 8%, 8%, 14%, 14%, 13%.
Six stacked columns in dark green (International) over lime green (US) with totals above each bar, a legend box at left and an 'Organic FXN' strip beneath the axis.
Quarterly revenue ($ millions, Y/Y FXN growth): Q2 25 2,730 (4%), Q3 25 2,820 (8%), Q4 25 2,965 (13%), Q1 26 3,089 (17%), Q2 26 3,134 (14%), Q3 26 3,206 (13%). Take rate held at 14.0% for most quarters, 13.9% in Q1 26 and 13.8% in Q3 26. Organic FXN revenue growth: 4%, 8%, 13%, 17%, 14%, 11%.
Six bright-blue columns with value labels on top and a flat take-rate line with white circular markers across the bars; legend box at left and Organic FXN strip at the bottom.
Advertising revenue ($ millions, Y/Y FXN growth) grew to 607 (16%) in Q3 26, made up of 575 first-party ads (16%), 28 off-platform ads (35%) and 4 third-party ads ((44)%). Prior quarters: 482, 525, 544, 581 and 596. First-party ads outgrew GMV by +3 pts in Q3 26 (excluding Depop) and total ad GMV penetration was 2.7%.
Six stacked columns in purple (1P), near-black (3P) and green (off-platform) with segment labels, legend box at left and a two-line summary strip for '1P vs. GMV' and 'GMV Penetration'.
Non-GAAP operating expense rose to 46.8% of revenue, up +1.3 pts Y/Y. Q3 25 vs. Q3 26 as % of revenue: cost of revenue 27.5% → 26.9% (operational efficiencies and UK managed shipping accounting change, partially offset by Depop and higher traffic acquisition costs); sales & marketing 20.7% → 22.5% (Depop investments and more marketing for strategic priorities); product development 13.5% → 13.4%; general & admin 7.5% → 7.1% (reorganization efficiencies partly offset by Depop); transaction losses flat at 3.8%.
Five paired column charts (dark teal Q3 25 vs. turquoise Q3 26) with explanatory captions beneath; four of them sit inside a bordered box under a black 'Operating Expense at 46.8%' header bar.
Non-GAAP operating income ($ millions, Y/Y growth): Q2 25 771 (8%), Q3 25 760 (9%), Q4 25 771 (11%), Q1 26 907 (18%), Q2 26 893 (16%), Q3 26 843 (11%). Non-GAAP operating margin: 28.3%, 27.0%, 26.0%, 29.4%, 28.5%, 26.3%. 2025 quarters are recast for ASU 2025-06 while their growth rates are as previously reported.
Six turquoise columns with value and growth labels above, quarter labels with footnote markers, and a bordered margin row beneath.
Non-GAAP EPS (Y/Y growth): Q2 25 $1.36 (16%), Q3 25 $1.35 (14%), Q4 25 $1.41 (13%), Q1 26 $1.66 (21%), Q2 26 $1.60 (17%), Q3 26 $1.51 (12%). GAAP EPS: $0.78, $1.27, $1.14, $1.12, $1.21, $1.11, with GAAP Y/Y of 77%, (1)%, (19)%, 7%, 56% and (13)%.
Six golden-yellow columns with dollar labels, plus a bordered two-row table for GAAP EPS and GAAP Y/Y growth.
Free cash flow ($ millions, Y/Y growth): Q2 25 (441), Q3 25 803 (24%), Q4 25 478 ((13)%), Q1 26 898 (39%), Q2 26 326, Q3 26 749 ((7)%). CapEx as % of revenue: 4%, 3%, 3%, 2%, 7%, 4%; FCF as % of revenue: not meaningful, 28%, 16%, 29%, 10%, 23%.
Six green columns around a zero baseline with one negative bar for Q2 25, and a bordered two-row strip for CapEx % and FCF % of revenue.
Capital returned ($ millions): Q2 25 759, Q3 25 757, Q4 25 756, Q1 26 639, Q2 26 448, Q3 26 827. Q3 26 consisted of 689 in stock repurchases and 138 in cash dividends. Average diluted shares fell from 470M to 453M over the six quarters, and approximately $1.3B of repurchase authorization remained as of September 30, 2026.
Six stacked columns in purple (buybacks) and dark plum (dividends) with totals on top, a diluted-share row beneath and a black full-width banner with the remaining authorization.
Q3'26 ending cash and investments of $3.3B against $(6.7)B of debt, for net debt of $(3.4)B. Remaining equity investments were valued at ~$0.8B as of September 30, 2026, mainly eBay's Aurelia equity worth ~$0.5B. Targets: maintain the BBB+ rating, mid-term leverage of about 1.5x net debt and gross debt below 3.0x adjusted EBITDA. Current credit ratios: 1.1x net debt and 2.2x gross debt. Cash excludes ~$1.4B of customer accounts and restricted cash.
Left: waterfall-style column chart in gold and olive with a rounded yellow callout box beneath; right of a vertical divider: 'Targets' and 'Credit Ratios' headings with bullet points.
Q4 2026 guidance: GMV $23.7–$24.1B (12%–13% spot, 12%–14% FXN, 8%–10% organic FXN), with Depop expected to add ~4 pts to FXN GMV growth and ~10 bps FX headwind; revenue $3.19–$3.24B (8%–9% spot, 7%–9% FXN, 5%–7% organic FXN), with GMV outpacing revenue due to Depop consolidation/mix, UK managed shipping accounting and business/ASP/category mix, Depop adding ~2 pts and ~60 bps FX tailwind; non-GAAP operating income $0.82–$0.85B (6%–10% spot), implying a 25.7%–26.2% margin; diluted non-GAAP EPS $1.48–$1.53 (5%–9% spot), driven by operating income growth and buybacks partly offset by OI&E headwinds.
Four-row table with a grey 'GUIDANCE' column and a dark-teal 'CONTEXT' column of bullet explanations, row labels at left.
Full-year 2026 guidance: GMV $91.5–$91.9B (15%–15% spot, 14%–14% FXN, 12%–12% organic FXN), revenue $12.62–$12.67B (14%–14% spot, 12%–13% FXN, 11%–12% organic FXN), non-GAAP operating income $3.46–$3.49B (13%–14% spot) and diluted non-GAAP EPS $6.25–$6.30 (14%–15% spot). Assumptions: Depop adds ~2 pts to FXN GMV growth and ~1 pt to FXN revenue growth; FX tailwinds of ~120 bps to spot GMV and ~140 bps to spot revenue; non-GAAP effective tax rate of 17.5%; ~$2B of share repurchases targeted in FY'26; a Q4'26 cash dividend of $0.31 per share declared; capital return in line with the 90–100% of normalized FCF framework.
Four-row table with a black 'GUIDANCE' column and a dark-teal 'CONTEXT' column grouped into Volume, Revenue, Non-GAAP Operating Income and Other assumptions.
Growth commentary: eBay is planning for healthy consolidated Y/Y growth in FXN GMV, FXN revenue, non-GAAP operating income and non-GAAP EPS in 2027, assuming broad-based GMV momentum across Focus Categories, eBay Live, C2C and Depop, while Trading Cards growth is expected to moderate as it laps extraordinary 2026 levels. Other considerations: balance investment with healthy flow-through to earnings, modest Y/Y headwinds to net interest income from a lower cash balance and rate assumptions, a relatively stable non-GAAP tax rate, and an unchanged long-term framework of returning 90% to 100% of normalized free cash flow via buybacks and dividends.
Two text columns ('Growth Commentary' and 'Other Financial Considerations') separated by thin vertical rules, each with three or four large bullets.
Section divider introducing the non-GAAP reconciliations and supplementary tables.
Dark teal full-bleed slide with a pale eBay logo and a large pale-cyan 'Appendix' title.
Six-quarter reconciliation (Q2 2025–Q3 2026, 2025 quarters 'As Adjusted'): GAAP operating income of $479, $571, $597, $611, $676 and $616 million is adjusted for stock-based compensation and payroll taxes ($177M in Q3 2026), amortization of acquired intangibles ($25M), restructuring and executive bonuses ($(3)M), legal matters and transaction-related costs ($28M) to reach non-GAAP operating income of $771, $760, $771, $907, $893 and $843 million. Q3 2026 GAAP operating margin was 19.2% versus 26.3% non-GAAP. A footnote explains the early adoption of ASU 2025-06 on internal-use software from January 1, 2026 with retrospective recast.
Financial table with six quarterly columns, alternating grey row shading, double underline on totals and an ASU footnote at the bottom.
GAAP income from continuing operations ($365, $593, $522, $512, $552 and $501 million from Q2 2025 to Q3 2026) is reconciled to non-GAAP net income from continuing operations of $640, $633, $644, $760, $727 and $685 million, adding back stock-based compensation, intangible amortization, restructuring, legal and transaction costs, fair-value changes in equity investments and warrants, and income tax effects ($(42)M in Q3 2026). Non-GAAP EPS per diluted share was $1.36, $1.35, $1.41, $1.66, $1.60 and $1.51 on 470, 467, 460, 457, 455 and 453 million shares.
Six-column reconciliation table with shaded rows, a per-share line and a share-count line, plus the ASU 2025-06 footnote.
Waterfall bridge from non-GAAP EPS of $1.51 to GAAP EPS of $1.11: stock-based compensation and amortization reduce EPS by $(0.36) and tax rate and other items by $(0.04). All items are tax-effected; stock-based compensation includes related employer payroll taxes.
Four-step waterfall chart with full turquoise bars for the start and end values, pale turquoise floating bars for the deductions and dashed connector lines.
Full Q3 2026 income statement versus Q3 2025 (as adjusted), reported, non-GAAP entries and non-GAAP. Q3 2026: net revenues $3,206M; cost of net revenues $887M reported / $864M non-GAAP; gross profit $2,319M / $2,342M; sales and marketing $747M / $722M; product development $517M / $431M; G&A $303M / $224M; transaction losses $122M; total operating expenses $1,703M / $1,499M; income from operations $616M / $843M; income from continuing operations $501M / $685M; diluted EPS $1.11 / $1.51; operating margin 19.2% / 26.3%; effective tax rate 17.1% / 17.5%. Q3 2025 comparatives: revenue $2,820M, non-GAAP operating income $760M, non-GAAP diluted EPS $1.35. Notes (a)–(f) label each adjustment type.
Wide, dense financial statement table with two three-column blocks (Q3 2026 and Q3 2025), zebra shading and lettered notes at the bottom.
Net cash from continuing operating activities of $(340), $900, $561, $970, $549 and $875 million (Q2 2025–Q3 2026) less net purchases of property and equipment of $(101), $(97), $(83), $(72), $(223) and $(126) million gives free cash flow from continuing operations of $(441), $803, $478, $898, $326 and $749 million.
Compact three-row table across six quarterly columns at the top of an otherwise empty white slide, with the ASU footnote.
Total net revenues of $2,730, $2,820, $2,965, $3,089, $3,134 and $3,206 million for Q2 2025 through Q3 2026, with hedge gains/(losses) of $(6), $(24), $(19), $(13), $(1) and $(2) million and foreign currency impacts of $32, $20, $16, $78, $22 and $(7) million.
Single highlighted revenue row with two footnoted sub-rows beneath, spanning six quarterly columns.
As-reported revenue growth of 6%, 9%, 15%, 19%, 15% and 14% (Q2 2025–Q3 2026) is adjusted for acquisition/disposition impact (—% until Q3 2026, when it is (2)%) and foreign currency impact ((2)%, (1)%, (2)%, (3)%, (1)%, (1)%) to give organic FX-neutral revenue growth of 4%, 8%, 13%, 17%, 14% and 11%.
Four-row percentage table across six quarterly columns with an underlined total row.
Quarter-end common shares outstanding of 459, 454, 449, 446, 445 and 440 million plus shares underlying outstanding RSUs of 24, 22, 19, 16, 20 and 19 million give quarter-end fully diluted shares of 483, 476, 468, 462, 465 and 459 million (Q2 2025–Q3 2026).
Three-row table in millions across six quarterly columns at the top of a white slide.
GAAP net income from continuing operations ($365, $593, $522, $512, $552 and $501 million) is bridged through income tax, depreciation, amortization, interest expense, interest income, equity investment gains/losses, executive bonuses and restructuring, legal matters and transaction costs to adjusted EBITDA of $674, $686, $691, $824, $792 and $757 million for Q2 2025–Q3 2026. Footnotes define each adjustment and explain the Q2 2025 change to depreciation and amortization in the EBITDA calculation and the ASU 2025-06 recast.
Ten-line reconciliation table across six quarterly columns followed by five numbered footnotes in small type.
Trailing-twelve-month adjusted EBITDA rose from $2,673M (Q2 2025) to $3,064M (Q3 2026) while gross debt stayed around $6.7B ($6,733M at Q3 2026). Total cash and non-equity investments fell from $5,358M to $3,347M (Q3 2026: cash and equivalents $1,166M, short-term investments $809M, long-term investments $1,372M). Net leverage moved from 0.5x to 1.1x and gross leverage from 2.5x to 2.2x. Footnotes define gross debt, net leverage and gross leverage and note the ASU 2025-06 recast of 2025 quarters.
Six-column table in millions with indented cash sub-rows, bold leverage ratio rows at the bottom and six numbered footnotes.
Q4 2026 (three months ending December 31, 2026): net revenue $3.19–$3.24B on both bases; diluted EPS $0.82–$0.87 GAAP vs. $1.48–$1.53 non-GAAP, excluding ~$30–$32M of acquired-intangible amortization, ~$163–$173M of stock-based compensation and payroll taxes, $130–$150M of restructuring and a ~$(41)–$(47)M tax adjustment. FY 2026: net revenue $12.62–$12.67B; diluted EPS $4.26–$4.31 GAAP vs. $6.25–$6.30 non-GAAP, excluding ~$79–$81M amortization, ~$695–$705M stock-based compensation, $212–$232M restructuring and a ~$(179)–$(184)M tax adjustment. GAAP EPS guidance assumes no future gains or losses on equity investments.
Two small GAAP vs. non-GAAP tables (quarter and full year) stacked in the centre of the slide, followed by two explanatory notes (a) and (b).
Explains that eBay early-adopted FASB ASU 2025-06 (internal-use software costs) effective January 1, 2026 using the full retrospective method, and presents 2025 and 2024 GAAP results as reported, adjustment and as recast. Recast full-year 2025: net revenues $11,100M, income from operations $2,258M (vs. $2,277M reported), income from continuing operations $1,981M and diluted EPS $4.23 (vs. $4.26); full-year 2024 recast diluted EPS $3.92 (vs. $3.95). The adjustment shifts costs from cost of net revenues into product development and trims operating margin by about 0.1–0.2 pts per period. The quarterly columns are in very small type.
Two bullets of explanatory text above a very wide three-block table (As Reported / Adjustment / As Recast), each block with four quarters and two full years.
Same restatement on a non-GAAP basis. Recast full-year 2025 non-GAAP income from operations $3,069M (vs. $3,085M reported), income from continuing operations $2,571M and non-GAAP diluted EPS $5.49 (vs. $5.52), operating margin 27.7% (vs. 27.8%); 2024 recast non-GAAP EPS $4.85 (vs. $4.88). Quarterly recast non-GAAP operating margins for 2025 were 29.6%, 28.3%, 27.0% and 26.0%.
Identical three-block wide table layout to the previous slide with the explanatory bullets on top.
Reconciles the adoption impact between GAAP and non-GAAP: the GAAP income statement adjustment (e.g. $(107)M cost of net revenues and $126M product development for FY 2025), the portion treated as GAAP-to-non-GAAP adjustments (stock-based compensation and related payroll taxes in capitalized software and their tax effects) and the resulting non-GAAP adjustment ($(91)M cost of revenues, $107M product development, $(0.03) per diluted share for FY 2025). Note (a) explains the stock-based compensation component.
Three-block wide table (Adjustment to GAAP, GAAP to Non-GAAP Adjustments, Adjustment to Non-GAAP) with a footnote under the middle block.
Shows that the ASU 2025-06 recast moves capitalized software spend between operating cash flow and purchases of property and equipment without changing free cash flow: FY 2025 operating cash flow goes from $2,009M reported to $1,876M recast and capex from $(525)M to $(392)M, leaving free cash flow at $1,484M (2024: $1,956M). Quarterly 2025 free cash flow was $644M, $(441)M, $803M and $478M.
Explanatory bullets above a three-row, three-block table (As Reported / Adjustment / As Recast).
Closing slide showing only the multicolor eBay logo.
Black full-bleed background with the red, blue, yellow and green eBay wordmark centred.
關於此幻燈片和基礎簡報內容的常見問題。
According to the deck, eBay reported $23.2B of GMV (15% spot, 16% FX-neutral growth), $3.21B of revenue (14% spot), $0.84B of non-GAAP operating income and $1.51 of diluted non-GAAP EPS, all above the guidance ranges of $22.0–$22.4B, $3.07–$3.12B, $0.77–$0.80B and $1.36–$1.42. GAAP EPS was $1.11. Slides 4 and 14 summarize these figures.
Q4 2026 guidance (including Depop) is GMV of $23.7–$24.1B, revenue of $3.19–$3.24B, non-GAAP operating income of $0.82–$0.85B and diluted non-GAAP EPS of $1.48–$1.53. Full-year 2026 guidance is GMV of $91.5–$91.9B, revenue of $12.62–$12.67B, non-GAAP operating income of $3.46–$3.49B and diluted non-GAAP EPS of $6.25–$6.30, with ~$2B of share repurchases targeted (slides 24–25).
Slide 9 states that Depop's US GMV, monthly active users and sold items more than doubled year over year on a pro forma basis, with improved repurchase, relist and resell rates. eBay is testing Depop listings inside eBay search and giving Depop access to eBay carrier rates. Depop is expected to add about 4 pts to Q4 FX-neutral GMV growth.
Focus Categories, C2C and Recommerce together represent 72% of total GMV (excluding Depop) and grew about 20% year over year in Q3 2026. Focus Category GMV grew 24% FX-neutral, led by collectibles, eBay Motors, fashion and refurbished goods, and both C2C and Recommerce grew more than 20% (slide 5).
It is eBay Inc.'s own 'Q3'26 Business & Financial Highlights' deck dated October 28, 2026, published on the eBay investor relations website (investors.ebayinc.com) with its third-quarter 2026 earnings release. The page here reproduces the slides and adds a written, page-by-page description.
Yes. The original PDF is available, along with a PPTX version converted from the PDF so you can reuse layouts such as the KPI snapshot, the guidance-vs-actuals table and the stacked bar charts. Because the PPTX is a machine conversion, some charts and tables may come through as images or need minor clean-up.
FX-Neutral (FXN) growth removes currency effects by applying prior-period foreign exchange rates to current-year transactional amounts, excluding hedging. 'Organic FXN' additionally strips out acquisitions such as Depop; for Q3 2026 revenue the bridge on slide 34 goes from 14% reported to 11% organic FX-neutral.
eBay early-adopted accounting standard ASU 2025-06 on internal-use software costs effective January 1, 2026 using the full retrospective method, so 2024 and 2025 results were restated. Slides 39–42 show the impact: for example, full-year 2025 non-GAAP EPS moved from $5.52 to $5.49, while free cash flow was unchanged at $1,484M.
Official investor relations site where eBay publishes quarterly earnings releases, presentations and SEC filings.
Original source file of this presentation, released October 28, 2026.

Create Your Own Slides
Turn your ideas into professional presentations in seconds with 2slides AI.
參考專業設計,選擇您的風格,產生具有完美文字渲染的投影片。由 Nano Banana 提供支援—立即開始建立您的簡報。


