
所屬合集: 投資人簡報案例 · 印度上市公司法說會簡報範例
Britannia Industries Q2 FY27 Earnings Presentation: the 20-slide Analyst Meet / Q2 2026-27 results and conference call deck from India's leading packaged-foods company (biscuits, cheese and dairy, bread, cakes, rusk and croissants), covering the July-September 2026 quarter and the first half of FY27. Filed with BSE/NSE (filed on BSE on 6 November 2026), it reports consolidated revenue from operations of Rs 5,542 crore for Q2 (+16.6% year on year, +11.6% sequentially) and Rs 10,506 crore for H1 FY27 (+13.1%), with owner's-share profit after tax of Rs 721 crore (13.0% of revenue, +10.2%). Amounts are in Indian rupees crore (Rs Crs), as the company presents them.
以這份簡報的封面作為風格參考,用您自己的內容產生幻燈片。 也可以在下方任選一頁,以它的版面作為參考。
快速導航
標籤
分享幻燈片
Britannia Industries Q2 FY27 Earnings Presentation: the 20-slide Analyst Meet / Q2 2026-27 results and conference call deck from India's leading packaged-foods company (biscuits, cheese and dairy, bread, cakes, rusk and croissants), covering the July-September 2026 quarter and the first half of FY27. Filed with BSE/NSE (filed on BSE on 6 November 2026), it reports consolidated revenue from operations of Rs 5,542 crore for Q2 (+16.6% year on year, +11.6% sequentially) and Rs 10,506 crore for H1 FY27 (+13.1%), with owner's-share profit after tax of Rs 721 crore (13.0% of revenue, +10.2%). Amounts are in Indian rupees crore (Rs Crs), as the company presents them.
每張幻燈片頁面的詳細視圖,包括版面、關鍵內容和視覺元素。
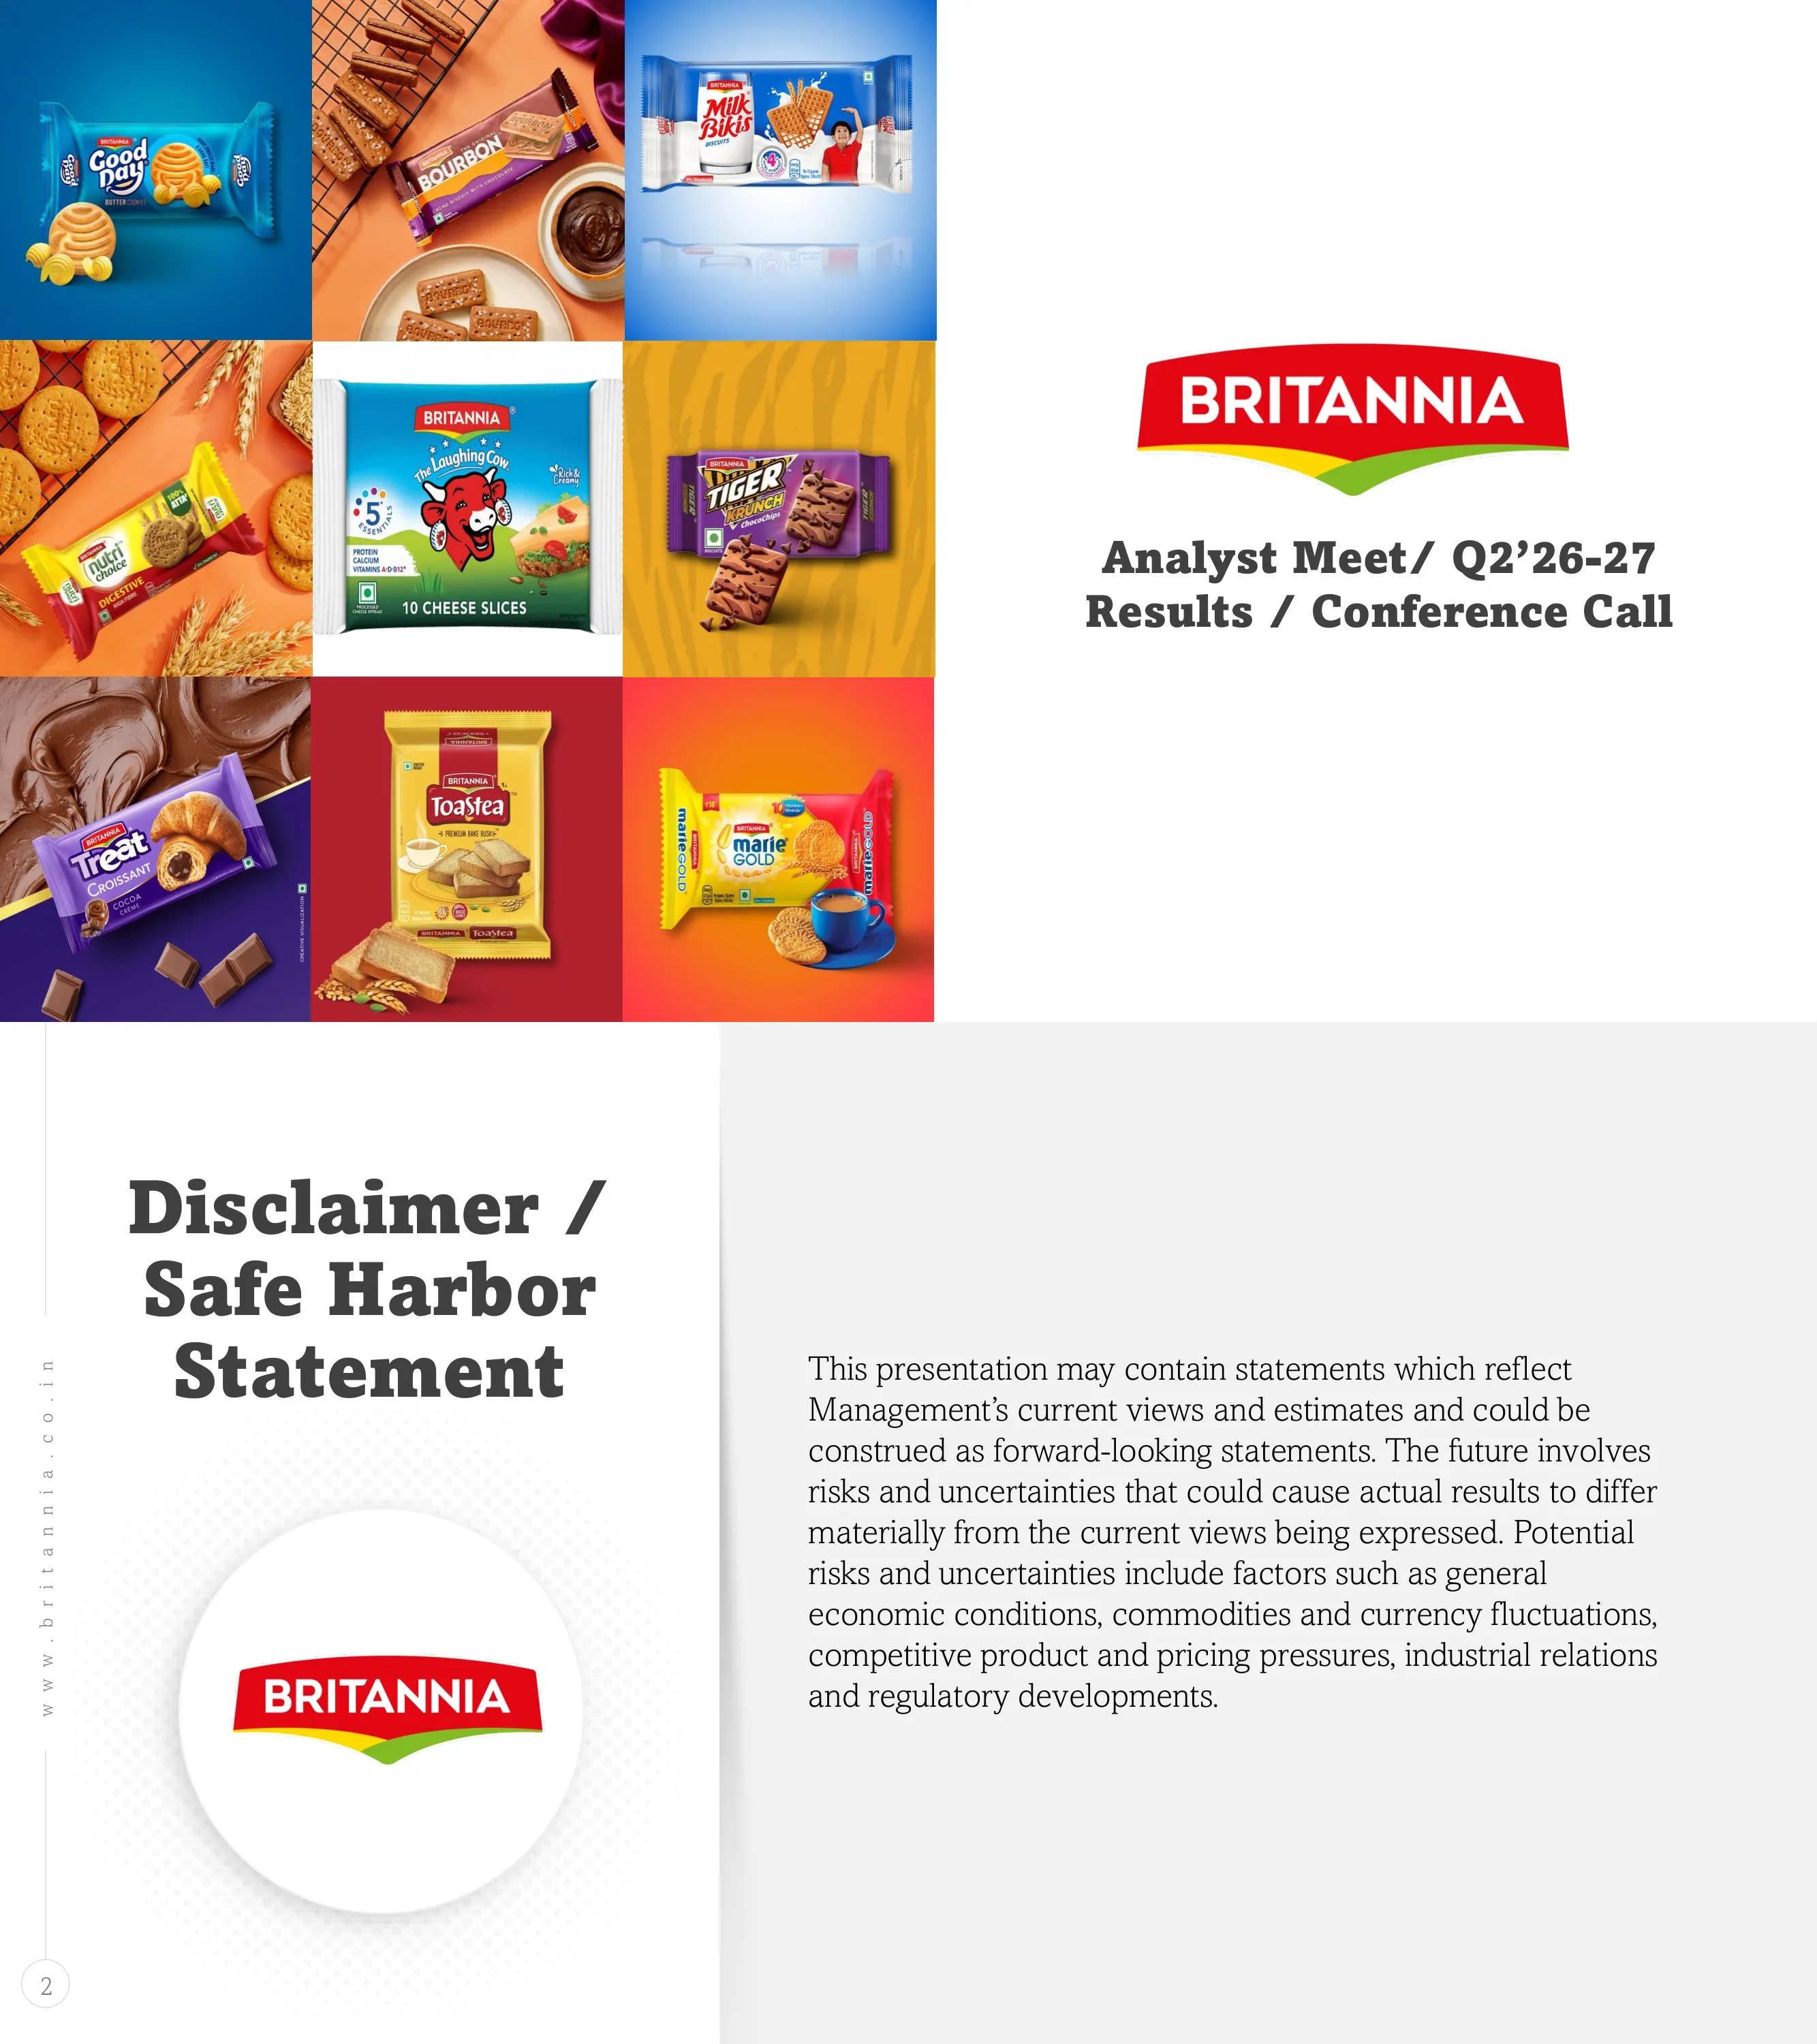
Cover slide titled 'Analyst Meet/ Q2'26-27 Results / Conference Call' beside the Britannia logo. The left two-thirds is a 3x3 grid of product photography showing Good Day butter cookies, Bourbon, Milk Bikis, NutriChoice Digestive, The Laughing Cow 10 cheese slices, Tiger Krunch ChocoChips, Treat Croissant, Toastea premium bake rusk and Marie Gold.
Split layout: a nine-tile product image grid on the left and a white panel on the right holding the logo and a two-line title.
Standard forward-looking statement notice: the presentation reflects management's current views and estimates, and actual results may differ because of risks such as general economic conditions, commodity and currency fluctuations, competitive product and pricing pressures, industrial relations and regulatory developments.
Two panels: title and circular logo badge on the left, a single paragraph of disclaimer text on a light grey panel on the right.
Three agenda items: Business Overview, Strategic Priorities, and Costs & Financials.
Large 'Agenda' circle on the left connected by a curved line to three stacked horizontal bars on the right.
Section break opening the Business Overview part of the deck.
Centered white half-circle with logo and section title over a grey halftone dot background.
Q2 FY27 consolidated revenue from operations of Rs 5,542 crore, up 16.6% on a 12-month basis and up 11.6% versus Q1'27. Profit after tax (owner's share) equals 13.0% of revenue, with 12-month growth of 10.2% and growth of 21.9% versus Q1'27. Source noted as company financials, consolidated results.
Two green header bands (Revenue from Operations, Profit after Tax) each over three white KPI cards: current quarter, 12-month growth, versus prior quarter.
First-half FY27 (H1'27) revenue from operations of Rs 10,506 crore, up 13.1% on a 12-month basis. H1 profit after tax (owner's share) is 12.5% of revenue, up 11.7%.
Same scorecard design as the previous slide but with two KPI cards per row (H1 value and 12-month growth).
Five strategic pillars: Efficiencies in Sales, Distribution & Supply Chain; Elevate Brand Experiences & Investments; Driving Innovation, Adjacencies & Future Platforms; Winning in 'Many Indias'; and Sustainability.
Five wooden pillars of varying heights, each topped with an isometric miniature scene (retail shelf and delivery scooter, factory with trucks, food platter with cheese and croissants, a town, wind turbines on grass) and a label card.
Line chart of year-on-year growth from Q1'25 to Q2'27 for General Trade and Other Channels (no axis values shown). Both lines rise to their highest points in Q2'27. Key messages: General Trade growth in Q2'27 is 2.6x that of FY 25-26; Other Channels continue to grow faster at 1.8x of General Trade; E-commerce contribution is now about 7%.
Wide line chart in a rounded card with a bullet text box below and the pillar-01 isometric illustration at the right edge.
Line chart of year-on-year growth for Key States versus Others; the chart's x-axis runs Q1'25 to Q1'27, with a dip in Q2'26 and recovery after. Bullets: Key States growth in Q2'27 is 2.8x that of FY 25-26; growth in Other States continues to outpace Key States. Footnote: Key States contribute more than 50% of domestic revenue.
Line chart card on top, bullet box below, pillar-01 illustration on the right, footnote at bottom left.
Two campaign examples. NutriChoice Portfolio: a 'Make a good choice with Britannia NutriChoice' print ad (no maida, high fibre, great taste) showing Oats & Millets, Millet Cookies, 5 Grain, Digestive Seeds, Digestive Zero and Digestive variants. Little Hearts: a World Emoji Day 'Share the OG Heart' social creative with a scan-to-share QR code.
Two large creative images side by side in rounded cards with green caption buttons below, pillar-02 factory illustration at right.
Two new The Laughing Cow cheese launches under Britannia: Korean Chilli Cheese Slices and Italian Herb Cheese Slices, both 5-slice packs of flavoured processed cheese spread.
Two pack shots in a single rounded card with red and green caption buttons, pillar-03 food-platter illustration on the right.
Adjacent bakery businesses (cake, rusk, wafers and croissant) grew more than 20% during the quarter, illustrated by a Fudge It choco brownie cake ad and the 'Kunafa se hoga Munafa' Treat Croissant Dubai Kunafa contest. Dairy: cheese, ghee and milk drinks led the business into double-digit growth (Laughing Cow cheese and Sattvam cow ghee visuals). International business: a resilient rebound into mid-teens growth across key geographies, with a map marking America, Egypt, Africa, Kenya, Middle East and Nepal.
Three content cards: a full-width top card (two ads flanking a growth statement) and two bottom cards (dairy images; world map with pins).
Two regional festive campaigns: Bourbon x Bombay Sweet Shop limited-edition Bourbon Chocolate Modak for Ganesh Chaturthi, and 50-50 Cheeze Dipped for Onam, shown on a banana-leaf sadhya with Malayalam copy ('50% Sweet, 50% Savoury').
Two campaign images in side-by-side rounded cards with green captions; pillar-04 town illustration on the right.
Progress on ESG KPIs: women make up 45% of the factory workforce; 5,73,663 (573,663) Britannia Nutrition Foundation beneficiaries reached by H1'27; renewable electricity share in own plants at 48%.
Central card under a green 'Progress on ESG KPIs' header with three icon-plus-text rows; wind-turbine pillar illustration on the right.
Section break introducing the cost and financial results part of the deck.
White half-circle with logo and title on a halftone background, with coin-and-sapling imagery in the bottom corners.
Six small line charts from Q1'26 to Q2'27 (no axis values) with change callouts. Flour: +9% vs Q1'27, -4% vs Q2'26. Refined palm oil: +11% vs Q1'27, +17% vs Q2'26. Sugar: +4% vs Q1'27, +6% vs Q2'26. Milk: +2% vs Q1'27, +16% vs Q2'26. Laminate: +7% vs Q1'27, +18% vs Q2'26. Industrial fuel: -21% vs Q1'27, +45% vs Q2'26. Notes: strategic covers kept input costs below market prices; values are based on average actual consumption rates for the quarter.
2x3 grid of chart cards, each with a commodity title and a circular callout badge holding the two percentage changes; notes along the bottom.
Quarterly consolidated sales in Rs crore. FY 23-24 (4% growth): 3,970; 4,370; 4,192; 4,014. FY 24-25 (6%): 4,130; 4,566; 4,463; 4,376. FY 25-26 (8%): 4,535; 4,752; 4,885; 4,686. H1'27 (13%): Q1 4,964; Q2 5,542. 12-month growth by quarter across the 10 quarters from Q1 FY 24-25 to Q2 FY27: 4%, 4%, 6%, 9%, 10%, 4%, 9%, 7%, 9%, 17%; 24-month growth: 13%, 5%, 9%, 12%, 14%, 9%, 17%, 17%, 20%, 21%.
Fourteen-bar column chart grouped by fiscal year on shaded panels, with two rows of growth-rate boxes above the bars; the latest quarter is highlighted in darker grey.
Q2 FY27 in Rs crore with growth vs Q2 25-26: net sales 5,542 (+16.6%); operating profit 943 (+8.5%); profit before tax 977 (+10.6%); profit after tax, owner's share, 721 (+10.2%). Margin history (21-22, 22-23, 23-24, 24-25, 25-26, Q1'27, Q2'27): profit from operations 14.3%, 16.3%, 17.3%, 16.4%, 17.0%, 15.3%, 17.0%; PBT 14.9%, 19.0%, 17.6%, 16.7%, 17.4%, 16.1%, 17.6%; PAT (owner's share) 10.9%, 14.5%, 12.9%, 12.4%, 13.4%, 11.9%, 13.0%.
Two green-header tables: a compact four-row P&L table on top and a wide three-row margin table spanning seven periods below.
H1 FY27 in Rs crore with growth vs H1 25-26: net sales 10,506 (+13.1%); operating profit 1,704 (+10.3%); profit before tax 1,775 (+12.0%); profit after tax, owner's share, 1,312 (+11.7%). Margin history (21-22 to 25-26, then H1'27): profit from operations 14.3%, 16.3%, 17.3%, 16.4%, 17.0%, 16.2%; PBT 14.9%, 19.0%, 17.6%, 16.7%, 17.4%, 16.9%; PAT 10.9%, 14.5%, 12.9%, 12.4%, 13.4%, 12.5%.
Same two-table layout as the Q2 slide, with six period columns in the margin table.
Closing slide with the Britannia logo and 'Thank You!'.
Centered white circle with logo and text on a halftone dot background.
關於此幻燈片和基礎簡報內容的常見問題。
It covers the second quarter of fiscal year 2026-27, i.e. July to September 2026, plus the first half (April-September 2026). Indian companies use an April-March fiscal year, so FY27 runs from April 2026 to March 2027.
Consolidated revenue from operations was Rs 5,542 crore, up 16.6% year on year and 11.6% over Q1 FY27. Operating profit was Rs 943 crore (+8.5%), profit before tax Rs 977 crore (+10.6%), and owner's-share profit after tax Rs 721 crore (+10.2%), or 13.0% of revenue.
H1 FY27 net sales were Rs 10,506 crore (+13.1%), operating profit Rs 1,704 crore (+10.3%), profit before tax Rs 1,775 crore (+12.0%) and profit after tax Rs 1,312 crore (+11.7%), a 12.5% PAT margin.
Britannia filed it with the Indian stock exchanges BSE and NSE; the BSE filing is dated 6 November 2026. The original exchange filing opens with a cover letter, which has been removed from the version here.
Flour, refined palm oil, sugar, milk, laminate and industrial fuel. In Q2 FY27, palm oil rose 17% and laminate 18% year on year, and industrial fuel rose 45% year on year but fell 21% from Q1. Management notes that strategic covers kept its input costs below market prices.
Five pillars: efficiencies in sales, distribution and supply chain; brand experiences and investments; innovation, adjacencies and future platforms; winning in 'Many Indias' through regional campaigns; and sustainability. Supporting slides show E-commerce at about 7% of sales, adjacent bakery growth above 20% and mid-teens international growth.
Yes. The page offers the original PDF and an editable PPTX converted from it. The conversion is automated, so some charts and images may need adjusting in PowerPoint.
All amounts are in Indian rupees crore (Rs Crs), as the company presents them. One crore equals 10 million rupees.
Original exchange filing of 6 November 2026; it includes a cover letter before the presentation.

Create Your Own Slides
Turn your ideas into professional presentations in seconds with 2slides AI.
參考專業設計,選擇您的風格,產生具有完美文字渲染的投影片。由 Nano Banana 提供支援—立即開始建立您的簡報。


