
所屬合集: 投資人簡報案例
Bajaj Finance Limited's Q2 FY27 investor presentation dated 19 October 2026, filed with the Indian stock exchanges (BSE/NSE). The 68-page deck reports AUM of ₹584,624 crore (+26%), PAT of ₹6,367 crore (+29%) and a 128.85 MM customer franchise for the quarter ended 30 September 2026. It also covers the subsidiaries Bajaj Housing Finance Ltd (BHFL) and Bajaj Financial Securities Ltd (BFSL). Indian FY27 runs April 2026 to March 2027, so Q2 FY27 is July to September 2026.
以這份簡報的封面作為風格參考,用您自己的內容產生幻燈片。 也可以在下方任選一頁,以它的版面作為參考。
快速導航
標籤
分享幻燈片
Bajaj Finance Limited's Q2 FY27 investor presentation dated 19 October 2026, filed with the Indian stock exchanges (BSE/NSE). The 68-page deck reports AUM of ₹584,624 crore (+26%), PAT of ₹6,367 crore (+29%) and a 128.85 MM customer franchise for the quarter ended 30 September 2026. It also covers the subsidiaries Bajaj Housing Finance Ltd (BHFL) and Bajaj Financial Securities Ltd (BFSL). Indian FY27 runs April 2026 to March 2027, so Q2 FY27 is July to September 2026.
每張幻燈片頁面的詳細視圖,包括版面、關鍵內容和視覺元素。
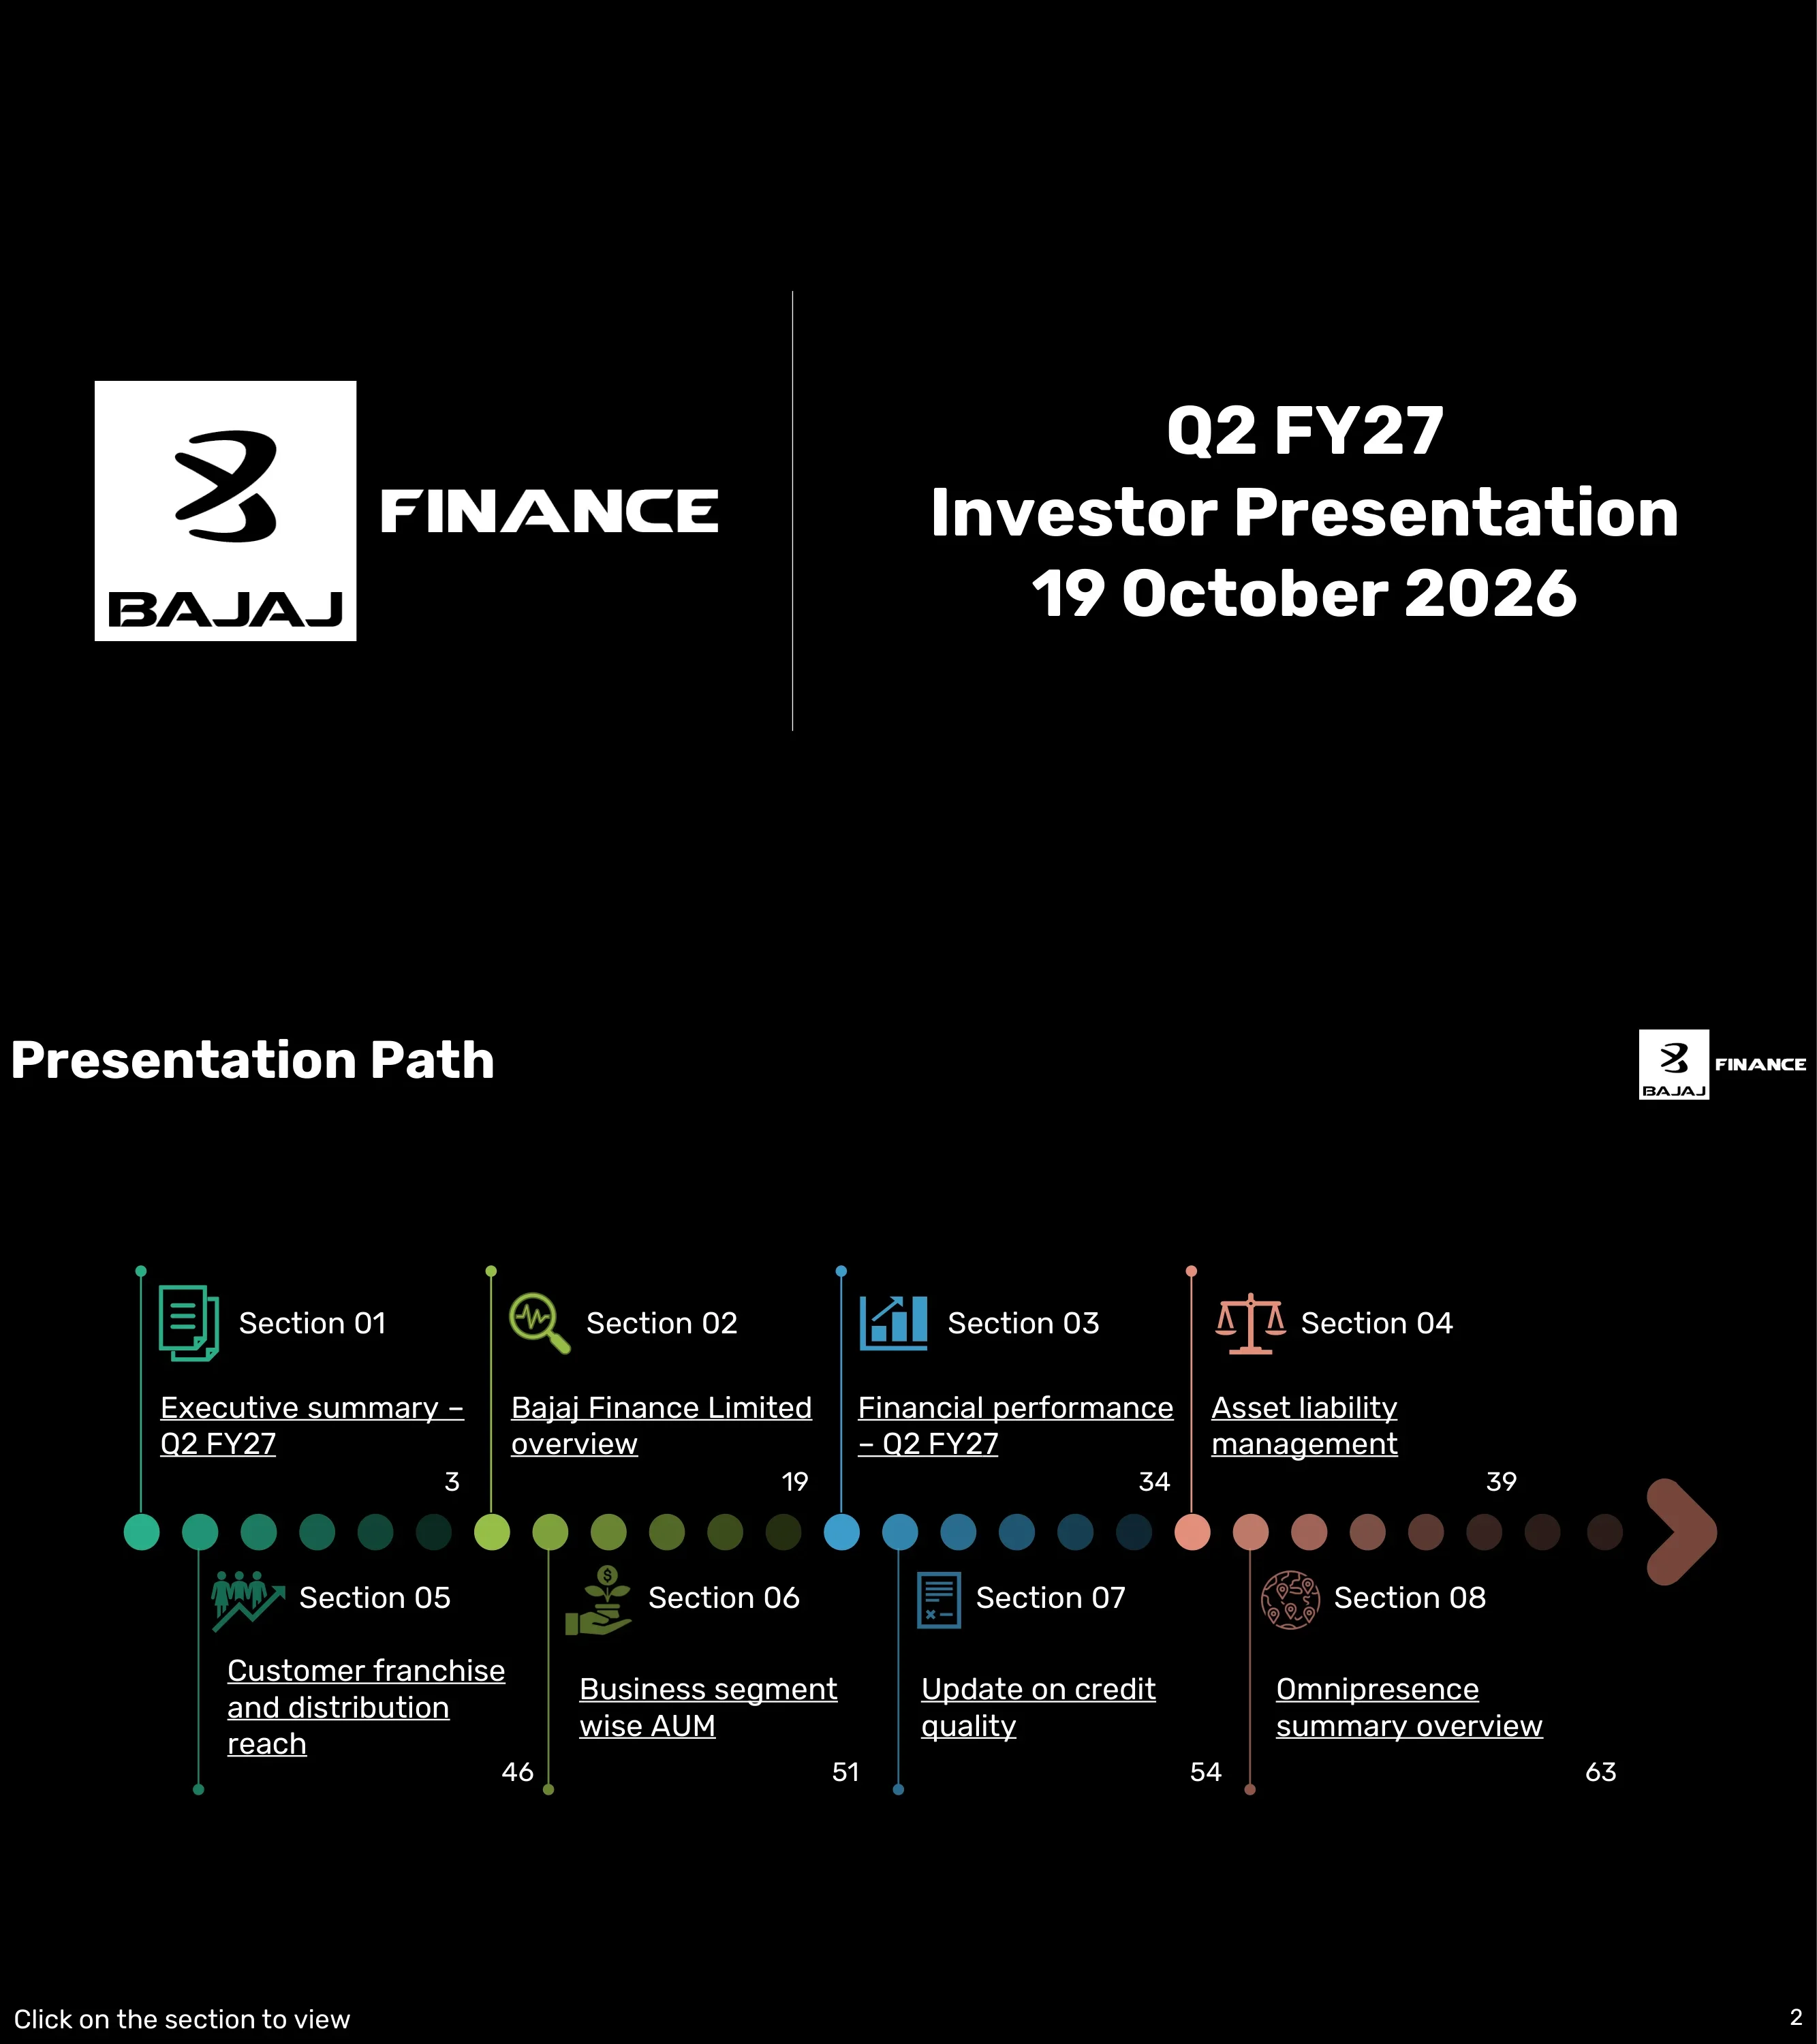
Cover of the Bajaj Finance Q2 FY27 Investor Presentation dated 19 October 2026.
Black background with the Bajaj Finance logo on the left, a vertical white divider, and the deck title and date on the right.
Agenda of 8 sections with starting pages: Executive summary 3, BFL overview 19, Financial performance 34, ALM 39, Customer franchise 46, Segment AUM 51, Credit quality 54, Omnipresence 63.
Black background with a horizontal dotted timeline in 8 colours, an icon and page reference per section, and a Click on the section to view hint.
Divider for the executive summary with two sub-topics: 1.1 Quarter gone by and 1.2 Lead financial indicators.
Black split layout: large Section 01 title and a teal-green line icon on the left half, dashed vertical timeline with numbered circles on the right half.
An excellent quarter: AUM up 26% to ₹584,624 crore, AUM addition of ₹37,680 crore, PBT up 29% to ₹8,537 crore, 13.45 MM new loans, 4.42 MM new customers and a 128.85 MM franchise. PAT is ₹6,367 crore (+29%), ROE 20.6% and Net NPA 0.42%.
Black background with a large centred summary paragraph above a row of six outlined white circles holding the headline metrics.
AUM ₹584,624 crore vs ₹462,261 crore, new loans 13.45 MM (+11%), 4.42 MM customers added and a 128.85 MM franchise with 82.36 MM cross-sell. Covers 4,091 locations, 254K+ distribution points, liquidity buffer of ₹19,995 crore, cost of funds 7.31% and deposits of ₹69,754 crore (14% of borrowings).
Black background with a numbered bullet list in white text, with guidance figures for FY27 inline.
NII up 24% to ₹13,335 crore, NTI up 23% to ₹15,974 crore and Opex/NTI at 33.0%. Loan losses were ₹2,166 crore including a ₹337 crore management and macro provision, with 75,845 employees and Stage 2 and 3 at 2.02%.
Black background with a numbered bullet list in white text covering income, cost, people and provisioning.
GNPA 1.06% and NNPA 0.42% versus 1.24% and 0.60%, stage 3 PCR 60%, PPOP up 23% to ₹10,699 crore. PBT is ₹8,537 crore (+29%), PAT ₹6,367 crore, ROA 4.6%, ROE 20.6%, CRAR 20.33% and leverage 5.1x.
Black background with a numbered bullet list in white text on asset quality, profit and capital.
The Board approved on 1 October 2026 a QIP of up to ₹11,700 crore and preferential warrants of up to ₹5,800 crore to Bajaj Finserv. The rationale cites India growth, momentum and resilience across capital, talent, technology, AI, cyber, compliance, provisioning and liquidity.
Black background with a short text slide: heading, two capital-raise bullets and a rationale paragraph.
AI unit employees reached 328 (+171%), with 56 MM voice-to-data interactions, 0.4 MM loan offers from AI (+327%) and 13 voice bots plus 24 consumer text bots. Promotional SMS AI-bot penetration is 77% with 2.65x CTR.
Black background with a data table of Stage, Metric, UoM, Q2 FY26, Q1 FY27, Q2 FY27 and YoY columns, grey header row.
Face match reached 6.7 MM (+442%), 29 MM documents were processed and auto-QC covered 22.8 MM documents. Disbursal from AI-bot leads was ₹2,744 crore (+112%), voice log processing drove ₹596 crore and 75% of servicing was DIY via AI bots.
Black background with the same metrics table format, grouped by stage with alternating grey highlight rows.
The debt-management AI text bot collected 0.32 MM receipts with 45% SMS penetration and 1.3x CTR. BRDs are 100% AI-generated, with 130 AI agents and 65 agentic AI deployments.
Black background with a compact metrics table in the same column structure.
Roadmap across Data Intelligence (image analytics across 50 document types, about 30 Cr records), Consumer AI (22 business and 2 service journeys re-architected, discovery on ChatGPT and Gemini live) and Agentic AI (600+ sub-agents under 250 autonomous agents, 118 use cases in FY27).
Black background with a three-column table of Details, Timelines and Status grouped by AI workstream.
Custom AI model for NTB/NTC variables targets about 5 lakh incremental accounts and is live, with a PL risk scorecard due Q4 FY27 and an AI fraud model in Q3 FY27. AI governance spans 8 domains with continuous red teaming, vibe coding becomes SOP for new BRDs and AI bots in service communications target 1.5x CTR.
Black background with the roadmap table format listing initiatives, timelines and status.
BHFL AUM crossed ₹1.5 lakh crore, up 25% to ₹158,205 crore, with PBT up 18% to ₹980 crore. GNPA is 29 bps and NNPA 12 bps; PAT is ₹757 crore (+18%) and ROE 12.7%.
Black background with a centred summary paragraph above a row of four outlined white KPI circles (Opex/NTI 19.1%, PAT, ROE, NNPA).
Home loans grew 22%, LAP 26%, LRD 39% and DF 13%, with a mix of 53.9:10.3:24.0:10.7:1.1. Approvals were ₹31,288 crore, disbursements rose 25% to ₹19,935 crore, across 182 locations, with cost of funds at 7.04% (-17 bps).
Black background with a numbered bullet list in white text covering mix, disbursements, liquidity and borrowing mix.
NII rose 10% to ₹1,055 crore and NTI 15% to ₹1,254 crore, with Opex/NTI at 19.1% and 2,053 employees. Loan losses were ₹35 crore (credit cost 0.10%), PBT ₹980 crore, PAT ₹757 crore, ROE 12.7% and CRAR 21.24%.
Black background with a numbered bullet list in white text on income, cost, credit and capital.
BFSL AUM grew 59% to ₹12,058 crore and PAT 36% to ₹64 crore, adding 121K customers for a franchise of 1.61 MM (+40%). NTI is ₹160 crore (+20%) and PBT ₹86 crore (+34%).
Black background with a summary paragraph above a row of five outlined white KPI circles.
BFSL added 121K customers versus 94K a year earlier, across 43 locations, with NTI of ₹160 crore. Opex/NTI improved to 45.6% from 51.1%, with 840 employees, ROE 11.6% and net worth of ₹2,300 crore.
Black background with a numbered bullet list in white text.
Divider for the BFL overview with sub-topics from 2.1 Group structure to 2.8 Executive summary.
Black split layout with a large Section 02 title and olive-green line icon on the left and a dashed vertical timeline of numbered circles 2.1 to 2.8 on the right.
Bajaj Finserv holds 51.30% of Bajaj Finance, which holds BHFL at 86.70% and BFSL at 100%. Other group entities include Bajaj Life Insurance and Bajaj General Insurance (77.33%), Bajaj Finserv Health (100%), Bajaj Finserv Direct (80.1%) and Bajaj Asset Management (100%).
Black background with an org chart of white rounded pill nodes, grey percentage tags and a dashed box around the BFL cluster.
Five principles: a diversified non-bank with a deposit license, mass and affluent focus through cross-sell, diversified risk and profit mix, ROA of 4.3 to 4.7% with ROE of 19 to 21%, and continuous innovation.
Black background with five quoted statements stacked vertically and separated by thin grey rules.
Target corridors: AUM growth 23 to 25%, profit growth 23 to 24%, GNPA below 1.4%, NNPA below 0.5%, ROA 4.3 to 4.7% and ROE 19 to 21%.
Black background with a 2 by 3 grid of outlined icon tiles, each with a metric label and target range.
BFL 3.0 is described as a FINAI company serving 200 MM customers, backed by the Bajaj group brand and a 128.85 MM franchise. The AUM mix Urban:Rural:MSME:Commercial:Mortgages is 30:12:13:13:32 and the borrowing mix is 52:29:14:5.
Black background with a two-column table of differentiator labels on the left and supporting descriptions on the right.
Promoters hold 54.67%, FII and FPI 19.79%, mutual funds 10.32%, corporates 7.60% and individuals 7.25%. The top-20 investor table lists Bajaj Finserv at 51.30%, Maharashtra Scooters at 3.06% and LIC at 1.63%.
Black background with a grey donut chart on the left and a top-20 investor table on the right with Sep 25, Jun 26 and Sep 26 columns.
From FY08 to FY26, AUM grew from ₹2.5k crore to ₹510.0k crore (34% CAGR) and PAT from ₹21 crore to ₹19,332 crore (46% CAGR). Franchise grew from 0.8 to 119.3 MM, with ratio rows for Opex/NTI, credit cost, ROA, ROE, NNPA, PCR, CRAR and leverage.
Black background with a dense 19-column table, grey header row, alternating grey highlight rows and a dashed CAGR column.
From FY18 to FY26, BHFL AUM grew from ₹3,570 crore to ₹140,706 crore (58% CAGR) and PAT from ₹10 crore to ₹2,560 crore. Capital infusions include the ₹3,560 crore IPO in September 2024.
Black background with a nine-year dense table, grey header, ratio rows and a CAGR column.
BFL offers 13 Retail-Urban products, 10 MSME, 6 Commercial and 9 Retail-Rural products, plus Deposits, Payments and insurance distribution. BHFL has 9 mortgage products and BFSL 11 broking products.
Black background with multi-column lists grouped by business and entity under grey headings.
Standalone AUM is ₹426,879 crore with mix Urban:Rural:SME:Commercial:Mortgage of 41:16:18:15:10, PAT ₹5,536 crore and CRAR 20.33%. Consumer Finance spans 244K+ POS across 1,515 urban and 2,576 rural locations, with 100.38 MM EMI card CIF.
Black background with a row-label table: business names on the left and bullet descriptions on the right.
Covers MSME, Gold Loan (top-5 NBFC gold lender, 2,022 branches heading to 2,700 to 2,800), Wheels (110 locations, 3,200 dealers, 26 OEMs), Commercial and Microfinance (loans of ₹20,000 to ₹100,000, 11 states, 480 branches, GNPA 0.47%).
Black background with a row-label table of businesses and bullet descriptions.
Covers LAS in 21 locations, Deposits at 19% of standalone borrowings, and Treasury with 7.40% cost of funds and ₹370,644 crore borrowings. Standalone GNPA is 1.33% and NNPA 0.53%, with AAA/Stable domestic ratings, S&P BBB/Stable and Moody's Baa3.
Black background with a row-label table covering LAS, Deposits, Treasury, credit quality, ratings and regulators.
BHFL home loans carry an average ticket of ₹49.5 lakh across 182 locations, with a salaried:self-employed:professional mix of 83:14:3. Loan against property averages ₹99.9 lakh across 74 locations.
Black background with a row-label table of overview, home loans and LAP.
Covers lease rental discounting in 18 locations with escrow backing and developer finance for A/A+ developers. Treasury borrowings are ₹118,259 crore at 7.04% cost of funds, with AAA ratings and RBI/NHB, SEBI and IRDAI as regulators.
Black background with a row-label table for LRD, developer finance, credit quality, treasury, ratings and regulators.
BFSL AUM is ₹12,058 crore (MTF ₹10,498 crore, ESOP financing ₹1,560 crore). Branch broking serves 100K UHNI/HNI clients across 43 locations; retail broking added 116K accounts for 1.51 MM clients with 1,700+ partners.
Black background with a row-label table of AUM, branch broking, retail broking, ratings and regulator.
Divider for financial performance with sub-topics from 3.1 Consolidated to 3.4 BFSL.
Black split layout with a large Section 03 title and blue line icon on the left, dashed timeline with numbered circles 3.1 to 3.4 on the right.
Q2 FY27 AUM is ₹584,624 crore (+26%), NII ₹13,335 crore (+24%), NTI ₹15,974 crore, opex ₹5,275 crore, PPOP ₹10,699 crore and loan losses ₹2,166 crore. PBT is ₹8,537 crore and PAT ₹6,367 crore (+29%), with H1 PAT of ₹12,447 crore and EPS of ₹10.07.
Black background with a financial table in ₹ crore comparing Q2 FY27 vs Q2 FY26, H1 FY27 vs H1 FY26 and FY26, with dashed separators between column groups.
Standalone AUM is ₹426,879 crore, NII ₹12,150 crore (+25%), NTI ₹14,521 crore, PPOP ₹9,552 crore and loan losses ₹2,131 crore. PAT is ₹5,536 crore (+30%), ROE 20.2% and EPS ₹8.90.
Black background with the same Q/H/FY financial table layout in ₹ crore.
BHFL AUM is ₹158,205 crore, NII ₹1,055 crore and NTI ₹1,254 crore. PAT is ₹757 crore (+18%), credit cost 0.10%, ROE 12.7% and EPS ₹0.91.
Black background with the Q/H/FY financial table layout in ₹ crore.
BFSL AUF is ₹12,058 crore (+59%), with NII ₹117 crore, fees ₹45 crore and NTI ₹160 crore. PAT is ₹64 crore (+36%), ROE 11.59% and EPS ₹0.45.
Black background with the Q/H/FY financial table layout in ₹ crore.
Divider for ALM with sub-topics: 4.1 leverage, 4.2 resilient model, 4.3 and 4.4 behaviouralized ALM for BFL and BHFL, 4.5 disciplined ALM and 4.6 liability mix.
Black split layout with a large Section 04 title and salmon-red line icon on the left, dashed timeline of numbered circles on the right.
From March 2017 to September 2026, Tier 1 stands at 19.4%, Tier 2 at 0.9%, CRAR at 20.3% and leverage at 5.1x (standalone about 4.4x), against a stepped leverage threshold of 7.0, 6.0 and 5.5.
Black background with a multi-line chart on a time axis, a stepped threshold line and dashed yellow circles marking capital-raise trigger points.
Cost of funds fell from 9.00% to 7.31% between March 2017 and September 2026, ROA is 4.6%, fee income to PBT 27.7% and opex to NTI improved from 41.7% to 33.0%.
Black background with a four-series line chart in yellow, blue, grey and orange with end-point value labels.
Total inflows are ₹525,582 crore with positive cumulative mismatch in all buckets up to 5 years. Additional borrowings of ₹49,600 crore are possible and daily average LCR is 214% against a 100% requirement.
Black background with a maturity-bucket table from 1-7 days to over 5 years showing inflows, outflows and cumulative mismatch.
BHFL total is ₹191,548 crore, with additional borrowings of ₹3,909 crore possible and an LCR of 146%.
Black background with a maturity-bucket table matching the BFL layout.
From March 2018 to September 2026, the cumulative gap up to 1 month stands at 71% and up to 12 months at 43% in September 2026.
Black background with a two-line chart on a time axis with end-point labels.
In September 2026 the liability mix is deposits 14%, bank loans 30%, NCD 40%, sub debt 0%, short-term 11% and ECB 5%, tracked from March 2018.
Black background with a 100% stacked area chart in grey shades with percentage labels for the latest period.
Divider for customer franchise and distribution with sub-topics 5.1 to 5.4.
Black split layout with a large Section 05 title and teal-green line icon on the left, dashed timeline with numbered circles 5.1 to 5.4 on the right.
Total franchise grew from 110.64 MM in Q2 FY26 to 128.85 MM in Q2 FY27, with 82.36 MM (63.9%) in the cross-sell franchise. Quarterly customer additions ran 4.69, 4.13, 4.76, 3.93, 5.10 and 4.42 MM from Q1 FY26 to Q2 FY27.
Black background with an inverted funnel comparing three periods and a chevron row of quarterly customer additions below.
PPC rose from 5.81 in FY23 to 6.11 in H1 FY27, split across lending, distribution, deposits and payments. By months on book, PPC is 3.51 at 12 MOB, 3.72 at 18 MOB and 4.65 at 24 MOB.
Black background with a definition text block and two stacked bar charts in grey shades.
BFL operates in 4,091 locations (1,515 urban and 2,576 rural), with gold loan branches growing from 770 to 2,022 and MFI branches from 12 to 480 between September 2023 and September 2026.
Black background with a dotted India map on one side and a September 2023 to September 2026 location table on the other.
Active distribution points total 253,900+ (+4,150 in Q2), including CD stores urban 57,550+, rural 72,700+, digital product stores 50,550+, lifestyle 25,650+ and DSA 6,650+.
Black background with a channel-by-period table from September 2023 to September 2026 and the latest column inside a dashed box.
Divider for segment-wise AUM with sub-topics 6.1 Consolidated and 6.2 Mortgages and BHFL.
Black split layout with a large Section 06 title and olive-green line icon on the left, dashed timeline with numbered circles 6.1 and 6.2 on the right.
Mortgages are ₹187,133 crore (32.01%, +30%), urban personal loans ₹115,237 crore (19.71%), MSME ₹53,084 crore (+3%), gold loans ₹24,195 crore (+105%) and LAS ₹41,949 crore (+42%). Total AUM is ₹584,624 crore (+26%) with 100.4 MM CIF.
Black background with a 14-segment table split by BFL and BHFL, with YoY growth and composition columns and a highlighted total row.
Consolidated mortgages total ₹187,133 crore (+30%): HL ₹86,530 crore, LAP ₹43,784 crore (+43%), LRD ₹39,915 crore (+43%) and DF ₹16,904 crore. BHFL total is ₹158,205 crore (+25%).
Black background with two stacked tables, consolidated mortgages above and BHFL below, with growth columns.
Divider for credit quality with sub-topics 7.1 to 7.5.
Black split layout with a large Section 07 title and blue line icon on the left, dashed timeline with numbered circles 7.1 to 7.5 on the right.
Total GNPA is ₹6,196 crore (1.06%), NNPA ₹2,453 crore (0.42%) and PCR 60%. Captive 2W/3W shows GNPA of 18.45%, against a sustainability corridor of GNPA below 1.4% and NNPA below 0.5%.
Black background with a segment table of AUM, GNPA, NNPA and PCR with GNPA% and NNPA% for Sep'25, Jun'26 and Sep'26.
Gross receivables are ₹574,375 crore in stage 1, ₹5,619 crore in stage 2 and ₹6,196 crore in stage 3, with ECL of ₹6,093, ₹2,178 and ₹3,743 crore. PCR is 1.06%, 38.79% and 60.41%, and stage 2 PCR excluding gold loans is 48.03%.
Black background with a three-stage table plus comparison rows for Jun'26 and Sep'25.
BHFL total GNPA is ₹410 crore (0.29%), NNPA ₹165 crore (0.12%) and PCR 59.80%, shown across HL, LAP, LRD, DF and others.
Black background with a product-level table of AUM, GNPA, NNPA and PCR across three periods.
BHFL gross receivables are ₹139,782 crore in stage 1, ₹440 crore in stage 2 and ₹410 crore in stage 3, with PCR of 0.29%, 27.44% and 59.80%.
Black background with a three-stage table and comparison rows.
Stage 1 share is 99.57% for Consumer Durable and Lifestyle, 99.45% for Digital Product, 99.63% for Rural Consumer Finance and 98.96% for Urban Personal Loans (stage 2 at 0.62%).
Black background with four quadrant stacked bar charts from Feb'20 pre-COVID benchmark to Sep'26, each with stage-1 and stage-2 percentage boxes and green status dots.
Stage 1 share is 99.26% for Rural Personal Loans, 98.37% for Business and Professional loans, 98.23% for Loan against property and 99.30% for Home loans.
Black background with four quadrant stacked bar charts and stage percentage boxes, same format as the previous page.
Gold loans show stage 1 at 94.83% and stage 2 at 4.51%, a transitional spike. MFI lending is 99.56%, Commercial lending 99.78% and Loan Against Securities 99.96%.
Black background with four quadrant stacked bar charts and stage percentage boxes.
Stage 1 share is 98.70% for Car loans, 98.46% for CV and Tractor and 98.30% for Open Market 2W and 3W. Captive 2W and 3W is 78.03% with stage 2 at 10.70%, marked with a white dot as the portfolio is in rundown.
Black background with four quadrant stacked bar charts, with green status dots and one white dot for the rundown portfolio.
Divider for the omnipresence summary with sub-topics 8.1 Omnipresence metrics and 8.2 Customer franchise key financial metrics.
Black split layout with a large Section 08 title and salmon-red line icon on the left, dashed timeline with numbered circles 8.1 and 8.2 on the right.
BFL has 4,091 locations, 24.45 MM app downloads (+13%), 94.0 MM cumulative app net installs (+20%), 159 MM web traffic, 66.10 MM UPI handles (+38%) and 4.00 MM merchant QRs.
Black background with a metrics table of Q2 FY26, Q1 FY27, Q2 FY27 and YoY columns.
Easy EMI loans reached 0.35 MM (+168%), app and web personal loans disbursed ₹6,526 crore (+20%) and gold loan origination ₹1,606 crore (+133%). Digital EMI cards have 13.1 MM CIF and generated 0.70 MM B2B loans.
Black background with the same four-column metrics table format.
H1 FY27 shows 29.6 MM new loans (+15%) and 9.5 MM new customers (+8%), with a total franchise of 128.8 MM and cross-sell of 82.4 MM. AUM per cross-sell customer is ₹70,985 (+10%) and PAT per cross-sell customer ₹1,511 (+11%).
Black background with a table covering FY19 to FY26 plus H1 FY26 and H1 FY27 columns and a dashed separator.
Full-text legal page stating that the deck is not an offer, includes forward-looking statements and may have been converted to markdown with AI tools.
Black background with dense white paragraph text across the page.
Two-column abbreviation table defining terms such as ALM, AUF, BBPS, CIF, ECL, FPI, GNPA, LAS, LCR, LRD, MFI, MTF, NNPA, PCR, PPI, UPI, WCDL and XIRR.
Black background with a two-column table of abbreviation and full meaning with grey row dividers.
關於此幻燈片和基礎簡報內容的常見問題。
It is a 68-page investor presentation from Bajaj Finance Limited dated 19 October 2026. It was filed with the Indian stock exchanges (BSE and NSE) as a corporate filing, and the original PDF is available on BSE.
Indian fiscal years run from April to March. FY27 is April 2026 to March 2027, so Q2 FY27 is the quarter from July to September 2026, with the balance sheet dated 30 September 2026.
Consolidated AUM grew 26% to ₹584,624 crore, PAT rose 29% to ₹6,367 crore and PBT rose 29% to ₹8,537 crore. The customer franchise reached 128.85 MM, with 4.42 MM new customers and 13.45 MM new loans in the quarter. ROE was 20.6% and Net NPA 0.42%.
Pages 9 to 13 report Bajaj Finance's AI transformation. They cover metrics such as 328 AI unit employees, 56 MM voice-to-data interactions, 6.7 MM face matches and ₹2,744 crore of disbursal from AI-bot leads. They also include a roadmap of data intelligence, consumer AI and agentic AI initiatives with timelines and status.
The deck reports consolidated Bajaj Finance results, Bajaj Finance standalone, Bajaj Housing Finance Ltd (BHFL, 86.70% held) and Bajaj Financial Securities Ltd (BFSL, 100% held). Bajaj Finserv Ltd is the parent with 51.30% of Bajaj Finance.
The deck uses a pure black background, white text, bold geometric headings, monochrome grey tables and charts, and dashed column separators, with colour only on section icons and a few chart lines. You can download the slides as PPTX and PDF and reuse the structure, such as section dividers, KPI circles, dense data tables and stacked bar charts, for your own financial presentations.
Amounts are in ₹ crore (Cr), where one crore is 10 million, and the deck's own digit grouping is kept in this summary, for example ₹584,624 crore. MM means million and lakh means 100,000. Page 68 is a glossary covering terms such as AUF, CIF, ECL, GNPA, NNPA, PCR, LCR and MTF.

Create Your Own Slides
Turn your ideas into professional presentations in seconds with 2slides AI.
參考專業設計,選擇您的風格,產生具有完美文字渲染的投影片。由 Nano Banana 提供支援—立即開始建立您的簡報。


