
所屬合集: 投資人簡報案例
Asia Vital Components Q3 2026 Earnings Presentation is a 20-slide English investor deck titled "AVC Company Financials" and dated 2026/11/10, from Asia Vital Components (AVC, 奇鋐科技), a Taiwanese thermal-solutions maker. It was filed on Taiwan's Market Observation Post System (MOPS) for a broker-hosted investor conference (法說會) on the company's third quarter 2026 results, and covers the income statement, revenue by product and application, non-operating items, balance sheet, financial ratios and cash flows. Amounts are in NT$ (New Taiwan dollars) unless a slide states another unit.
以這份簡報的封面作為風格參考,用您自己的內容產生幻燈片。 也可以在下方任選一頁,以它的版面作為參考。
快速導航
標籤
分享幻燈片
Asia Vital Components Q3 2026 Earnings Presentation is a 20-slide English investor deck titled "AVC Company Financials" and dated 2026/11/10, from Asia Vital Components (AVC, 奇鋐科技), a Taiwanese thermal-solutions maker. It was filed on Taiwan's Market Observation Post System (MOPS) for a broker-hosted investor conference (法說會) on the company's third quarter 2026 results, and covers the income statement, revenue by product and application, non-operating items, balance sheet, financial ratios and cash flows. Amounts are in NT$ (New Taiwan dollars) unless a slide states another unit.
每張幻燈片頁面的詳細視圖,包括版面、關鍵內容和視覺元素。
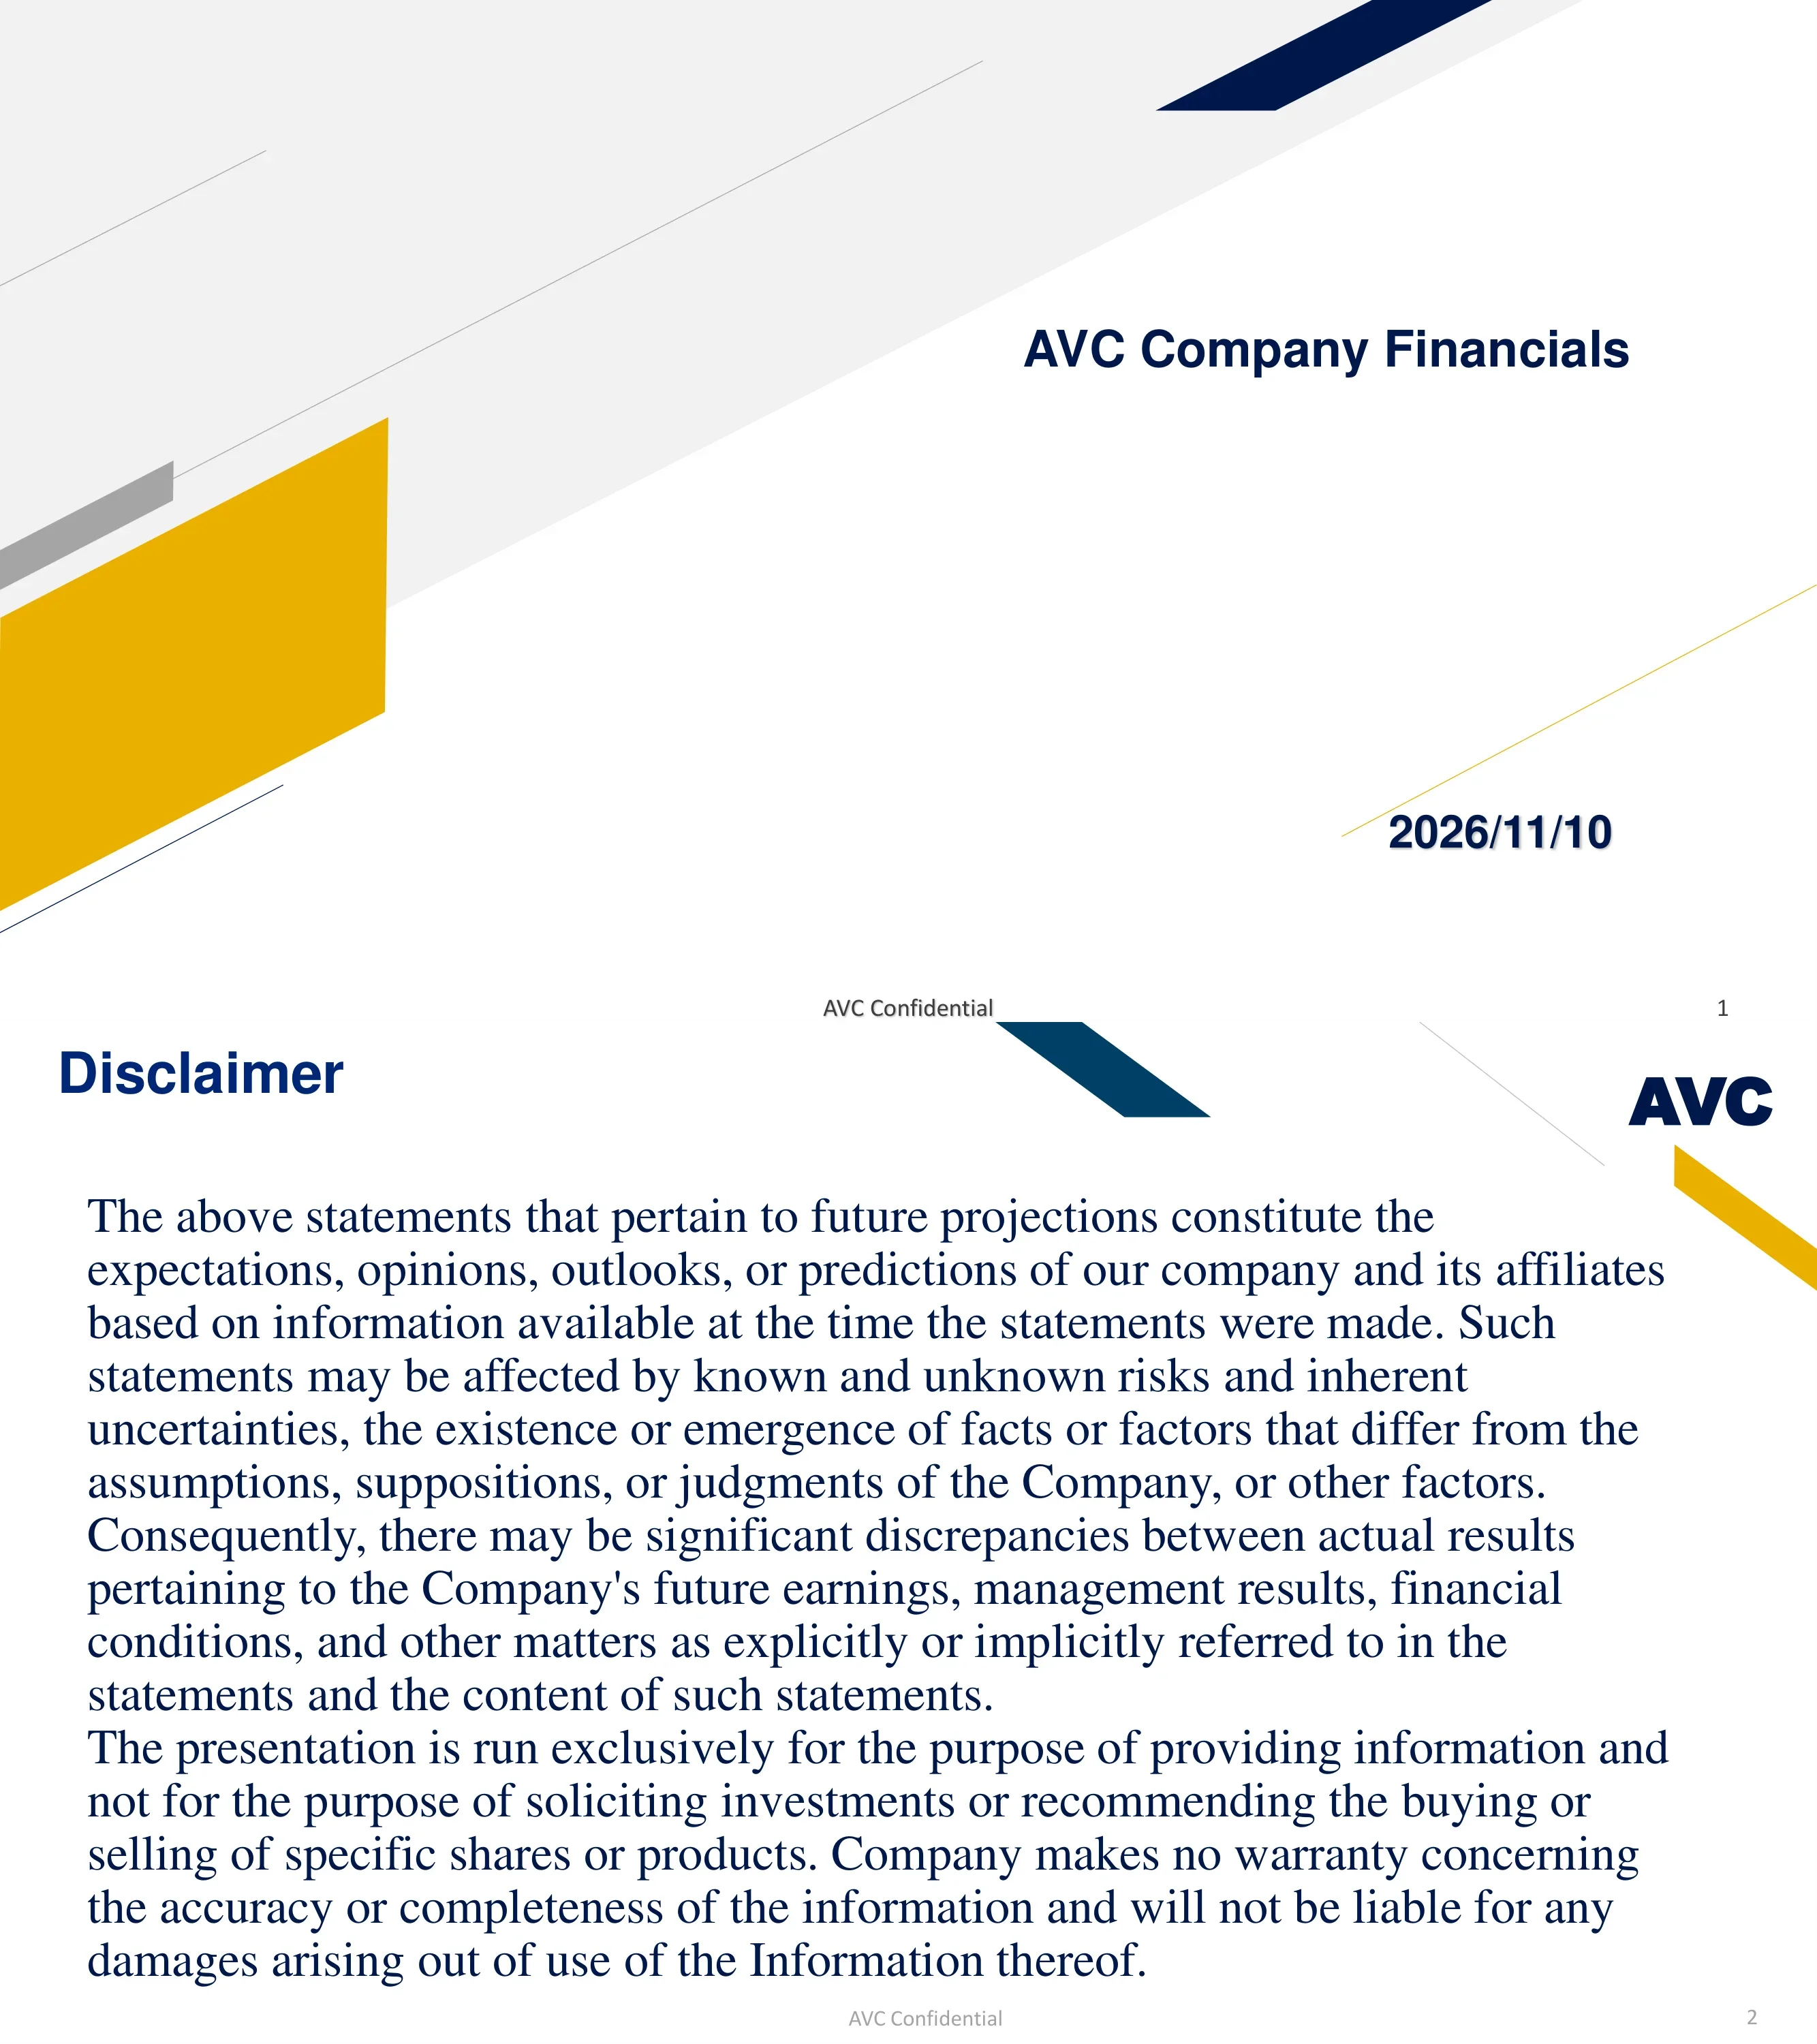
Cover slide titled "AVC Company Financials" with the date 2026/11/10. The footer reads "AVC Confidential".
Title and date are right-aligned on a white field, balanced by a large gold parallelogram and diagonal grey and navy bands on the left and top.
A forward-looking-statements disclaimer. It says projections reflect the company's expectations based on information available when made, are subject to known and unknown risks and uncertainties, and may differ materially from actual results. It adds that the presentation is for information only, is not a solicitation or a recommendation to buy or sell shares or products, and carries no warranty of accuracy or completeness.
A single block of large serif text fills the slide beneath a navy title, with the AVC logo at top right.
Q3 2026 sales revenue was 59,089 against 49,121 in Q2 2026 (+20.29% QoQ) and 38,937 in Q3 2025 (+51.76% YoY). Gross margin was 20,010 (33.86%), operating income 16,856 (28.53%), pretax income 16,752, and net income attributable to the parent 11,564 (19.57%). EPS was NT$29.32, up 20.31% QoQ and 114.48% YoY. Figures are in NTD millions and reviewed by a CPA.
One wide table with Q3 2026, Q2 2026, QoQ, Q3 2025 and YoY column groups; percentage-margin rows are shaded light blue. A footnote sits beneath the table.
For Q1~Q3'2026, sales revenue was 157,248 versus 91,864 in Q1~Q3'2025 (+71.17%). Gross margin was 50,606 (32.18%, versus 25.50%), operating income 42,352 (26.93%), pretax income 42,666, and net income attributable to the parent 29,047 (18.47%). EPS was NT$73.86 versus NT$32.25, up 129.02%. Figures are in NTD millions.
The same table format as the previous slide but with only the nine-month period, the prior-year nine-month period and a YoY column group.
Annual revenue rose from 29 (billion) in 2018 to 139 in 2025, passing through 37, 40, 47, 56, 59 and 72 in between. The slide labels the trend "Revenue CAGR 25%". The y-axis is labelled Revenue (Billion).
A gold bar chart for 2018-2025 with a bold black upward arrow and a CAGR callout drawn over the bars.
Annual EPS in NT$ rose from 2 in 2018 to 49.2 in 2025, with 2.7, 5.4, 8.2, 11.8, 14.1 and 21.2 in between. The slide labels the trend "EPS CAGR 58%".
Same bar-chart-with-arrow format as the revenue slide, with an EPS (NT$) axis from 0 to 60.
Annual gross margin (%) went from 11.9 in 2018 and 11.8 in 2019 to 15.7, 17.7, 19.4, 20.9, 23.5 and 25.8 in 2025. The slide labels the trend "Gross Margin CAGR 12%".
Gold bar chart on a 0-30 percent axis with a rising arrow and a CAGR label above the bars.
A quarterly series from 1Q21 to 3Q26. Revenue (NT$ hundred million) went from 106 in 1Q21 to 389 in 3Q25, 478 in 4Q25, 490 in 1Q26, 491 in 2Q26 and 591 in 3Q26. EPS (NT$) went from 1.53 to 13.67 in 3Q25, 16.92, 20.17, 24.37 and 29.32 in 3Q26.
Navy revenue columns with a gold EPS line on a secondary axis, with a data table of all 22 quarters beneath the chart.
Annual revenue (NT$ hundred million) was 473 in 2021, 560 in 2022, 592 in 2023, 718 in 2024 and 1,396 in 2025. EPS (NT$) was 8.21, 11.78, 14.11, 21.21 and 49.17 respectively.
A combination chart of navy columns and a gold line on dual axes, with a two-row data table under the plot.
For Q1~Q3'26, Thermal was 102,291 (65.05% of 157,248 total, +82.48% YoY) and Chassis 30,179 (19.19%, +100.64%), giving a Thermal and Chassis (TMG) subtotal of 132,470 (84.24%, +86.32%). System Assembly and Peripheral Products was 12,352 (7.86%, +0.19%) and Fositek (hinge) 12,426 (7.90%, +47.26%). In Q1~Q3'25 the TMG share was 77.39%. Figures are in NTD millions.
Two pie charts (Q1~Q3'26 and Q1~Q3'25) sit above a bilingual Chinese and English table with amount, percent and YoY columns; the total row is highlighted yellow and the TMG subtotal green.
Quarterly revenue by product from Q1'25 to Q3'26 in NT$ millions. Thermal rose from 13,789 to 40,471 in Q3'26; Chassis from 3,629 to 10,117; System Assembly and Peripheral Products moved from 3,663 to 3,999 with a spike to 9,703 in Q4'25; Fositek (hinge) from 2,252 to 4,502.
A four-line chart (Thermal blue, Chassis orange, System Assembly grey, Fositek yellow) with a data table of all seven quarters beneath it.
For Q1~Q3'26, Server & Networking was 103,689 (65.94%, +122.25% YoY), Telecom 8,765 (5.57%), 3C 17,323 (11.02%), others 2,693 (1.71%), System integration 12,352 (7.86%) and Fositek (hinge) 12,426 (7.90%), totalling 157,248 (+71.17%). Server & Networking was 50.78% of Q1~Q3'25 revenue. Figures are in NTD millions.
Two pie charts for the two nine-month periods above a bilingual table with amount, share and YoY columns; the total row is highlighted yellow.
In Q3 2026, Server was 38.8 (65% of revenue, +84% YoY), Telecom 2.8 (5%, +12%), 3C 7.9 (13%, +21%) and Other 1.1 (2%, +21%), for a TMG total of 50.6 (85%, +63%). SIG was 4.0 (7%, -8%) and Fositek 4.5 (8%, +26%). The grand total was 59.1 versus 38.9 in 2025Q3 (+52%). Figures are in NTD bn.
A compact table with 2026Q3, 2025Q3 and YoY column groups; the TMG Total and Grand Total rows are shaded grey.
Quarterly revenue in NTD bn from Q1'24 to Q3'26. Server rose from 4.7 to 10.6 in Q1'25, 21.0 in Q3'25, 32.5 in Q1'26, 32.4 in Q2'26 and 38.8 in Q3'26. 3C reached 7.9 in Q3'26; Telecom was 2.8 and Other 1.1 in Q3'26.
A four-line chart (Server blue, Telecom orange, 3C green, Other purple) with every data point labelled and the legend across the top.
Q3 2026 non-operating items totalled (104) versus 457 in Q2 2026 and 132 in Q3 2025. Net interest revenue was 55, investment revenue 13, loss on disposal of fixed assets (51), exchange loss (304) against a 49 gain in Q2, and others 183. Figures are in NTD millions and reviewed by a CPA.
A table with Q3 2026, Q2 2026, QoQ, Q3 2025 and YoY columns and a bold total row at the bottom, followed by a footnote.
For Q1~Q3'2026, non-operating items totalled 314 versus 1,192 in Q1~Q3'2025. Net interest revenue was 300, investment loss (13), disposal loss (83), exchange loss (560) versus a gain of 808, impairment loss (12), and others 682. Figures are in NTD millions.
The same table pattern as the previous slide, with the nine-month period, prior-year period and YoY columns.
At 2026.9.30, cash and bank balances were 80,031, accounts receivable 14,749, inventory 75,265 and total assets 232,499 (+66.96% YoY). Short-term loans were 27,423, accounts payable 72,600, total liabilities 157,211 and total equity 75,288. Equity attributable to the parent was 67,269 and net asset value per share was NT$170.53. Figures are in NTD millions.
A dense table comparing 2026.9.30, 2026.6.30 and 2025.9.30 with QoQ and YoY columns; subtotal rows are tinted blue and key totals orange.
At 2026.9.30 the current ratio was 126.13%, quick ratio 72.24%, debt ratio 67.62%, AR turnover days 23 and inventory turnover days 160. The comparisons are 2026.6.30 (126.07%, 76.39%, 68.07%, 20 days, 145 days) and 2025.9.30 (124.93%, 67.67%, 70.13%, 25 days, 165 days).
A short five-row table with QoQ and YoY columns occupying the top of an otherwise empty slide.
For Q1~Q3'2026, operating cash flow was 36,966 (versus 23,159), capital expenditures (12,004), net investing cash flow (20,392), net financing cash flow 3,126, and depreciation and amortization 3,524. Free cash flow (A)-(B) was 24,962 versus 17,635 (+41.55%). Cash at period end was 80,031 versus 43,789. Figures are in NTD millions.
A seven-row table comparing Q1~Q3'2026 with Q1~Q3'2025 and YoY, followed by a CPA-review footnote.
Closing slide reading "Thank you" and "Q & A", with the AVC logo and the full company name, Asia Vital Components Co., Ltd.
A hexagonal black-and-white architectural photograph at left holds a white hexagon with the logo; the closing text sits to the right, framed by the cover's gold and navy diagonals.
關於此幻燈片和基礎簡報內容的常見問題。
It is an English deck titled "AVC Company Financials", dated 10 November 2026, from Asia Vital Components (AVC, 奇鋐科技), a Taiwanese thermal-solutions maker. It was filed on Taiwan's Market Observation Post System (MOPS) for a broker-hosted investor conference (法說會) on third quarter 2026 results. Some table labels on the product and application slides are bilingual Chinese and English.
Sales revenue was NT$ (New Taiwan dollars) 59,089 million, up 20.29% QoQ and 51.76% YoY. Gross margin was 33.86%, operating margin 28.53%, net income attributable to the parent 11,564 million, and EPS NT$29.32.
By product it splits revenue into Thermal, Chassis, System Assembly and Peripheral Products, and Fositek (hinge). By application it uses Server & Networking, Telecom, 3C, others, system integration and Fositek. Both views are given for Q1~Q3'26 versus Q1~Q3'25, and the application view also covers Q3 2026 and quarterly trends.
Annual revenue, EPS and gross margin are charted for 2018-2025, with CAGR callouts of 25% for revenue, 58% for EPS and 12% for gross margin. Quarterly revenue and EPS run from 1Q21 to 3Q26, and annual revenue and EPS appear for 2021-2025.
Yes. Slide 17 is a consolidated balance sheet comparing 2026.9.30 with 2026.6.30 and 2025.9.30. Slide 18 gives liquidity, leverage and turnover ratios. Slide 19 shows Q1~Q3 cash flows including capital expenditures and free cash flow.
Most tables are in NTD (New Taiwan dollars) in millions and are marked as reviewed by a CPA. Quarterly and annual revenue charts use NT$ hundred million, the CAGR revenue chart uses billions, and the Q3 application table uses NTD bn. Always check the footnote on each slide.
Its structure is a reusable pattern: cover, disclaimer, income statement for the quarter and cumulative period, long-run charts, revenue mix, non-operating items, balance sheet, ratios, cash flow, then a Q&A slide. It uses a navy and gold palette with a consistent logo and footer. The content is for information only and is not investment advice.

Create Your Own Slides
Turn your ideas into professional presentations in seconds with 2slides AI.
參考專業設計,選擇您的風格,產生具有完美文字渲染的投影片。由 Nano Banana 提供支援—立即開始建立您的簡報。


