
所屬合集: 投資人簡報案例
Ambev Q3 2026 Earnings Presentation (3Q26 & 9M26 earnings call)
以這份簡報的封面作為風格參考,用您自己的內容產生幻燈片。 也可以在下方任選一頁,以它的版面作為參考。
快速導航
標籤
分享幻燈片
Ambev Q3 2026 Earnings Presentation (3Q26 & 9M26 earnings call)
每張幻燈片頁面的詳細視圖,包括版面、關鍵內容和視覺元素。
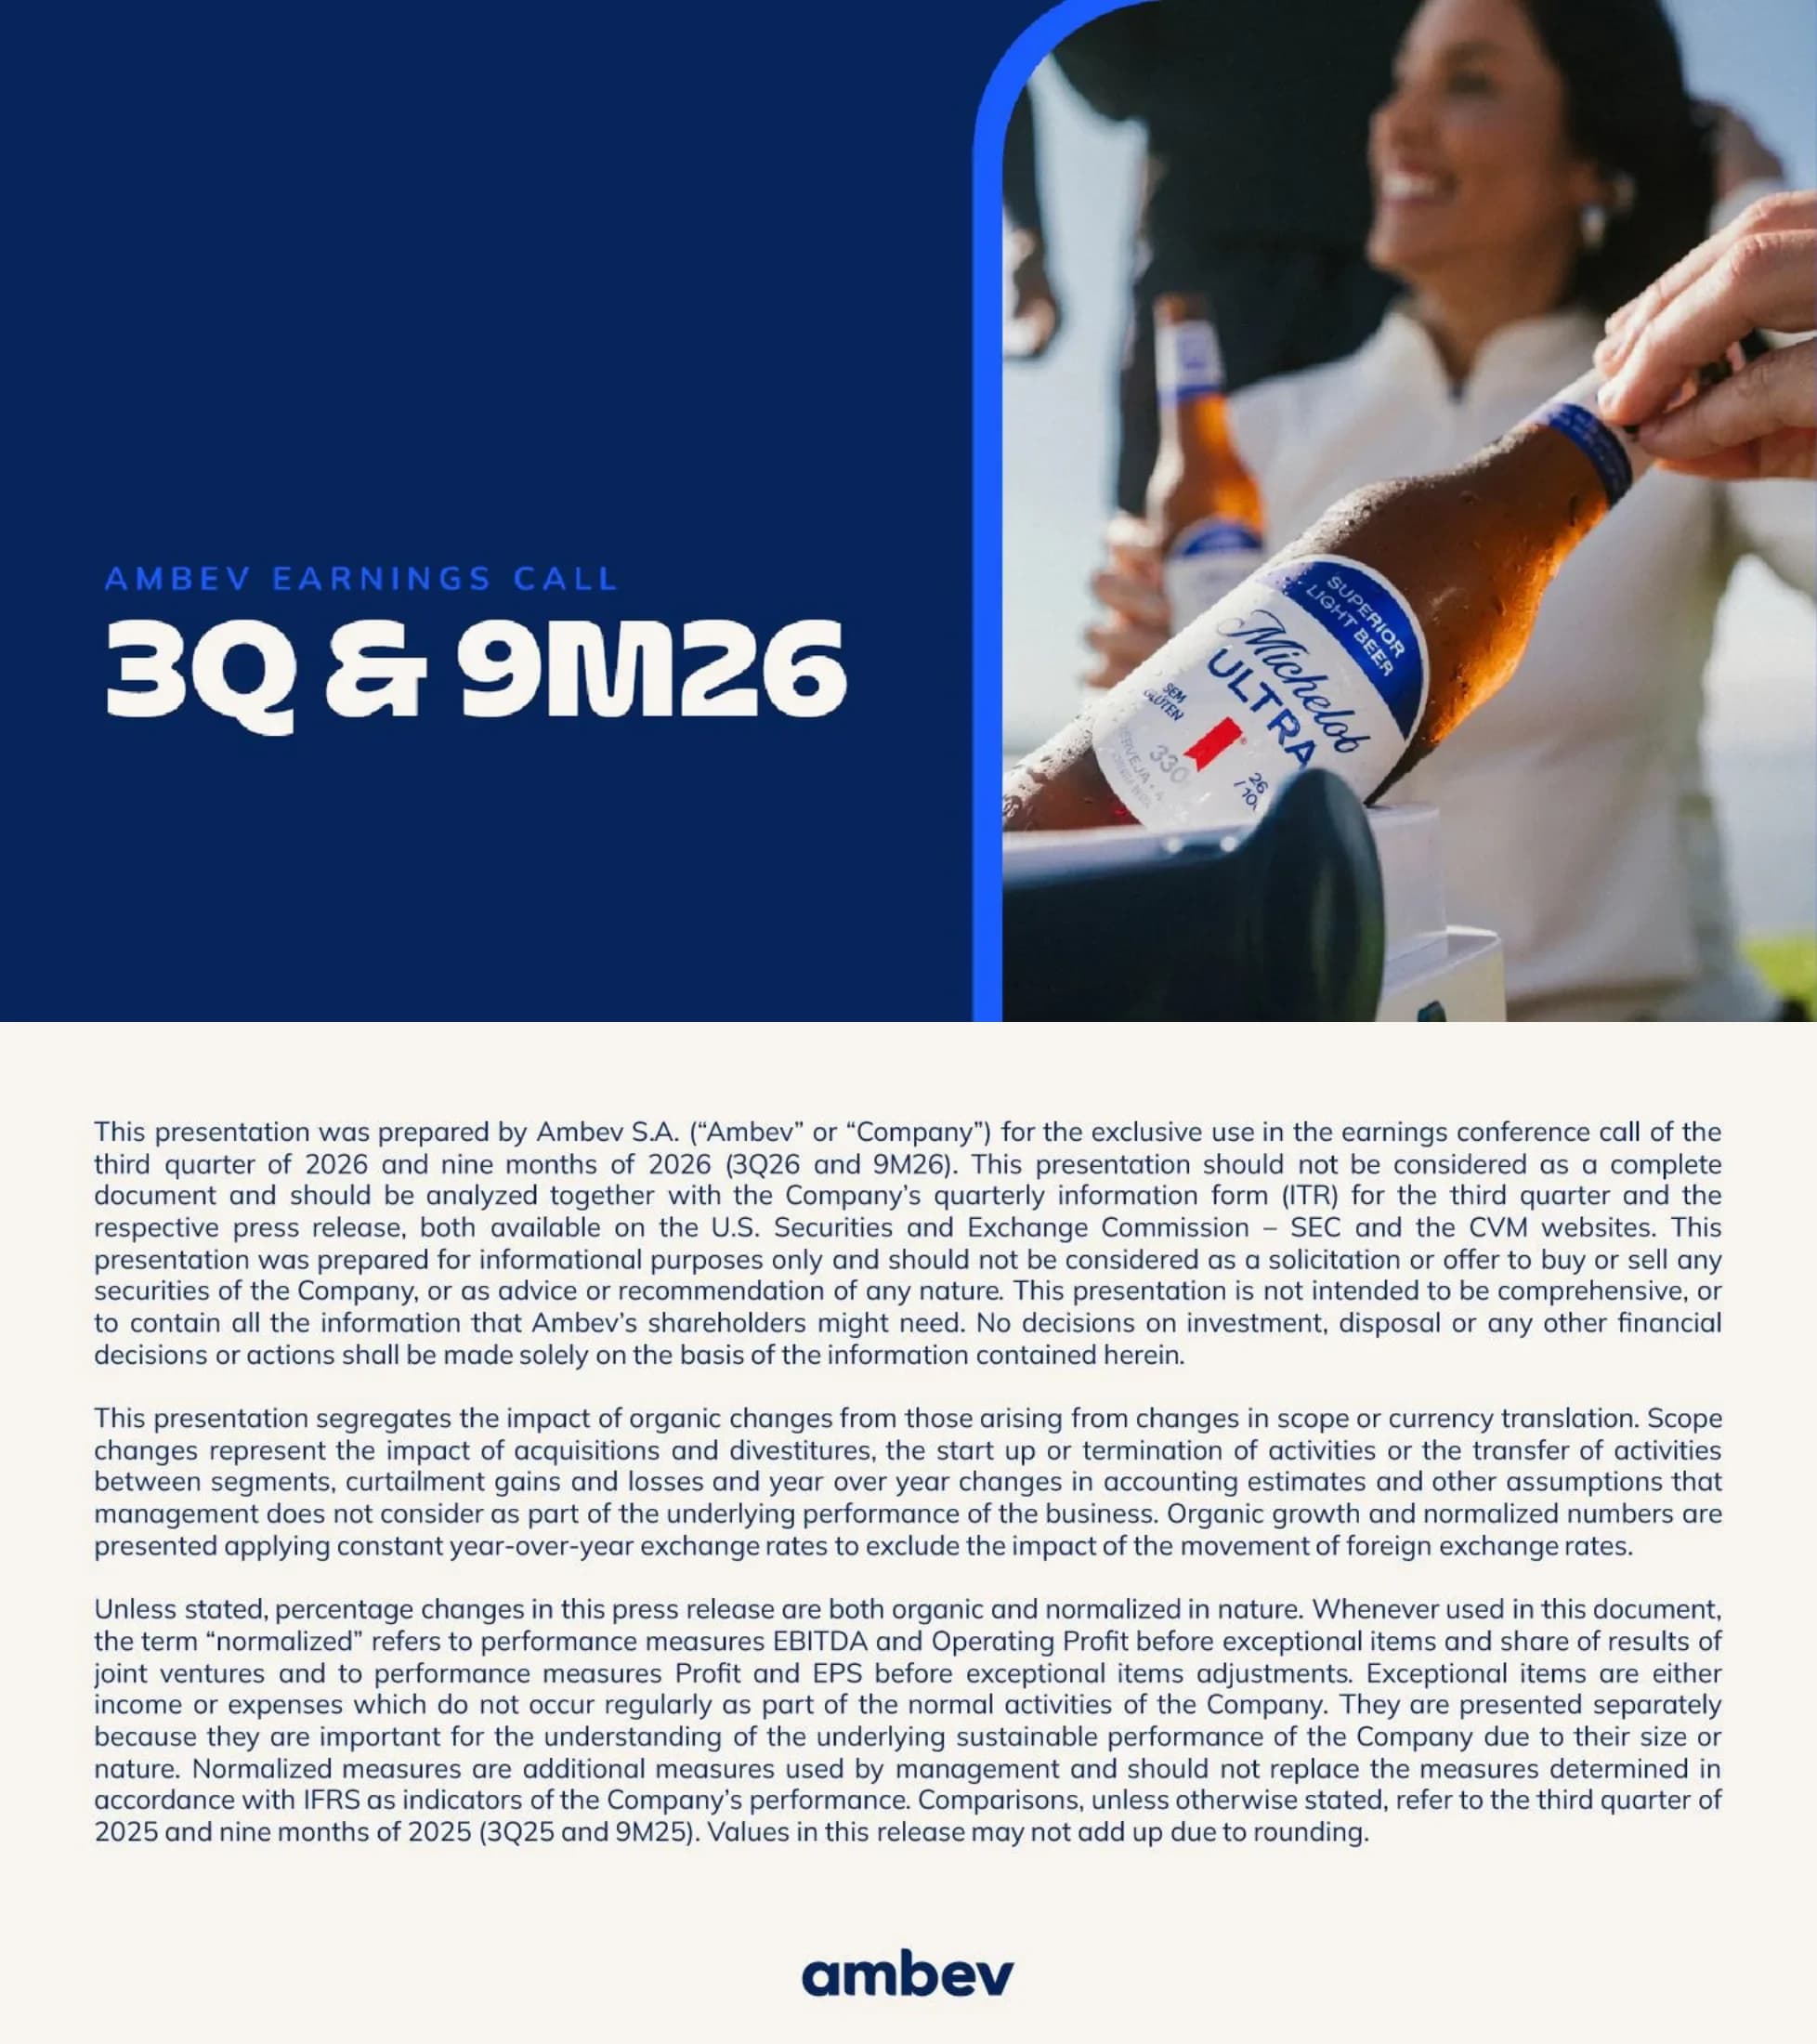
Cover slide for Ambev's earnings call covering the third quarter and first nine months of 2026 (3Q26 and 9M26).
Split layout: navy left panel with small spaced-caps label and oversized display title; right half is a full-bleed lifestyle photo inside a rounded blue frame.
Legal notice: the deck was prepared by Ambev S.A. for the 3Q26/9M26 earnings call and should be read with the quarterly information form (ITR) and press release on the SEC and CVM websites. It explains that organic growth excludes scope changes and currency translation, that 'normalized' EBITDA, operating profit, profit and EPS exclude exceptional items, and that comparisons are against 3Q25 and 9M25.
Full-width text page in three justified paragraphs on a cream background with the ambev wordmark centred at the bottom.
3Q26 vs. 3Q25: total volumes +0.8%, net revenue +7.6% (disciplined revenue management), normalized EBITDA +8.9% with +40 bps margin expansion, and normalized EPS +15.4%. Banner message: the shape of performance mirrored the first half.
Four-column KPI row with oversized blue percentages, underline rules and short captions, closed by a full-width navy pill banner.
Repeats the 3Q26 KPIs (+0.8% volumes, +7.6% net revenue, +8.9% normalized EBITDA, +15.4% normalized EPS) in a muted row, then 9M26: total volumes +0.7% (beer more than 2x the total), net revenue +7.3% (ahead of inflation), normalized EBITDA +9.3% and normalized EPS +12.3%. Banner: marketing investment up double digit in both 3Q26 and 9M26.
Two stacked four-column KPI rows (quarter greyed, year-to-date in bold blue) with a navy banner and footnotes defining double digit as 10.0-19.9%.
Strategy framework: a stronger, broader set of brands delivering healthy volume growth, net revenue ahead of inflation and disciplined conversion to the bottom line, driven by three pillars: 1) lead and grow the category, 2) digitize and monetize our ecosystem, 3) optimize our business.
Left column with two-colour headline and three chevron bullets; right side a three-segment circular flywheel diagram with numbered nodes and a dashed circular arrow.
Ambev's footprint across the Americas: mostly emerging markets where people love beer, leadership in markets with different economic cycles, and roughly half of the business outside Brazil. Share of 9M26 EBITDA: Brazil Beer 50%, Latin America South (LAS) 15%, Central America & Caribbean (CAC) 15%, Canada 10%, Brazil NAB 9%.
Numbered three-point list on the left, map of the Americas on the right with operating countries shaded navy and gold percentage labels per business unit.
Business-unit table for 9M26 (volume / net revenue / EBITDA / EBITDA margin): Brazil Beer +2.1% / +7.8% / +6.9% / -30 bps; Brazil NAB -1.7% / +3.1% / +11.0% / +200 bps; LAS -1.5% / +11.8% / +19.4% / +180 bps; CAC +5.0% / +8.3% / +9.8% / +70 bps; Canada -1.5% / +1.2% / +3.8% / +70 bps.
Rounded-row table with four metric columns on the left (Brazil rows greyed, international rows in blue) and a shaded map of the Americas on the right.
Brazil non-alcoholic beverages: 3Q26 volumes up mid-single digit, sell-out share improved sequentially back to last year's level, and 9M26 EBITDA margin up about 200 bps. Zero-sugar portfolio grew double digit and Guaraná Antarctica with Fibers reached national distribution.
Left column of three icon-led bullets under a stacked headline; right half a tinted photo of Guaraná Antarctica Zero cans with two overlaid callouts.
Section divider introducing the first strategic pillar, Lead and Grow the Category, with pillar 1 highlighted on the three-part flywheel.
Blue full-bleed divider with a giant ghosted numeral behind the white headline and the flywheel on the right with the active segment darkened.
Explains why the second and third quarters should be read together: Nielsen's calendar runs roughly Mar 20 to Jun 20 and Jun 20 to Sep 20, and the FIFA World Cup (Jun 11 to Jul 19) straddled both. Nielsen industry was slightly negative in 2Q26 and about +4% in 3Q26, for +1.3% across 2Q26 + 3Q26.
Timeline graphic comparing the calendar months March to September with the Nielsen quarters below; a red dashed box marks the World Cup window and a navy bar states the combined figure.
Brazil Beer volumes with 2Q26 and 3Q26 viewed together: 2Q26 sell-in +5.0% vs. sell-out (Nielsen) +1.8%; 3Q26 sell-in +0.5% vs. sell-out +5.4%; combined 2Q26 + 3Q26 sell-in +2.7% and sell-out +3.5%.
Two small paired bar charts on top and a larger combined bar chart in a light-blue rounded panel; right side shows a product photo of Ambev beer bottles on a blue crate.
Qualitative scorecard: share up sequentially in the quarter (Nielsen), gains versus last year in both on- and off-trade channels, and expanding leadership in premium and zero-alcohol beer.
Three icon-headed statements on the left with a pale-blue tinted collage of beer bottles on the right.
Portfolio diamond for 3Q26: brands' equity at a 5-year high (9M26). Premium (Spaten, Stella Artois, Corona, Original) grew high teens; Balanced Choices more than doubled, with no-alcohol up forties; flavored beer and RTDs (Flying Fish, Beats, Brutal Fruit) grew mid-twenties; mainstream (Skol, Brahma, Antarctica) sits at the base.
Large gold faceted-diamond graphic with bottle photography at each point and segment labels with growth arrows; footnotes define the ranges.
Section divider for the second strategic pillar, with segment 2 highlighted on the flywheel.
Blue divider with ghosted numeral 2, white and gold headline, flywheel on the right.
Ambev's BEES B2B platform in Brazil reaches more than 1 million points of sale, delivers better sell-out activation and product recommendations, and lifted SKUs per point of sale by high single digit YTD and by double digit in 3Q26 vs. 3Q25.
BEES wordmark and bee mascot top-left, three icon bullets, and a photo of a shop owner using a smartphone inside a yellow rounded frame.
More than 80% of BEES customers have bought via the marketplace, marketplace GMV grew more than 80% year on year in 3Q26 and 9M26, and third-party expansion continued, enlarging the total addressable market.
Two big-number stats side by side, a third stat below, and a photo of a store owner checking his phone in a grocery aisle on the right.
Zé Delivery, Ambev's direct-to-consumer app, serves about 27 million consumers annually; premium is about mid-thirties percent of Zé volume and Balanced Choices over-index by about 50%; Zé GMV grew mid-teens and the marketplace is about 20% of Zé GMV.
Four icon-led bullets on the left; right side a yellow-framed photo of a delivery rider with customers and the Zé mascot.
Section divider for the third strategic pillar, with segment 3 highlighted on the flywheel.
Blue divider with ghosted numeral 3 and flywheel graphic.
Three efficiency levers: revenue management (about +50% YTD return on BEES on-trade promos vs. 9M25), cost productivity (about R$450 million of non-commodity savings YTD) and organizational productivity (about +4% YTD hectoliters per full-time employee, +20% vs. five years ago). Efficiencies are channeled into marketing investment growing about 2x top-line growth.
Three rounded cards in graded blues and cream converging via a light funnel into a pill-shaped conclusion box.
The same playbook (category growth, sharper execution, disciplined resource allocation) is scaled from Brazil across the footprint to Canada, CAC and LAS.
Headline and three stacked statements on the left; map of the Americas on the right with gold arrows radiating from a three-part flywheel over Brazil.
Section divider opening the CFO's financial review.
Navy left panel with large white headline and spaced-caps subtitle; right side a photo of an Ambev sales rep with a bar owner using a tablet.
Year-to-date normalized EBITDA grew 9.3% and normalized net income grew 11.6%, ahead of EBITDA, with gross margin and normalized EBITDA margin both expanding.
Two large rounded stat cards linked by a gold curved arrow, with a cream pill banner below.
Normalized EBITDA rose 8.9% to R$7.3 billion (Brazilian reais) with 40 bps of margin expansion. Disciplined resource allocation: cash COGS per hectoliter +6.5% (excluding non-Ambev marketplace products), gross margin +60 bps, and cash SG&A +7.6% reflecting sales and marketing investment, distribution and bonus accruals.
Left side headline plus three gold pill bars; right side two overlapping rounded panels (cream and blue) with large figures.
Year to date there was a meaningful improvement in financial expenses through active management of financial FX exposures; net financial expenses were R$312 million in 3Q26, down 71% year on year.
Headline on the left over a faint dollar icon; two numbered statements on the right.
3Q26 effective tax rate was 16.8% vs. 6.7% in 3Q25; normalized net income was R$4.4 billion, up 14.3% YoY; normalized EPS rose 15.4% to R$0.28 per share. Normalized net profit grew ahead of normalized EBITDA in both 9M26 and 3Q26.
Left headline, three numbered stats on the right, and a full-width gold banner across the bottom.
9M26 cash flow: operating activities +R$15.6 billion (+39% vs. 9M25), investing activities -R$5.4 billion (R$2.4 billion above 9M25) and financing activities -R$8.7 billion (R$7.3 billion below 9M25).
Centred headline over a three-bar chart: one tall navy bar for inflows and two orange bars for outflows, each with label and comparison line.
About R$3.3 billion 208-million-share buyback completed in August 2026; R$1.9 billion final tranche of 2025 interest on capital (IOC, gross of taxes) paid on October 6, 2026; about R$8 billion returned to shareholders year to date (cash basis, gross of taxes).
Gold and white headline bottom-left over a people icon; three numbered stats with check-mark sub-lines on the right.
FY26 guidance unchanged: Brazil Beer cash COGS per hectoliter +4.5% to +7.5% (excluding non-Ambev marketplace products). Ambition: consolidated margin expansion over time through efficient resource allocation. Investment priorities: brand building, brewery upgrades and expansions, innovation pipeline and commercial assets.
Two top cards (guidance range and ambition statement) above a wide blue panel with four numbered tiles.
Closing motivational slide: finish 2026 strong and enter 2027 strong.
Full-bleed photo of friends toasting with beer glasses, headline overlaid at right and a blue banner along the bottom.
Management's three reasons for confidence: the category (beer is a loved category with development potential), the strategy (three pillars working as a flywheel) and the momentum (consistent results through 9M26).
Blue left panel with headline; right side a locker-room photo of a coach at a tactics board with three numbered banners.
New share buyback of up to 190 million shares, about R$3 billion, approved by the Board of Directors on October 28 and consistent with the capital allocation framework.
Blue left panel with gold and white figures and two icon bullets; right side a photo of people toasting at a bar.
Culture slide with the Ambev purpose line 'Dream Big for a future with more Cheers'.
Full-bleed mosaic of employee portrait photos with a navy overlay and centred white display headline.
Closing thank-you slide with the ambev logo.
Two-panel blue layout: large white headline over ghosted toasting-cups illustration on the left, ambev wordmark on a brighter blue panel on the right.
Question-and-answer slide showing the Brazil portfolio's alcohol-free and lighter options (Budweiser 0.0, Corona Cero, Stella Artois Pure Gold, Spaten Pro, Stella Artois Alcohol Free, Michelob Ultra, Skol Zero, Brahma 0.0).
Large white Q&A lettering over a sky-blue gradient with a row of bottles standing on a blue crate.
關於此幻燈片和基礎簡報內容的常見問題。
It is the 34-slide deck Ambev S.A. used for its earnings conference call on the third quarter and first nine months of 2026 (3Q26 and 9M26). Ambev filed it with the SEC as an exhibit to Form 6-K, alongside its quarterly information form and press release.
Versus 3Q25, total volumes rose 0.8%, net revenue rose 7.6%, normalized EBITDA rose 8.9% to R$7.3 billion with 40 bps of margin expansion, normalized net income was R$4.4 billion (+14.3%) and normalized EPS rose 15.4% to R$0.28 per share. Growth rates are organic and normalized.
All amounts are in Brazilian reais (R$), as in the original deck. Percentage changes are organic, meaning they use constant year-over-year exchange rates and exclude scope changes.
The 2026 FIFA World Cup (June 11 to July 19) straddled both quarters and Nielsen's calendar quarters are offset from calendar months. Combined, the industry grew about 1.3%, while Ambev's Brazil Beer sell-in grew 2.7% and sell-out 3.5% across the two quarters.
Ambev completed a roughly R$3.3 billion, 208-million-share buyback in August 2026, paid a R$1.9 billion final tranche of 2025 interest on capital on October 6, 2026, and had returned about R$8 billion year to date. The board approved a new buyback of up to 190 million shares (about R$3 billion) on October 28.
The slides were filed with the SEC as rasterised images, so the PDF contains pictures of each page rather than live text. The page-by-page summary on this page transcribes the key numbers, and the PowerPoint download is image-based as well.
Yes, as a design and structure reference: a cover, disclaimer, KPI summary, strategy flywheel with section dividers, segment table, CFO financial section, outlook and Q&A. Replace Ambev's branding, photography and data with your own; the content belongs to Ambev.
Form 6-K filing that carries this presentation as an exhibit

Create Your Own Slides
Turn your ideas into professional presentations in seconds with 2slides AI.
參考專業設計,選擇您的風格,產生具有完美文字渲染的投影片。由 Nano Banana 提供支援—立即開始建立您的簡報。


