
所屬合集: 投資人簡報案例 · 日本上市公司法說會簡報範例
AGC Inc. (TSE 5201, formerly Asahi Glass) Q3 FY2026 earnings presentation: a Japanese-language 42-page deck originally published on TDnet on November 5, 2026, covering January–September 2026 results and a lowered full-year forecast. Revenue rose to 16,626億円 (¥1.66 trillion) while operating profit slipped to 929億円; the full-year operating profit forecast was cut from 1,500億円 to 1,200億円.
以這份簡報的封面作為風格參考,用您自己的內容產生幻燈片。 也可以在下方任選一頁,以它的版面作為參考。
快速導航
標籤
分享幻燈片
AGC Inc. (TSE 5201, formerly Asahi Glass) Q3 FY2026 earnings presentation: a Japanese-language 42-page deck originally published on TDnet on November 5, 2026, covering January–September 2026 results and a lowered full-year forecast. Revenue rose to 16,626億円 (¥1.66 trillion) while operating profit slipped to 929億円; the full-year operating profit forecast was cut from 1,500億円 to 1,200億円.
每張幻燈片頁面的詳細視圖,包括版面、關鍵內容和視覺元素。
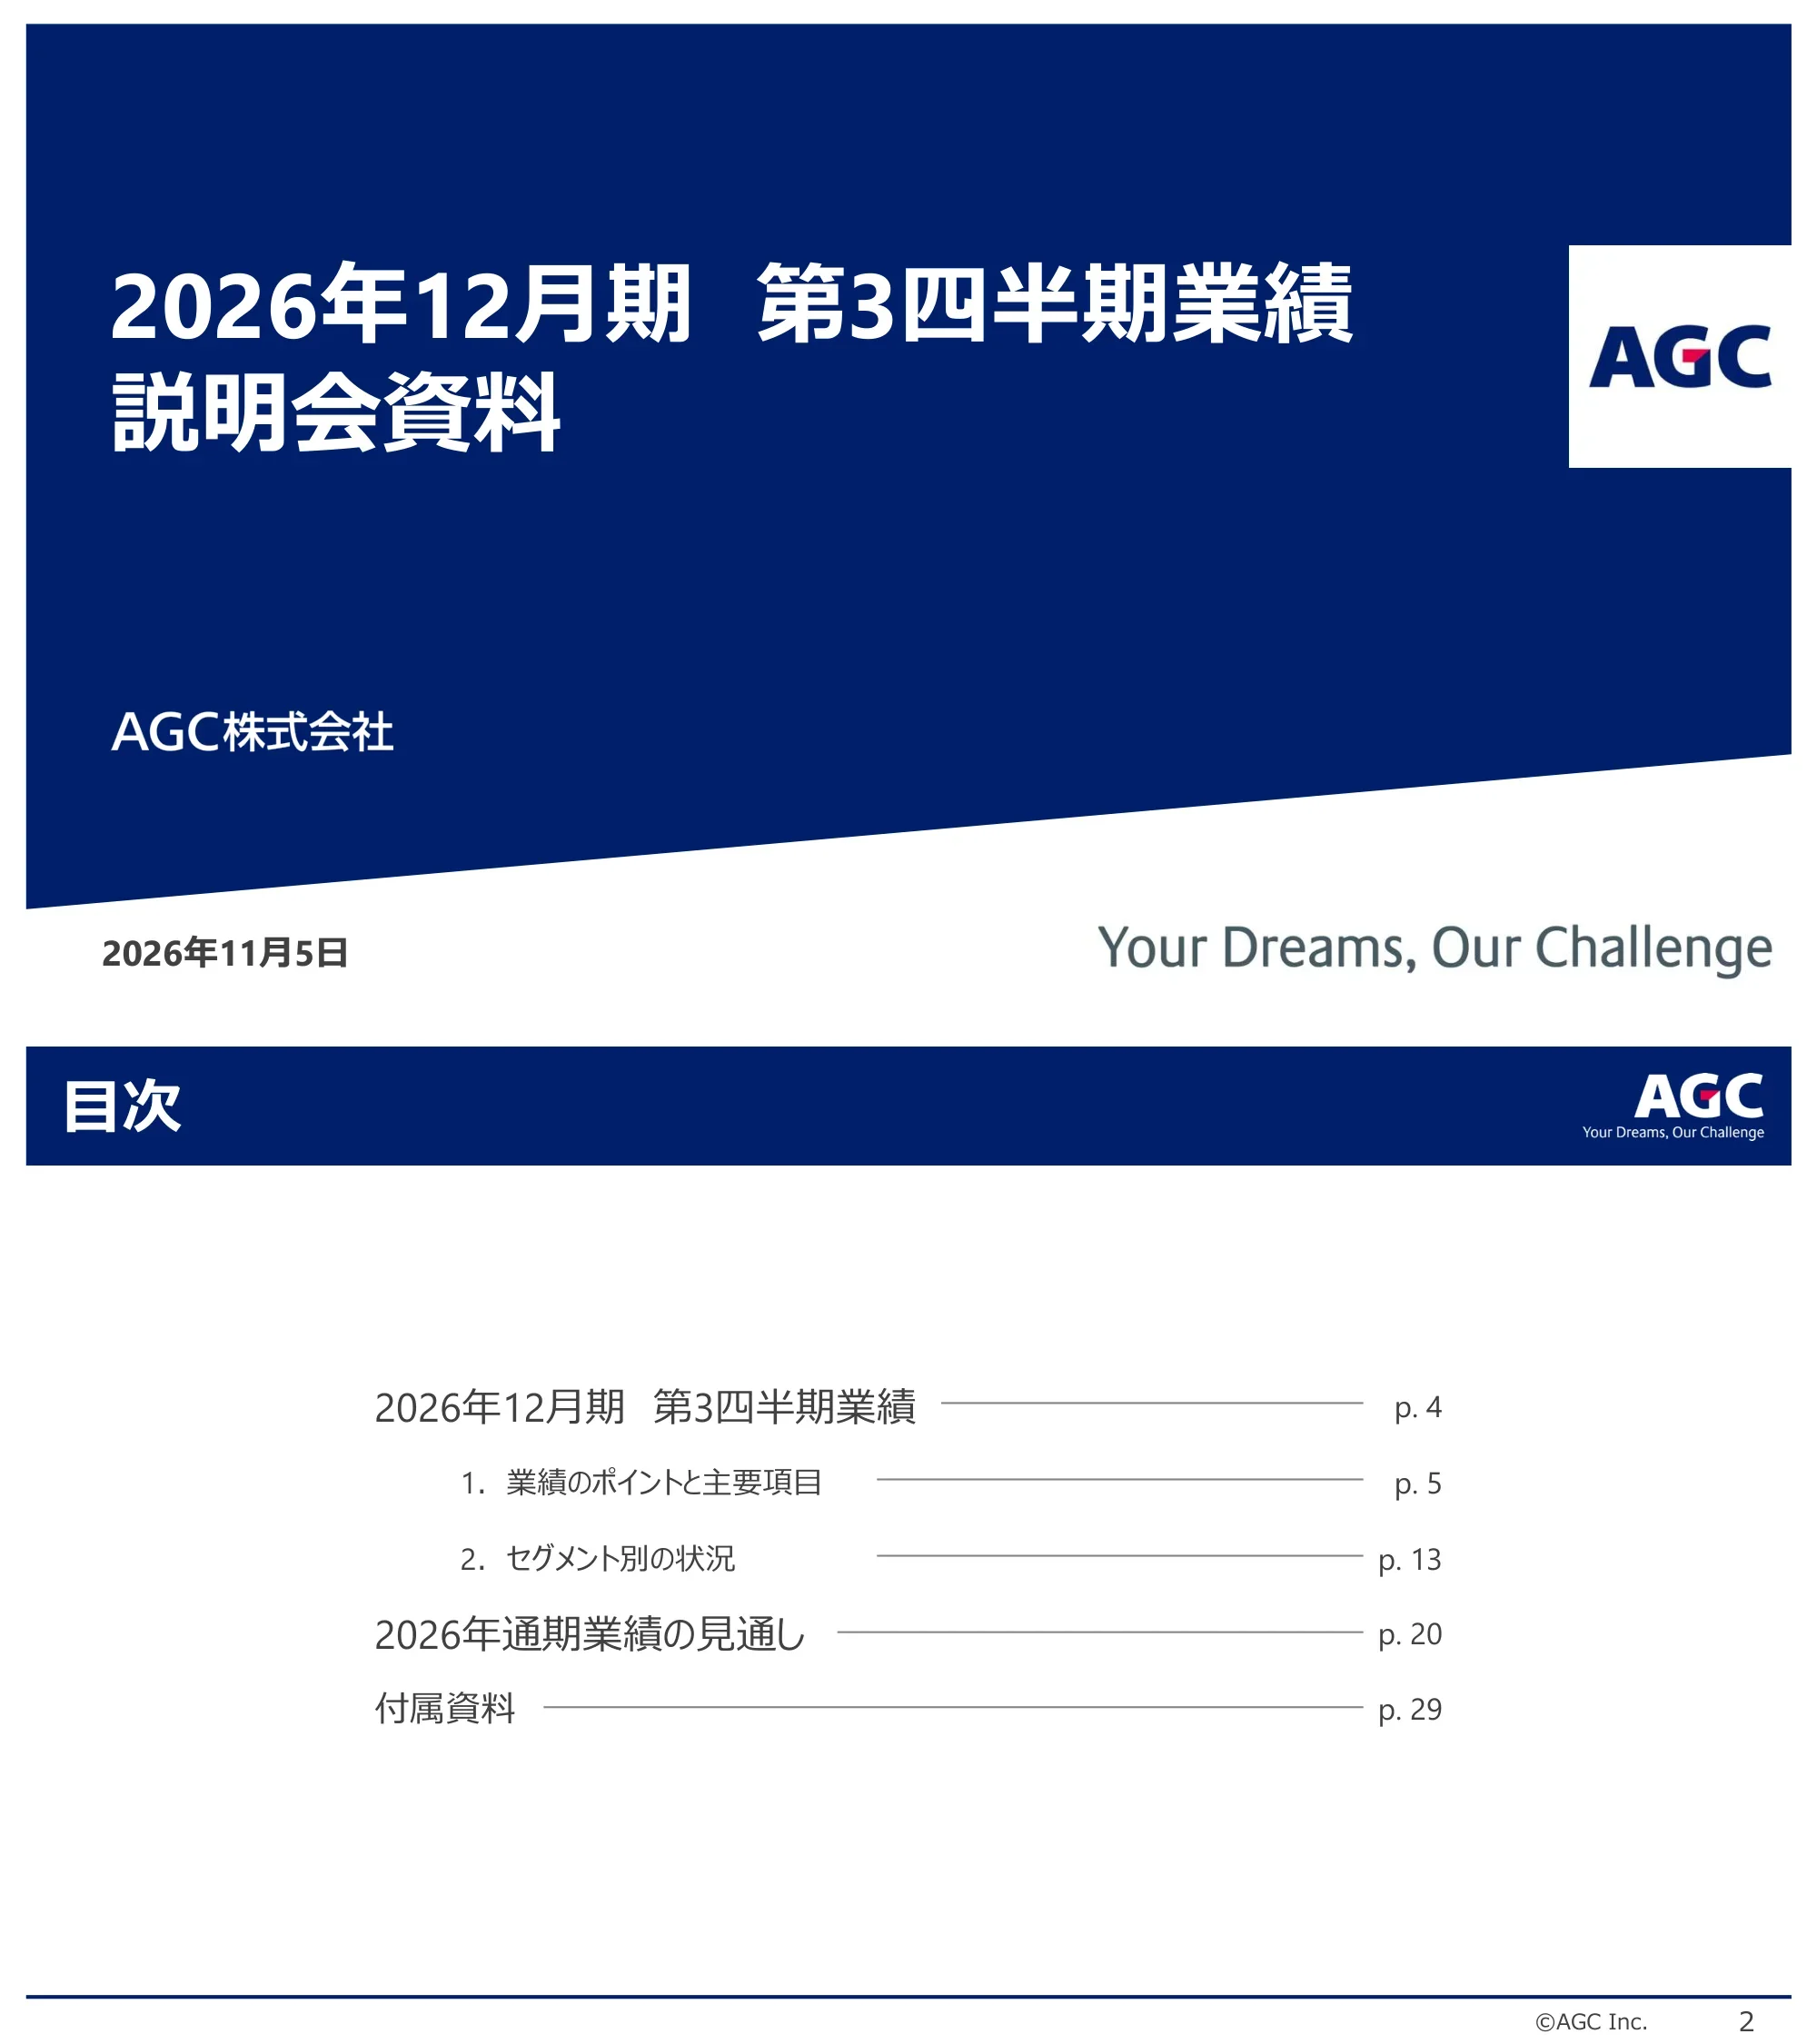
Title slide for AGC Inc.'s third-quarter FY2026 earnings briefing, dated November 5, 2026, with the company name AGC株式会社 and the tagline 'Your Dreams, Our Challenge'.
Full-bleed navy panel with an angled lower edge, large white Japanese title at left, AGC logo in a white box at right, date and tagline below the panel.
Agenda: Q3 FY2026 results (p.4) with 1. Key points and main items (p.5) and 2. Segment status (p.13); FY2026 full-year outlook (p.20); Appendix (p.29).
Navy title bar, centered list of sections with leader lines to page numbers, sub-items indented.
Jan–Sep 2026 revenue rose 1,505億円 year on year while operating profit fell 19億円: higher shipments in chemicals and electronic materials and price increases in Integrated Chemicals and European architectural glass were offset by raw-material and fuel costs and worse manufacturing costs in Essential Chemicals Southeast Asia, Automotive Europe/Americas and European architectural glass. Profitability measures produced other income and expenses. The full-year forecast is cut on higher costs in Automotive and Essential Chemicals SEA and volume shortfalls in Architectural Glass and Life Science; other expenses are expected to exceed both last year and the initial plan.
Two stacked callout panels: a blue-tabbed 'Q3 results (cumulative)' box and a teal-tabbed 'Full-year outlook' box, each with square bullets.
Section cover introducing the third-quarter (January–September 2026) results.
Full-bleed navy angled panel with large white Japanese heading and AGC logo top right.
Sub-section title page for the headline results and main financial items.
White page with large dark-gray numbered heading over a navy-and-red rule.
Jan–Sep 2026 vs 2025: revenue 16,626億円 (+1,505, of which FX +911 and scope change –26), operating profit 929億円 (–19), business profit 762 (–11), profit before tax 704 (–28), net profit attributable to owners 334 (–61). Average rates USD/JPY 158.5 (148.2) and EUR/JPY 184.1 (165.5); Dubai crude US$91.82/bbl (71.31). Drivers: weaker yen, chemical and electronic-material volumes and pricing lifted revenue; raw-material and manufacturing costs cut profit; gains on sale of affiliate shares and the absence of last year's bio CDMO impairment were offset by restructuring costs and a loss on sale of fixed assets.
Left: three-column results table (FY2025 1-3Q, FY2026 1-3Q, change) with blue row labels; right: grey 'main drivers' boxes linked to rows by connector lines.
Jan–Sep revenue / operating profit by segment (億円): Architectural Glass 3,372 / 94 (+164 / –6); Automotive 4,176 / 154 (+320 / –80); Electronics 2,708 / 339 (+111 / –21); Chemicals 5,157 / 437 (+844 / +41); Life Science 1,002 / –126 (+41 / +36); Ceramics & Other 389 / 30; eliminations –178 / 0; total 16,626 / 929.
Wide table with color-coded segment rows and icons at left, grouped column headers for FY2025 (a), FY2026 (b) and change (b)-(a).
Year to date, operating profit fell 19億円 from 948 to 929: volume/price/mix +323, raw material and fuel prices –177, cost and other –166. Quarter on quarter, Q3 rose 20億円 from 262 to 282: volume/price –18, raw materials –48, cost and other +87 as one-off Q2 costs dropped out.
Two side-by-side waterfall charts separated by a dotted divider, each with a headline figure and a grey driver box beneath.
Profitability measures booked mainly in Q3: Architectural Glass European workforce restructuring –52億円 (mainly Q1); Automotive sale of the European aftermarket auto-glass installation business +105 (gain on sale of affiliate shares); Chemicals decision to end production at the Integrated Chemicals UK site –101 (restructuring cost); Life Science sale of the bio-pharma CDMO Colorado site, excluding some land, –104 (loss on sale of fixed assets).
Four-row table by segment with columns for measure, purpose/background and financial impact plus booking note.
Total assets 29,431億円 at 30 Sep 2026 vs 29,501 at end-2025 (–70; FX –240). Inventories +300 to 4,954; PP&E, intangibles and goodwill –508 to 17,097; interest-bearing debt +276 to 6,741; equity attributable to owners 14,785; non-controlling interests 2,231; total equity 17,017 (–301; FX –38). D/E ratio 0.40 (0.37).
Balance-sheet table with two date columns and change column; subtotal rows tinted blue; grey FX-impact callouts at right.
Jan–Sep 2026: operating cash flow 1,501億円 (1,647), with depreciation 1,474 and working capital –571; investing –1,208; free cash flow 293 (384); debt increase 395; dividends paid –446; other –273 including 275 of dividends to non-controlling shareholders; financing –325; cash change –19.
Two-column cash-flow table with highlighted CF subtotal rows and a grey callout box at right.
Jan–Sep capex 1,398億円 (1,741), down mainly in Chemicals (344 vs 619); depreciation 1,474 (1,326); R&D 430 (441). Main 2026 projects: electronic-materials capacity, bio CDMO capacity, fluorine products capacity, and an architectural glass furnace repair.
Three tables side by side (capex and depreciation by segment, R&D total) with a grey project-list box underneath.
Sub-section title page for the segment-by-segment review.
White page with large numbered heading over a navy-and-red rule.
Revenue 3,372億円 (+164, FX +264); Asia 1,081 (–16), Europe/Americas 2,279 (+187). Operating profit 94 (–6): volume/price/mix +12, raw materials –25, cost/other +8. Southeast Asia shipments rose but Japan fell; Europe passed on input costs but shipped less; a Q3 equipment repair in Japan also weighed. Profit mix shifted from Asia 30% / Europe-Americas 70% to 100% Europe-Americas before common costs.
Left: KPI table and revenue/profit commentary; right: waterfall chart and stacked profit-mix bars.
Revenue 4,176億円 (+320, FX +249) on higher European volumes and better product mix in Europe and Japan. Operating profit 154 (–80): volume/price/mix +47, raw materials –24, cost/other –102, as productivity worsened in Europe (higher high-function product mix) and North America (operational issues).
Left KPI table and bullets; right waterfall chart with a linked grey note box on regional productivity issues.
Revenue 2,708億円 (+111, FX +49): Display 1,345 (–16) as LCD glass substrate prices rose but chemically strengthened specialty glass (being exited) shipped less; Electronic Materials 1,345 (+123) on EUV photomask blanks, semiconductor materials and optoelectronics. Operating profit 339 (–21): volume/price/mix +120, raw materials –3, cost/other –138. Profit mix moved to 80% Electronic Materials / 20% Display.
Left KPI table and commentary in orange accents; right waterfall chart and stacked profit-mix bars.
Revenue 5,157億円 (+844, FX +267, scope –21): Integrated Chemicals 2,564 (+356) on higher prices and semiconductor-related shipments; Essential Chemicals Southeast Asia 2,581 (+507) on Thai capacity expansion. Operating profit 437 (+41): volume/price/mix +170, raw materials –124, cost/other –6, with Essential Chemicals SEA hurt by input costs and weaker markets. Profit mix shifted to 90% Integrated Chemicals.
Left KPI table and commentary in teal; right waterfall and stacked profit-mix bars.
Revenue 1,002億円 (+41, FX +76); versus Q2, bio-pharma CDMO contract work dipped on seasonality. Operating loss narrowed to –126 from –162: volume/price/mix –27, raw materials –7, cost/other +70 from fixed-cost cuts including the Colorado site closure, though Q3 alone fell versus Q2.
Left KPI table and bullets in green; right waterfall chart below a zero line showing losses.
All strategic businesses grew revenue and profit year on year, led by Performance Chemicals and Electronics. Jan–Sep strategic revenue 4,028億円 vs 3,633 and operating profit 576 vs 407 (+169); FY2025 full year 5,015 revenue and 587 profit. Business lines: Mobility (in-vehicle display cover glass, CASE products), Electronics (semiconductor, optoelectronics, next-gen communications materials), Performance Chemicals, Life Science (synthetic and bio CDMO).
Stacked column chart of strategic revenue by business for 1Q, 2Q YTD, 3Q YTD and FY2025 with an overlaid profit line; legend panel of products at right.
Section cover introducing the revised full-year forecast for the year ending December 2026.
Full-bleed navy angled panel with large white heading.
Forecast revised on Nov 5 versus the Feb 6 plan: revenue unchanged at 22,000億円 (FY2025 20,588); operating profit 1,200 (from 1,500); business profit 900 (1,300); profit before tax 820 (1,240); net profit attributable to owners 400 (770; FY2025 692). Dividend held at ¥210 per share; operating margin 5.5%; ROE 2.7%. Assumptions: USD/JPY 160, EUR/JPY 180, Dubai crude US$100/bbl (raised from 70 on May 12). Cut driven by Automotive, Essential Chemicals SEA, Architectural Glass and Life Science.
Headline bullet above a three-column comparison table (FY2025, FY2026e Nov 5, FY2026e Feb 6) with the new forecast highlighted.
FY2026e (Nov 5) revenue / operating profit (億円): Architectural Glass 4,600 / 110; Automotive 5,300 / 170; Electronics 3,600 / 460; Chemicals 7,000 / 550; Life Science 1,400 / –130; Ceramics & Other 600 / 40; total 22,000 / 1,200. Versus the February plan, Automotive profit is –150, Architectural Glass –90, Life Science –80, Chemicals –10, Electronics +10.
Wide grid with segment rows and five grouped column blocks: FY2025, new forecast, change vs FY2025, February forecast, change vs February.
Company operating profit forecast falls from 1,500 to 1,200億円. Drivers: Automotive –150 (North America/Europe manufacturing costs), Architectural Glass –90 (weak demand in Europe and Asia, European energy prices, unplanned repairs in Japan), Life Science –80 (delayed new-contract start-up, delayed Colorado sale), Chemicals –10 (SEA raw materials offset by Integrated Chemicals). Countermeasures include HQ-led manufacturing control in Automotive, capacity and staffing right-sizing in European glass, pricing and efficiency in Essential Chemicals SEA, and order growth in Life Science.
Left: two stacked columns (Feb vs Nov) by segment with total-profit line; middle: driver boxes with impact figures; right: countermeasure boxes per segment.
Q4 FY2026 outlook versus Q3. Architectural Glass: Asia shipments up seasonally with pricing and productivity efforts; South America strong, Europe recovery limited. Automotive: seasonal shipment decline, continued mix improvement, urgent fix of European and US plant productivity. Electronics: slightly lower LCD substrate shipments; EUV photomask blanks and semiconductor materials up, optoelectronics entering adjustment.
Grey banner above three white cards (Architectural Glass, Automotive, Electronics) with circular icons and colored headers.
Chemicals: Integrated Chemicals shipments fall after fluororesin shipments concentrated in Q3; Essential Chemicals SEA sees caustic soda up and PVC down, with profit improving but still low. Life Science: synthetic pharma/agrochemical CDMO sales rise seasonally and bio-pharma CDMO sales grow on higher Copenhagen utilization.
Same banner layout with two cards (Chemicals, Life Science); right third of the slide left blank.
Strategic-business operating profit forecast raised to 850億円 (Feb plan 800; FY2025 587, FY2024 673, FY2023 568) as Performance Chemicals and Electronics beat plan; revenue forecast 5,500 (Feb 5,600). Drivers: Mobility high-function products, Electronics EUV photomask blanks, Performance Chemicals semiconductor-related demand, Life Science more bio CDMO contracts.
Stacked column chart FY2023–FY2026e with profit line and a shaded prior-forecast column; right panel explains revenue change by business.
FY2026e capex 2,050億円 (FY2025 2,513) as large capacity expansions finished in 2025, though construction costs and the weak yen lift capex and depreciation above the initial plan; depreciation 1,950 (1,798); R&D 620 (603). Projects include glass and display furnace repairs, a new automotive glass processing line, semiconductor equipment, fluorine products and bio CDMO capacity.
Two bullets above three tables by segment, with a project list box at the bottom.
Policy of stable dividends targeting DOE (dividend on equity) of about 3%; 2026 dividend kept at ¥210 per share (interim 105, year-end 105), with a policy review possible from 2027 as earnings recover. FY2026e payout ratio 58%, DOE 3.0%; buyback undecided (500億円 in FY2023).
Three bullets above a stacked dividend bar chart FY2021–FY2026e and a table of buybacks, payout ratios and DOE, with policy arrows at the bottom.
Cover page for the appendix of supplementary data.
Full-bleed navy angled panel with large white heading.
Operating profit impact: a 1% weaker yen adds about 5億円; each US$1/bbl rise in crude cuts about 2.6億円 (excluding hedges); a US$1 rise in caustic soda prices adds US$1.3M and a US$1 rise in the PVC spread adds US$1.7M.
Three rounded cards with large blue circular icons (FX, crude oil, chemical markets) and large sensitivity figures.
Q3 operating profit fell 126億円 year on year, from 408 to 282: volume/price/mix +58, raw material and fuel prices –133, cost and other –51.
Single large waterfall chart under a headline figure.
Jan–Sep revenue 16,626億円: Japan/Asia 10,457 (+945), Americas 1,972 (+142), Europe 4,197 (+418). Operating profit 929: Japan/Asia 1,272 (+14), Americas –10 (+13), Europe 36 (–36), regional common costs –369. FX added 911 to revenue and scope changes –26.
Regional results table with revenue and operating profit blocks and a grey FX callout at right.
Q3 (Jul–Sep) revenue by segment across Japan/Asia, Americas and Europe: total 5,620億円 vs 5,167, with Chemicals 1,837 (1,455), Automotive 1,373 (1,299), Architectural Glass 1,079 (1,100), Electronics 965 (915), Life Science 279 (326).
Color-banded table with segment icons at left and paired rows for each year.
Jan–Sep revenue matrix by segment and region; e.g. Chemicals Japan/Asia 4,578 (3,798), Architectural Glass Europe 2,047 (1,870), Automotive Americas 922 (863), Life Science Europe 665 (597); total 16,626 vs 15,121.
Same color-banded matrix layout as the Q3 version.
Seven quarters (1Q FY2025–3Q FY2026) for Architectural Glass (Q3 FY2026 revenue 1,079, profit 7), Automotive (1,373, 21) and Electronics (965, 152), with sub-business splits; Electronics 1Q FY2026 figures restated under a new aggregation method.
Three stacked quarterly tables with colored segment header bars.
Quarterly series for Chemicals (Q3 FY2026 revenue 1,837, profit 156), Life Science (279, –66) and the company total (revenue 5,620, operating profit 282).
Three quarterly tables with teal, green and blue headers.
Jan–Sep results as a share of the Nov 5 full-year forecast: revenue 74% and operating profit 77% overall; Automotive profit 91%, Architectural Glass 86%, Chemicals 80%, Electronics 74%. Note: this table shows forecast revenue of 22,500 (Automotive 5,500, Chemicals 7,100, eliminations –300), which differs from the 22,000 shown on pages 21–22.
Segment table with three column groups: 1-3Q actual, FY2026e forecast and progress rate.
Year-on-year volume and price trends by quarter for 2025–2026: AGC architectural glass in Japan/Asia and Europe, auto production in Japan, North America and Europe (S&P Global data), and global display panel demand by area (Omdia). In Q3 2026, European glass volume fell about 10% and price fell mid-single digits; North American auto output fell 4%; panel demand fell 2%.
Matrix table with quarterly columns grouped by year and colored side labels for glass and electronics.
FY2024 vs FY2025 operating profit, EBITDA, ROCE and operating assets by segment; company total EBITDA 3,073億円, ROCE 5.6% (5.8%), operating assets 22,800. Automotive ROCE improved to 8.5% from 4.2%; Life Science remained negative at –9.3%.
Segment table with four grouped metric blocks for two fiscal years.
Five-year IFRS indicators in millions of yen: revenue 2,058,832 in 2025; operating profit 127,465; margin 6.2%; net profit 69,162; ROE 4.7%; equity ratio 50%; D/E 0.37; EPS ¥326.20; dividend ¥210 every year; average USD/JPY 149.71. Links to AGC's full financial data file.
Long indicator table with blue label and unit columns and five yearly columns.
Background on three measures: sale of the European aftermarket auto-glass installation business (about 50 sites in Poland and the Czech Republic, 300+ staff); sale of the bio-pharma CDMO Colorado sites (Boulder from AstraZeneca 2020, Longmont from Novartis 2021, sale decided June 2025, excluding some Longmont land); end of PTFE/ETFE production at the UK Lancashire site (acquired from ICI in 1999, about 200 staff).
Three bordered columns by segment, each with site overview, history and a small diagram (supply chain, global service map, fluororesin site list).
Cautionary statement that the material is for information only, forecasts involve risks and uncertainties, AGC accepts no liability for investment decisions, and copyright belongs to AGC Inc.
Navy angled panel with white disclaimer text at left and large AGC logo with tagline at bottom right.
關於此幻燈片和基礎簡報內容的常見問題。
It covers AGC Inc.'s consolidated results for January–September 2026, segment results for Architectural Glass, Automotive, Electronics, Chemicals and Life Science, a revised full-year 2026 forecast, shareholder returns and an appendix of supplementary data, across 42 slides.
AGC's fiscal year follows the calendar year, so FY2026 runs from January to December 2026. The third-quarter cumulative figures cover January–September 2026, and the 'Q3' quarter alone is July–September 2026.
Yes. This is AGC's Japanese-language 説明会資料 (results briefing material), originally released on November 5, 2026 through TDnet, the Tokyo Stock Exchange's timely disclosure system, and on AGC's investor relations site. The descriptions on this page are English summaries; the slides themselves are in Japanese.
Revenue was 16,626億円 (+1,505億円 year on year, including +911億円 from currency effects), operating profit 929億円 (–19), profit before tax 704億円 and net profit attributable to owners 334億円. 億円 means ¥100 million, so revenue is about ¥1.66 trillion.
Yes. On November 5 AGC kept revenue at 22,000億円 but cut operating profit from 1,500 to 1,200億円 and net profit from 770 to 400億円, citing higher costs in Automotive and Essential Chemicals Southeast Asia and weaker volumes in Architectural Glass and Life Science. The dividend stays at ¥210 per share.
Yes. AGC Inc. was formerly Asahi Glass Co., Ltd. and changed its name to AGC in 2018. It is listed on the Tokyo Stock Exchange under code 5201.
Yes. The deck is available as a PDF and as an editable PPTX converted from the original PDF, so you can reuse the table, waterfall and segment-review layouts. Japanese fonts may be substituted depending on your system.
Official IR site with results briefings, financial statements and presentation materials.
Financial indicator data file referenced on slide 40 of the deck.
Official channel where Japanese listed companies publish earnings releases and briefing materials.

Create Your Own Slides
Turn your ideas into professional presentations in seconds with 2slides AI.
參考專業設計,選擇您的風格,產生具有完美文字渲染的投影片。由 Nano Banana 提供支援—立即開始建立您的簡報。


