
収録コレクション: 投資家向けプレゼン資料の実例 · 決算説明資料の実例集
Yamaha Corporation (TSE 7951, musical instruments and audio; not Yamaha Motor) H1 FY2026 earnings presentation for the six months to September 2026 — a Japanese-language deck originally published on TDnet on November 5, 2026, covering results, raised profit guidance and segment trends.
このスライドの表紙をスタイルの参考にして、ご自身の内容からスライドを作成します。 下のページから好きな1枚を選び、そのレイアウトを参考にすることもできます。
クイックナビゲーション
タグ
スライドを共有
Yamaha Corporation (TSE 7951, musical instruments and audio; not Yamaha Motor) H1 FY2026 earnings presentation for the six months to September 2026 — a Japanese-language deck originally published on TDnet on November 5, 2026, covering results, raised profit guidance and segment trends.
レイアウト、主要コンテンツ、視覚要素を含む各スライドページの詳細ビュー。
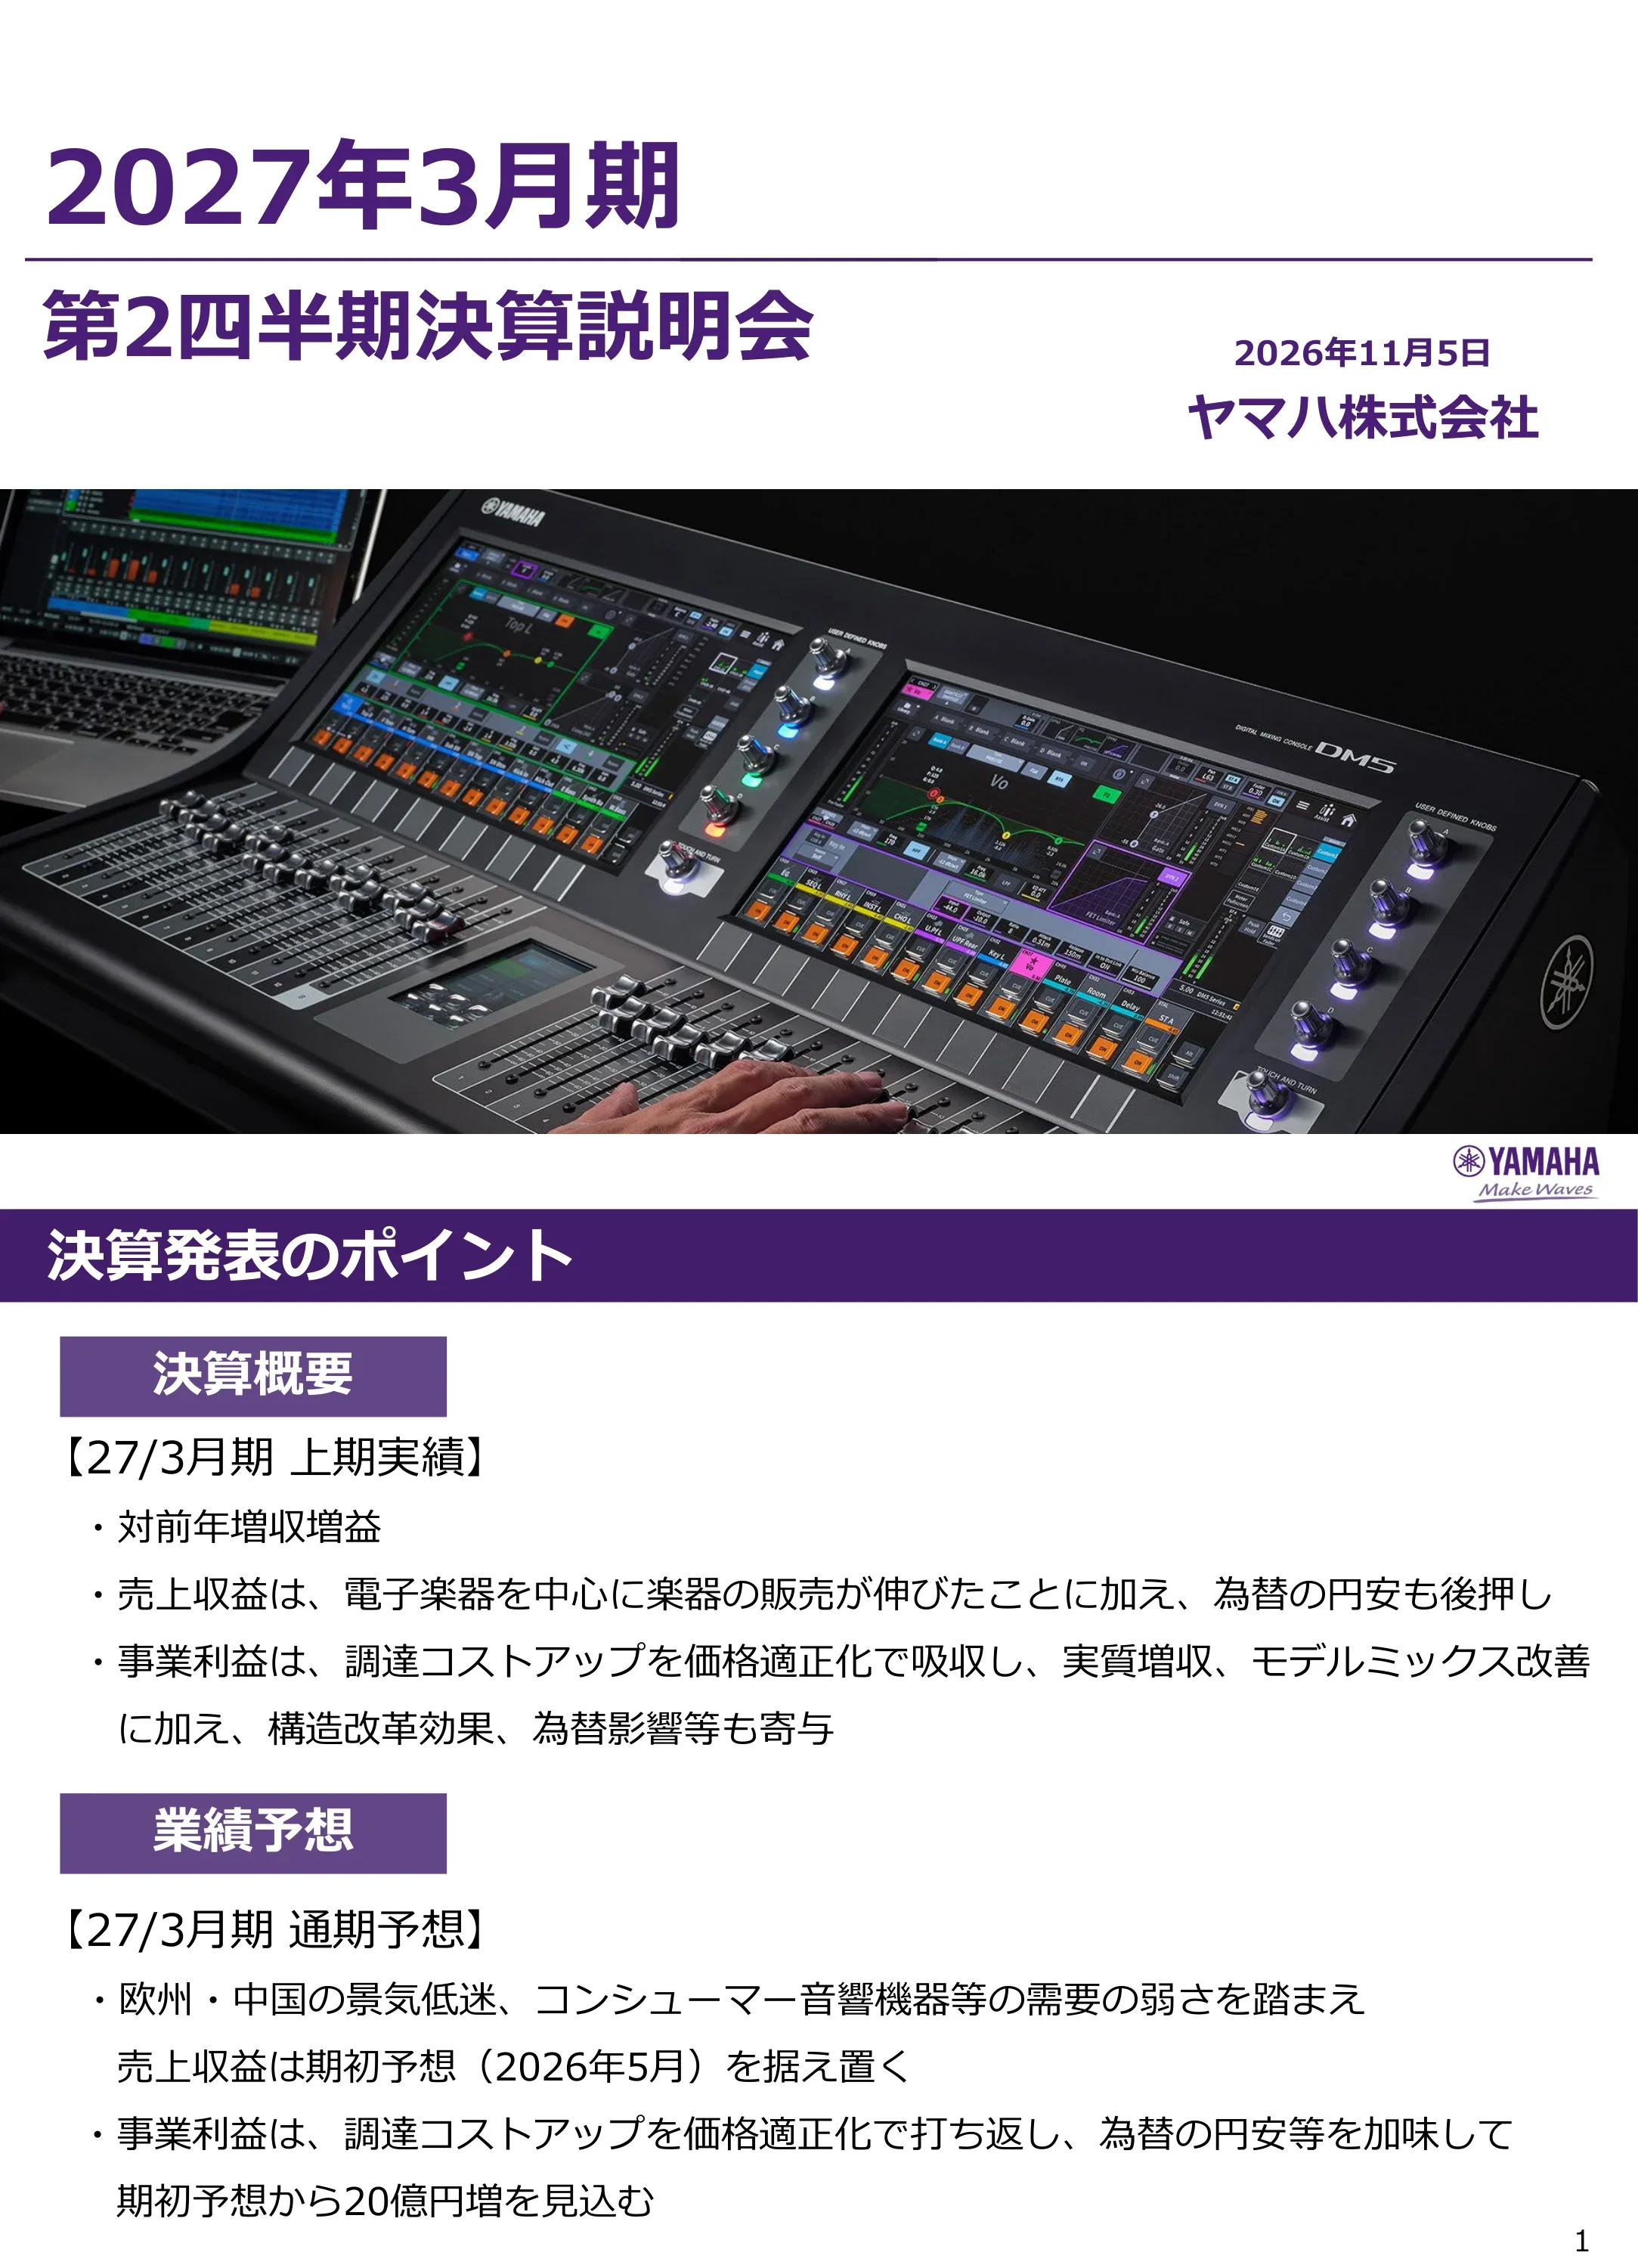
Title page for Yamaha Corporation's first-half results briefing for the fiscal year ending March 2027, dated November 5, 2026.
Large purple Japanese title over a horizontal rule, date and company name at right, full-width product photo across the lower half.
H1 revenue and profit rose year on year, driven by electronic instruments and a weaker yen; price optimization absorbed procurement cost increases. The full-year revenue forecast of ¥490 billion is held at the May 2026 level, while business profit guidance is raised by ¥2 billion (20億円).
Purple title bar with two labelled sections (Results Summary, Forecast), each followed by bullet text.
Section divider introducing the consolidated results summary.
Split layout: grand piano interior photo on the left, purple section label on white at right.
H1 revenue ¥237.9 billion (2,379億円, +9.9%; +2.2% excluding FX), business profit ¥22.3 billion (223億円, +74.2%, margin 9.4% vs 5.9%) and net profit attributable to owners ¥18.7 billion (187億円, +91.4%). Average rates: US$161 and EUR185.
Comparison table with prior-year and current-year columns, the current column outlined in purple; FX rate table below.
Waterfall from ¥12.8 billion to ¥22.3 billion: FX +60, cost increases −39, higher sales/production and model mix +89, production and structural reform +13, SG&A −27, other businesses −1 (in 億円).
Waterfall chart with purple start and end bars and blue (positive) and pink (negative) delta blocks.
Musical Instruments revenue ¥159.5 billion and business profit ¥15.4 billion (margin 9.6%, +4.2pt); Audio Equipment revenue ¥70.8 billion and profit ¥7.0 billion (9.9%); Other Businesses revenue ¥7.6 billion with a ¥0.1 billion loss. FX impact shown per line.
Three color-coded segment blocks (cream, light blue, grey), each with revenue, profit and margin rows across four columns.
FY forecast revenue ¥490 billion unchanged, business profit raised from ¥38.0 billion to ¥40.0 billion (margin 8.2%), net profit ¥31.0 billion unchanged. Assumed rates US$158 and EUR183 (H2: US$155, EUR180); ¥1 moves in USD shift revenue about ¥0.9 billion, and in EUR about ¥0.62 billion.
Five-column forecast table (prior year, previous forecast, current forecast, YoY, vs previous) with FX assumptions and a sensitivity box.
Two waterfalls: vs FY3/26 (¥31.9bn to ¥40.0bn: FX +64, cost increases −124, sales/mix +170, production/reform +18, SG&A −54, other +7) and vs previous forecast (¥38.0bn to ¥40.0bn: FX +26, cost increases −48, sales/mix +42, SG&A +2, other −2).
Two stacked waterfall charts with broken-axis start and end bars.
Musical Instruments ¥322.0bn revenue / ¥26.5bn profit (8.2%); Audio Equipment ¥150.0bn / ¥12.5bn (8.3%); Other ¥18.0bn / ¥1.0bn (5.6%), versus FY3/26 actuals.
Same three-panel segment table format as page 6, with forecast column highlighted.
Revenue forecasts unchanged in all segments; Musical Instruments profit raised by ¥2.5bn to ¥26.5bn, Audio Equipment profit cut by ¥0.5bn to ¥12.5bn, Other unchanged at ¥1.0bn.
Three-panel segment table comparing previous and current forecasts with FX impact column.
Section divider for the segment-by-segment review.
Grand piano photo at left, purple section label at right.
H1 revenue ¥159.5bn (105% on a constant-currency basis) and profit ¥15.4bn (9.6% margin); all categories except pianos grew, electronic instruments rose double digits on new products, wind/strings/percussion and guitars were firm. Full-year revenue forecast ¥322.0bn and profit ¥26.5bn.
Two bar charts (revenue left, business profit lower right) comparing H1 and full-year periods, with a commentary box upper right.
Quarterly stacked sales for FY3/25, FY3/26 and FY3/27 forecast: pianos ¥40.4bn (96%), electronic instruments ¥117.0bn (106%), wind/strings/percussion ¥76.8bn (102%), guitars ¥51.7bn (100%), with constant-currency growth rates in red.
Four groups of stacked quarterly column charts under purple category labels.
Quarterly stacked sales by region including software and music schools: Japan ¥59.9bn, North America ¥89.2bn, Europe ¥71.0bn, China ¥34.0bn, Other ¥67.9bn forecast for FY3/27.
Five color-coded groups of stacked quarterly columns with region labels beneath.
New launches: GCB grand piano (Sept 2026, Yamaha's smallest grand), PSR-SX620 portable keyboard (Oct 2026), YDS-152/YDS-122 digital saxophones (Dec 2026) and FG7/FS7 acoustic guitars (Oct 2026).
Four product columns under purple category labels, each with a cut-out photo, name, launch date and short description.
H1 revenue ¥70.8bn (98% constant currency) and profit ¥7.0bn (9.9% margin); consumer audio weak, professional audio flat with recovery in Japan and the US, mobility audio up double digits outside China. Full-year forecast ¥150.0bn revenue and ¥12.5bn profit.
Revenue and profit bar charts with a commentary box, matching page 12.
Quarterly stacked sales: consumer audio ¥45.3bn, professional audio ¥74.5bn and mobility audio ¥19.3bn forecast for FY3/27.
Three groups of stacked quarterly columns under purple labels.
Regional quarterly sales: Japan ¥47.6bn, North America ¥34.3bn, Europe ¥32.0bn, China ¥7.7bn (sharp declines in FY3/26) and Other ¥28.4bn forecast.
Five region groups of stacked quarterly columns with colored labels.
R200A stereo receiver (Nov 2026), DM5 series digital mixer (Nov 2026), and the Dynamic Sound Yamaha Ultimate premium audio system in Mitsubishi Motors' new Pajero (Dec 2026).
Three product columns for consumer, professional and mobility audio, with photos and descriptions.
H1 revenue ¥7.6bn (88%); factory automation equipment recovered but automotive interior parts declined. Full-year revenue ¥18.0bn and profit ¥1.0bn expected despite ending golf product sales.
Revenue bar chart left, profit chart with negative values right, commentary box above.
Section divider for balance sheet, returns and investment data.
Grand piano photo at left, purple section label at right.
Total assets ¥654.9bn at end-September 2026 (+¥37.3bn from March); cash ¥147.8bn, inventories ¥163.3bn, equity ¥506.6bn. March 2027 forecast total assets ¥661.0bn.
Balance sheet table with March, September, change and forecast columns; total rows shaded.
ROE forecast 6.2% vs 7.0% cost of equity; ROIC 5.5% vs 6.9% WACC, both against 10% mid-term targets. Annual dividend ¥26, total payout target 50%+ under Rebuild & Evolve, and cross-shareholdings cut to ¥37.9bn (7.5% of equity).
Four-quadrant layout: ROE and ROIC line charts on top, dividend/payout combo chart and cross-shareholding chart below, with plan labels.
H1 capex ¥5.4bn and depreciation ¥7.5bn; R&D ¥14.3bn. Full-year forecast capex ¥16.0bn, depreciation ¥15.5bn and R&D ¥29.0bn, split by segment.
Four stacked bar charts arranged in a grid (H1 and full year, capex and R&D).
Section divider for strategic topics.
Grand piano photo at left, purple section label at right.
Grid of 15 new products and services, from the GCB grand piano, Electone STAGEA and YDP digital pianos to Revstar guitars, RX300A AV receiver, DM5 mixer, PA speakers, the gigmii co-creation music app and SoundUD intercoms for Shinkansen Supreme Class cabins.
Three-by-five card grid on a lavender background, each card with a black category tag, product image and model name.
Progress under four themes: 22 straight years as No.1 in Japan's SOHO router market, Yamaha audio in 20 models from six automakers, music education projects in the Philippines and Vietnam, and a cut in its Yamaha Motor stake from 2.84% to 1.46%; Integrated Report 2026 published.
Multi-panel infographic in purple, teal, orange, blue and yellow, with photos, a stake-reduction line chart and source URLs.
Section divider for supplementary data.
Grand piano photo at left, purple section label at right.
Q2 (July–September) revenue ¥121.5bn (+8.1%), business profit ¥13.0bn (+60.5%, 10.7% margin) and net profit ¥8.0bn (+8.2%).
Same comparison table format as page 4 with FX rates.
Q2 Musical Instruments revenue ¥81.8bn and profit ¥8.9bn (10.9%); Audio Equipment ¥35.8bn and ¥4.2bn (11.6%); Other ¥3.9bn with a ¥0.1bn loss.
Three-panel segment table matching page 6.
Reconciliation from business profit ¥22.3bn to operating profit ¥26.8bn, profit before tax ¥26.2bn and net profit ¥18.7bn.
Income-statement style table with colored group labels and highlighted subtotal rows.
Full-year forecast reconciliation: business profit ¥40.0bn, operating profit ¥44.5bn, profit before tax ¥43.5bn, taxes ¥12.3bn, net profit ¥31.0bn.
Same income-statement table format as page 31 with forecast column.
Japanese-language caution that forecasts are based on currently available information and may differ due to economic conditions, demand and USD/EUR exchange rates.
Centered text on a grey horizontal band.
このスライドと基礎となるプレゼンテーションコンテンツに関する一般的な質問。
The slides are in Japanese. This is Yamaha Corporation's 決算説明会資料 (earnings briefing materials) for the second quarter of the fiscal year ending March 2027, originally published on TDnet, the Tokyo Stock Exchange's Timely Disclosure network, on November 5, 2026. The summaries on this page are in English.
It is Yamaha Corporation (TSE 7951), the musical instruments and audio equipment maker. Yamaha Motor is a separate listed company; the deck itself notes that Yamaha Corporation cut its stake in Yamaha Motor from 2.84% to 1.46%.
Yamaha's fiscal year runs from April to March. FY2026 in this title means April 2026 – March 2027, which the company calls 2027年3月期 (the fiscal year ending March 2027). H1 is April–September 2026.
H1 revenue was 2,379億円 (about ¥237.9 billion, +9.9%), business profit 223億円 (+74.2%, 9.4% margin) and net profit attributable to owners 187億円 (+91.4%). Full-year business profit guidance was raised by 20億円 to 400億円, with revenue held at 4,900億円.
億円 is ¥100 million. So 2,379億円 is ¥237.9 billion. All tables in the deck use this unit, and figures on this page keep the company's own units.
Yes. The original PDF is available, along with an editable PowerPoint version converted from it, so you can reuse the table, waterfall and segment chart layouts in your own presentation.
The profit bridge waterfalls (pages 5 and 8), the color-coded segment tables (pages 6, 9 and 10), the quarterly stacked sales charts by product and region (pages 13–14 and 17–18), and the ROE/ROIC and shareholder return dashboard (page 23).
Company IR library referenced in the deck (Integrated Report 2026 and other IR materials).

Create Your Own Slides
Turn your ideas into professional presentations in seconds with 2slides AI.
プロフェッショナルなデザインを参照し、スタイルを選択し、完璧なテキストレンダリングでスライドを生成。Nano Banana搭載—今すぐプレゼンテーションの作成を始めましょう。
© 2026 2slides。全著作権所有。


