
収録コレクション: 投資家向けプレゼン資料の実例
Venture Corporation's Business Update for 3Q 2026, a six-slide investor presentation dated 6 November 2026 and lodged with SGX (Singapore Exchange, ticker V03). Venture, an STI-constituent provider of electronics manufacturing services and technology solutions, reports third-quarter revenue of S$ (Singapore dollars) 790.4 million, up 26.0% year on year, net profit of S$67.8 million (+21.9%) and earnings per share of 23.5 Singapore cents (+22.2%). The deck splits revenue between Portfolio B (Test & Measurement Instrumentation, Networking & Communications, Advanced Payment Systems, Advanced Industrial, Semiconductor Related Equipment and others), which grew 38.1% to S$560 million, and Portfolio A (Life Science, Medtech and Lifestyle Consumer), which grew 4.0% to S$231 million. It also covers balance sheet highlights (working capital of S$1.06 billion, a net cash position and net asset value of S$9.54 per share) and the FY2026 outlook.
このスライドの表紙をスタイルの参考にして、ご自身の内容からスライドを作成します。 下のページから好きな1枚を選び、そのレイアウトを参考にすることもできます。
クイックナビゲーション
タグ
スライドを共有
Venture Corporation's Business Update for 3Q 2026, a six-slide investor presentation dated 6 November 2026 and lodged with SGX (Singapore Exchange, ticker V03). Venture, an STI-constituent provider of electronics manufacturing services and technology solutions, reports third-quarter revenue of S$ (Singapore dollars) 790.4 million, up 26.0% year on year, net profit of S$67.8 million (+21.9%) and earnings per share of 23.5 Singapore cents (+22.2%). The deck splits revenue between Portfolio B (Test & Measurement Instrumentation, Networking & Communications, Advanced Payment Systems, Advanced Industrial, Semiconductor Related Equipment and others), which grew 38.1% to S$560 million, and Portfolio A (Life Science, Medtech and Lifestyle Consumer), which grew 4.0% to S$231 million. It also covers balance sheet highlights (working capital of S$1.06 billion, a net cash position and net asset value of S$9.54 per share) and the FY2026 outlook.
レイアウト、主要コンテンツ、視覚要素を含む各スライドページの詳細ビュー。
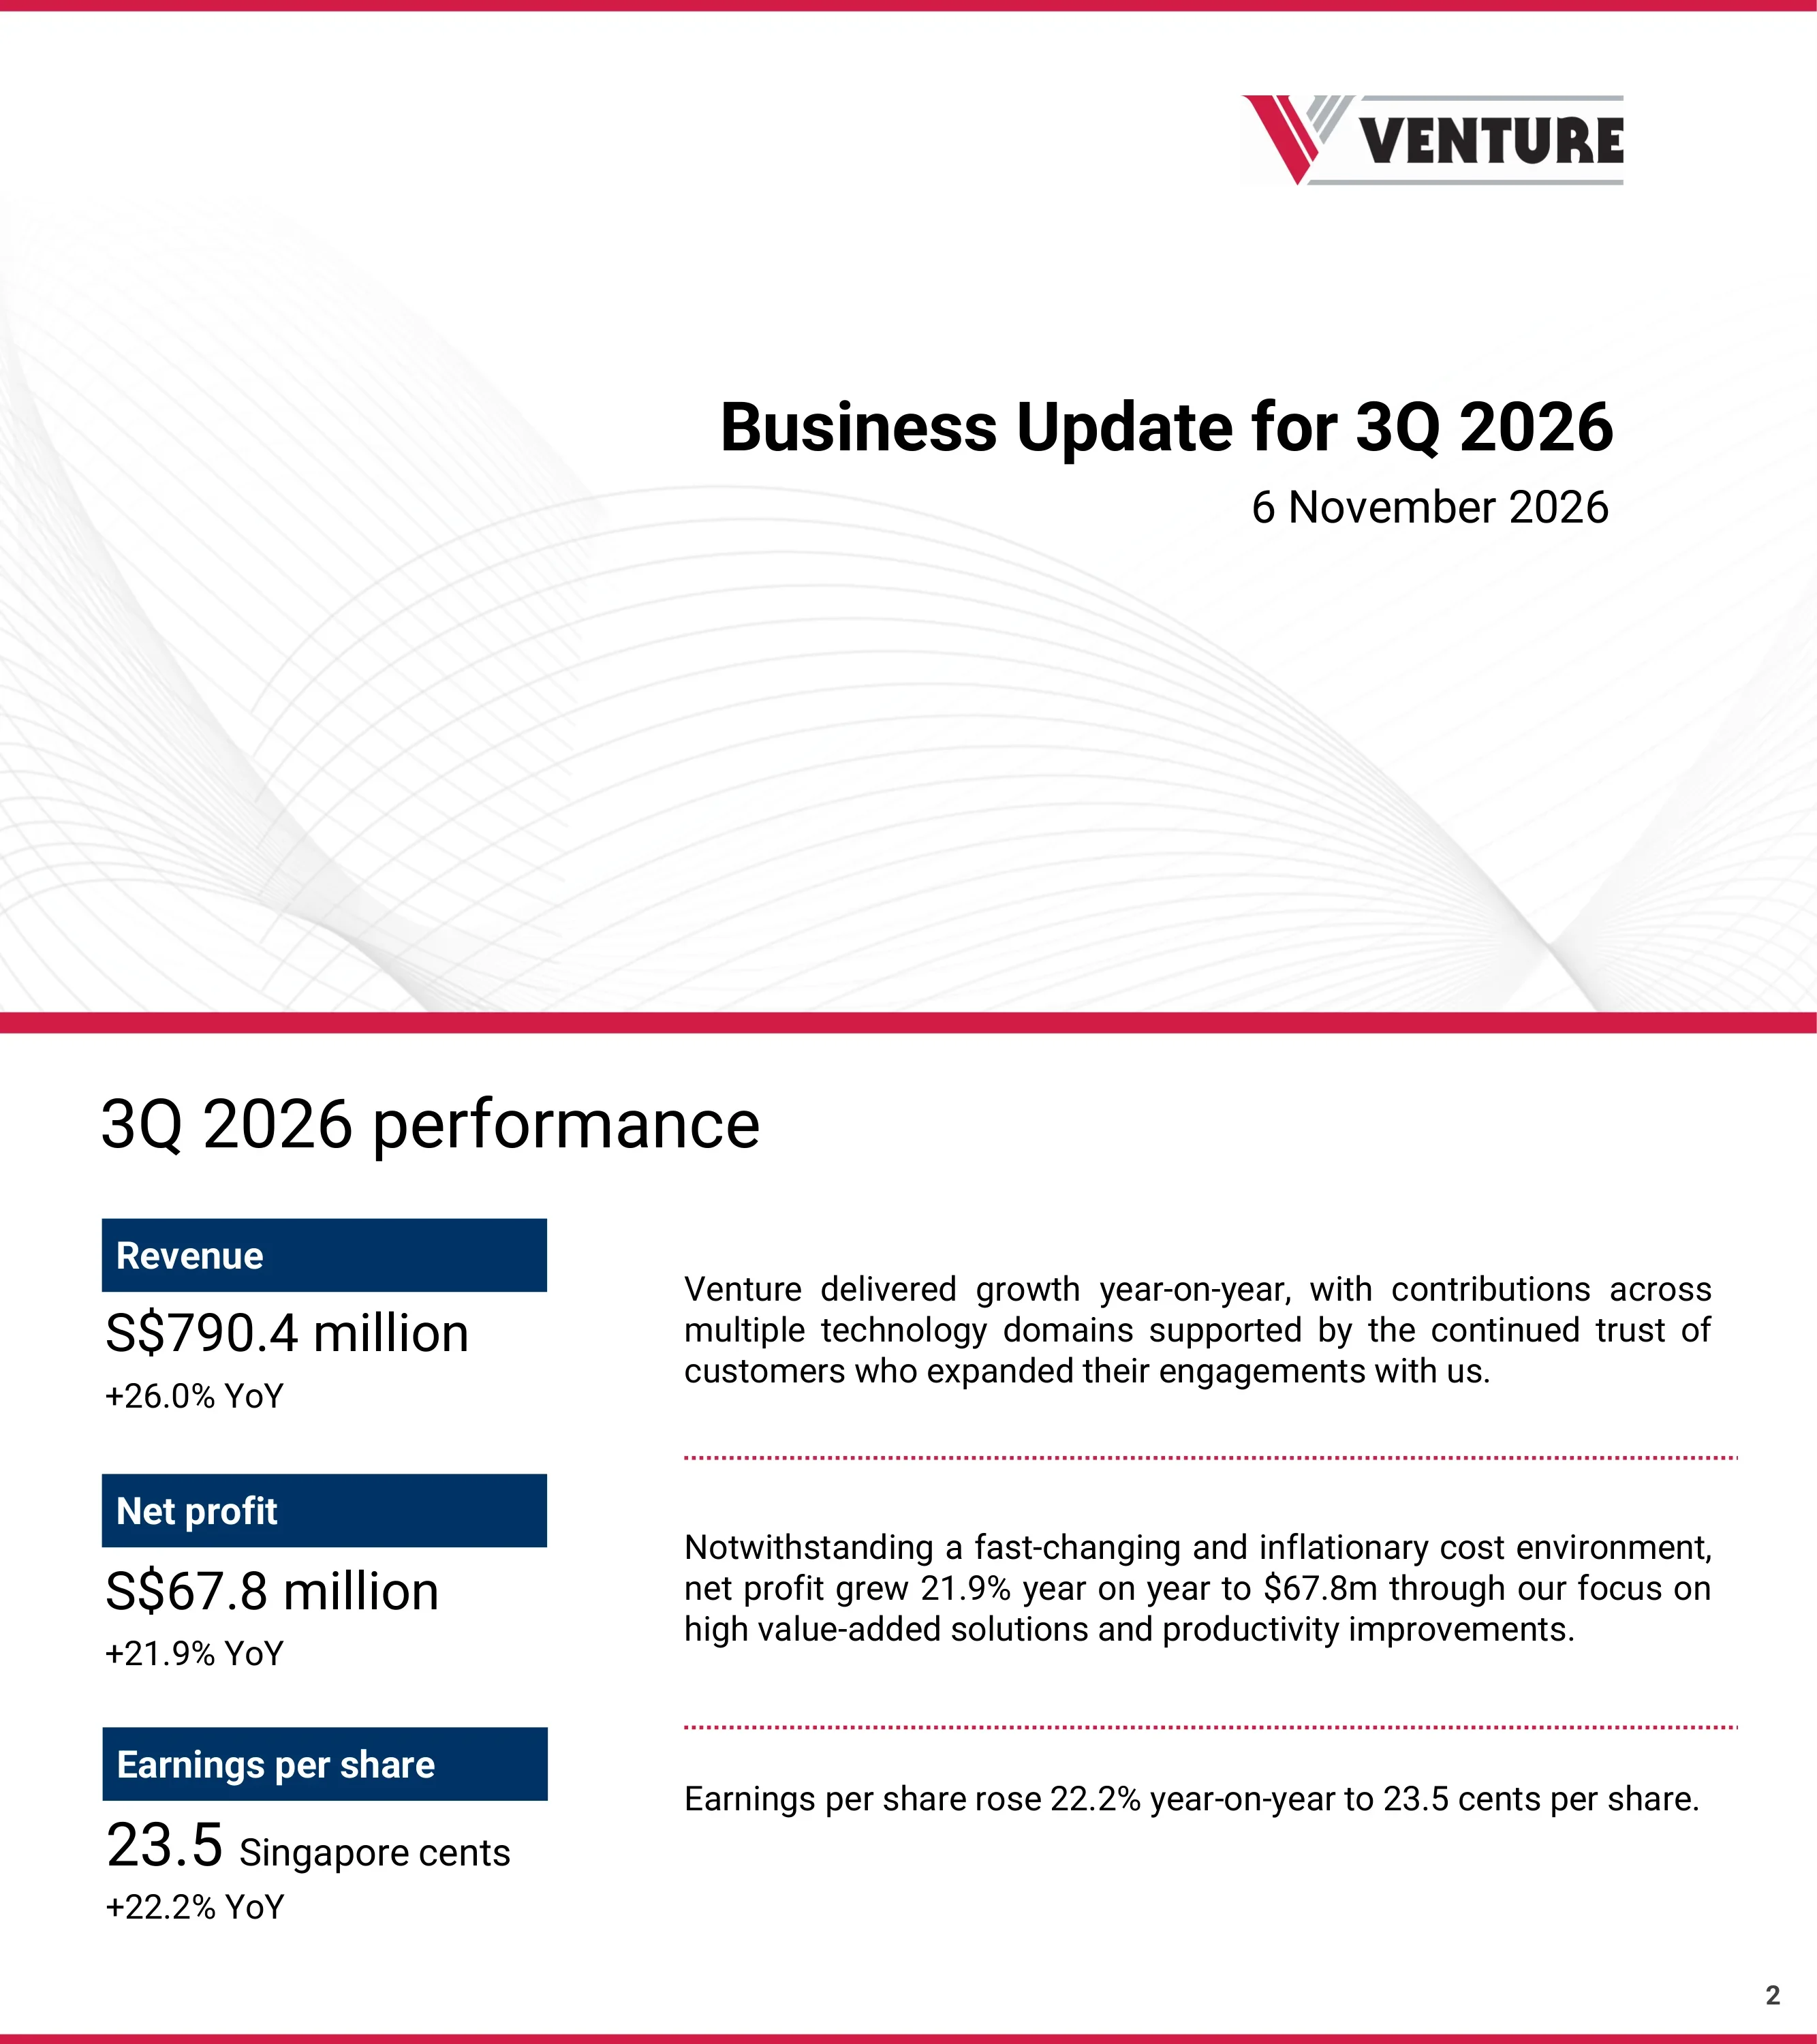
Cover slide titled 'Business Update for 3Q 2026', dated 6 November 2026, with the Venture logo (a red and grey 'V' mark beside the VENTURE wordmark) in the top right. No figures appear on this slide; it sets the document as a quarterly business update rather than a full results presentation.
Right-aligned title block in the middle of the slide, logo top right, thin crimson rules along the top and bottom edges, faint grey wireframe wave pattern in the background
Three headline KPIs for the quarter, each with management commentary. Revenue was S$790.4 million, up 26.0% year on year; Venture attributes the growth to contributions across multiple technology domains and customers that expanded their engagements. Net profit was S$67.8 million, up 21.9% year on year, which management credits to its focus on high value-added solutions and productivity improvements despite a 'fast-changing and inflationary cost environment'. Earnings per share rose 22.2% year on year to 23.5 Singapore cents. Net profit grew more slowly than revenue (21.9% against 26.0%), which implies a slightly lower net margin, around 8.6% of revenue.
Two-column KPI layout: left column has three navy label bars (Revenue, Net profit, Earnings per share) with the large figure and YoY change beneath each; right column has the matching commentary paragraph, separated by dotted crimson rules
A '3Q 2026 YoY Revenue Change' stacked bar chart in S$ millions. Total revenue rose from 627 in 3Q 2025 to 790 in 3Q 2026 (+26.0%). Portfolio B rose from 405 to 560 (+38.1%) and Portfolio A from 222 to 231 (+4.0%). The commentary reads 'Portfolio B +S$154m (+38.1%) YoY', driven by continued growth momentum across all technology domains with production ramp-ups and market share gains, and 'Portfolio A +S$9m (+4.0%) YoY', driven by steady growth in Life Science and continued progress on the next-generation product in the Lifestyle Consumer domain. Footnotes define Portfolio A as Life Science, Medtech and Lifestyle Consumer, and Portfolio B as Test & Measurement Instrumentation, Networking & Communications, Advanced Payment Systems, Advanced Industrial, Semiconductor Related Equipment and others. A note says numbers may not add up due to rounding; the rounded bars give a Portfolio B increase of 155, against S$154m in the text. Portfolio B is about 71% of quarterly revenue.
Left half: stacked two-segment bar chart (navy Portfolio A at the bottom, green Portfolio B on top) for 3Q 2025 and 3Q 2026, with oval growth callouts and arrows, plus a grey '+26.0%' total badge; right half: two underlined headings with bullet commentary; portfolio definitions and rounding note across the bottom
Three balance sheet measures as at 30 September 2026. The working capital position was S$1.06 billion, up from S$830.8 million at 31 December 2025, because Venture increased inventories to front-load critical components and meet growing customer demand. Venture says it maintained a strong net cash position; the slide gives no figure, and says operating activities remained highly cash-generative despite the higher working capital, supporting business growth, dividend payouts and share buybacks. Net asset value was S$9.54 per share, compared with S$9.45 as at 30 September 2025. The working capital comparison uses the December 2025 year-end, while the NAV comparison uses September 2025.
Two-column KPI layout mirroring page 2: navy label bars with dates on the left (Working capital position, Net cash position, Net asset value, each 'as at 30 Sep 2026') with values beneath, and explanatory paragraphs on the right divided by dotted crimson lines
Four paragraphs of management outlook. Venture says it is well positioned to deliver growth for FY2026 as robust customer demand continues to support operating performance. Its core growth pillars in Test & Measurement Instrumentation, Networking & Communications and Semiconductor-Related Equipment remain resilient, and it sees encouraging signs of recovery in the Life Science technology domain. Its R&D engineering capabilities in high-mix, high-value manufacturing and its robust balance sheet leave the Group nimble and prepared for changes in the macro business environment. Going forward it will focus on deepening strategic collaborations with global partners, growing new customers and investing in new differentiating capabilities for future growth. The slide contains no numeric guidance.
Single-column, fully justified text in four spaced paragraphs under a large 'Outlook' heading; page number bottom right
Closing slide with a large bold 'Thank you' and a disclaimer. The disclaimer says the presentation may contain forward-looking statements, including statements about future operating results and plans. These are based on assumptions and estimates and are subject to known and unknown risks, uncertainties and other factors that may cause the Venture Group's actual results to differ materially from those expressed or implied. Readers are cautioned not to place undue reliance on them.
Centered 'Thank you' headline; disclaimer heading and justified paragraph across the bottom; light grey wireframe wave background matching the cover
このスライドと基礎となるプレゼンテーションコンテンツに関する一般的な質問。
For the third quarter of 2026, Venture reported revenue of S$ (Singapore dollars) 790.4 million, up 26.0% year on year, net profit of S$67.8 million, up 21.9%, and earnings per share of 23.5 Singapore cents, up 22.2%.
Under Singapore's half-yearly reporting regime, SGX-listed companies such as Venture are required to publish full financial statements only for the half year and the full year. For the first and third quarters, many issue a shorter business update instead: headline revenue, profit, balance sheet points and outlook, without full financial statements. This deck is Venture's 3Q 2026 business update.
Portfolio B, which covers Test & Measurement Instrumentation, Networking & Communications, Advanced Payment Systems, Advanced Industrial, Semiconductor Related Equipment and others, grew 38.1% (+S$154m) to about S$560 million on production ramp-ups and market share gains. Portfolio A, which covers Life Science, Medtech and Lifestyle Consumer, grew 4.0% (+S$9m) to about S$231 million.
Working capital rose from S$830.8 million at 31 December 2025 to S$1.06 billion at 30 September 2026 because Venture built inventories to front-load critical components and meet growing customer demand. Management says operating activities remained highly cash-generative and the company kept a strong net cash position.
Net asset value was S$9.54 per share as at 30 September 2026, compared with S$9.45 as at 30 September 2025.
No numeric guidance is given. The Outlook slide says Venture is well positioned to deliver growth for FY2026, that its Test & Measurement, Networking & Communications and Semiconductor-Related Equipment domains remain resilient, and that Life Science is showing encouraging signs of recovery.
The deck was lodged with SGX (Singapore Exchange) as a company announcement on 6 November 2026 under Venture Corporation's ticker V03 and is available through SGX's announcement system.
Yes. Its structure is a useful pattern for a short quarterly update: cover, headline KPIs with commentary, a stacked bar chart of revenue by segment, balance sheet highlights, outlook, and a disclaimer. You can download it and adapt the layouts to your own figures.
Original presentation lodged with SGX on 6 November 2026

Create Your Own Slides
Turn your ideas into professional presentations in seconds with 2slides AI.
プロフェッショナルなデザインを参照し、スタイルを選択し、完璧なテキストレンダリングでスライドを生成。Nano Banana搭載—今すぐプレゼンテーションの作成を始めましょう。
© 2026 2slides。全著作権所有。


