
収録コレクション: 投資家向けプレゼン資料の実例 · インド企業のIR資料 実例集
Tata Steel Q2 FY27 Earnings Presentation — Tata Steel Ltd's 30-page results presentation for the financial quarter ended 30 September 2026 (2QFY27), filed with BSE/NSE on 7 November 2026. It covers consolidated revenue of Rs 65,436 crores, EBITDA of Rs 10,665 crores (Rs 13,462 per ton) and reported PAT of Rs 3,700 crores. It also covers net debt of Rs 91,423 crores, 16% QoQ growth in India deliveries, the India capacity roadmap from 27.4 MTPA towards ~40 MTPA, decarbonisation in the UK and Netherlands, and segment P&Ls for Standalone, Netherlands and UK.
このスライドの表紙をスタイルの参考にして、ご自身の内容からスライドを作成します。 下のページから好きな1枚を選び、そのレイアウトを参考にすることもできます。
クイックナビゲーション
タグ
スライドを共有
Tata Steel Q2 FY27 Earnings Presentation — Tata Steel Ltd's 30-page results presentation for the financial quarter ended 30 September 2026 (2QFY27), filed with BSE/NSE on 7 November 2026. It covers consolidated revenue of Rs 65,436 crores, EBITDA of Rs 10,665 crores (Rs 13,462 per ton) and reported PAT of Rs 3,700 crores. It also covers net debt of Rs 91,423 crores, 16% QoQ growth in India deliveries, the India capacity roadmap from 27.4 MTPA towards ~40 MTPA, decarbonisation in the UK and Netherlands, and segment P&Ls for Standalone, Netherlands and UK.
レイアウト、主要コンテンツ、視覚要素を含む各スライドページの詳細ビュー。
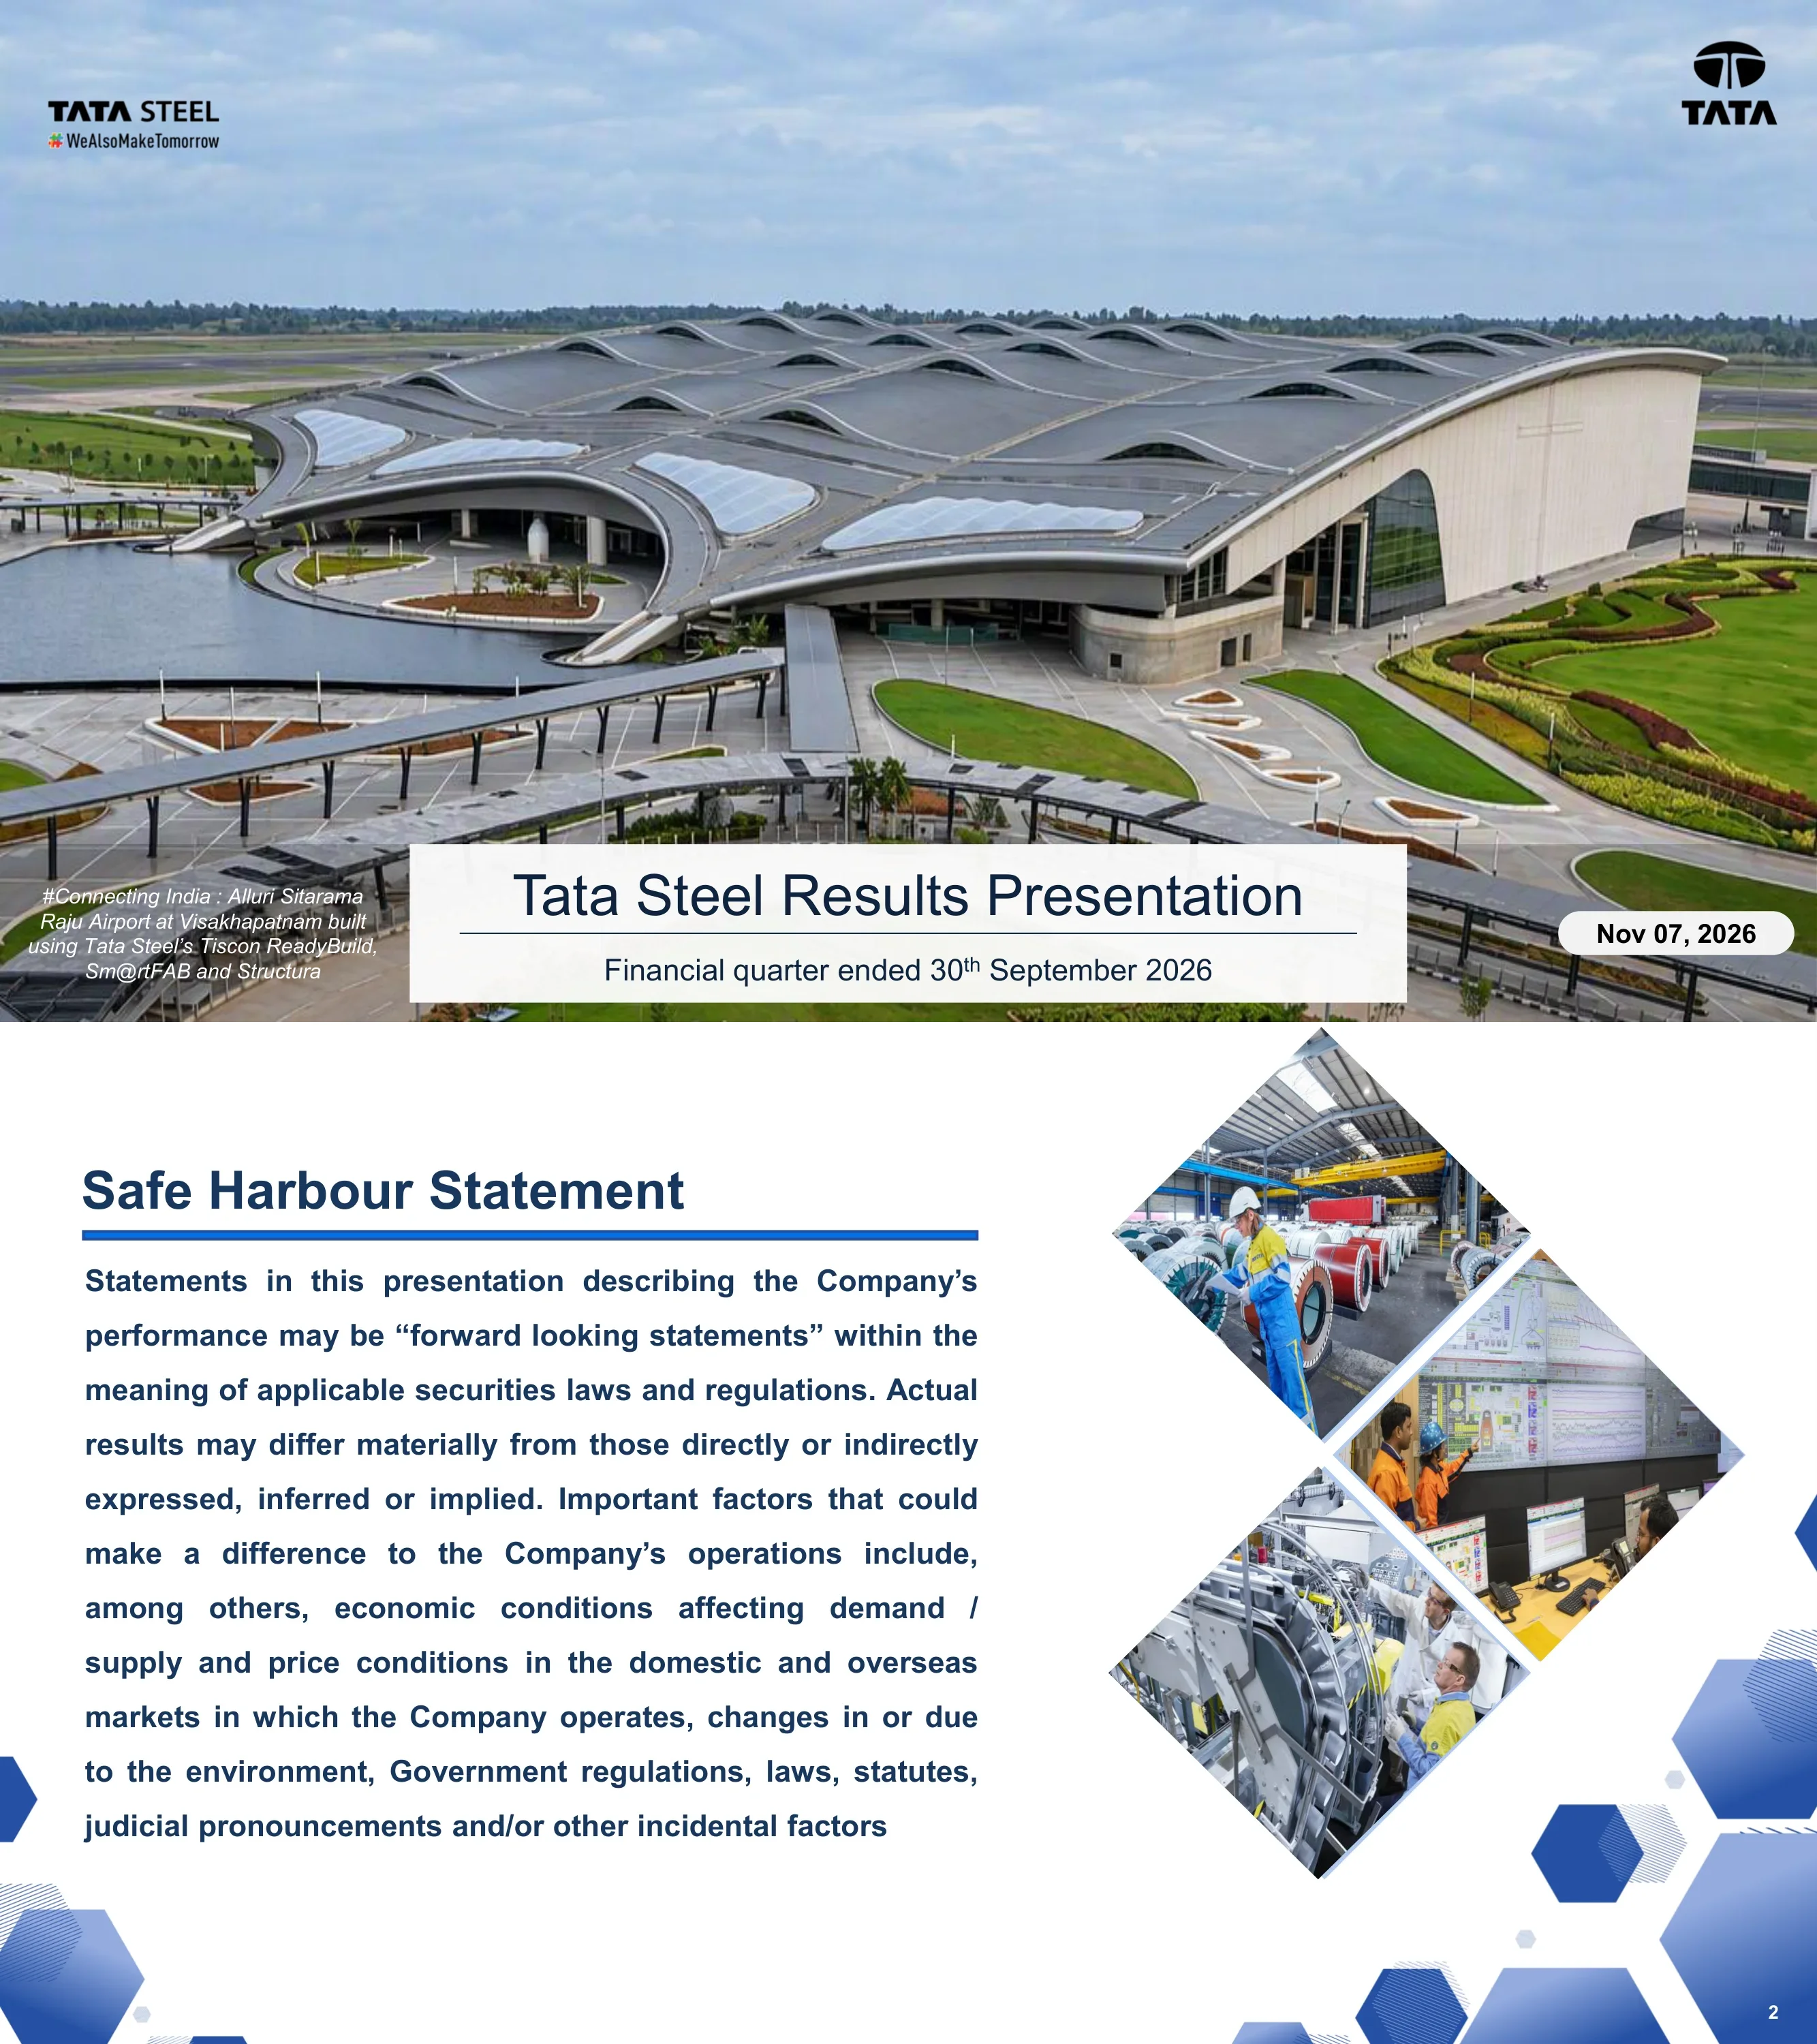
Cover slide dated Nov 07, 2026 for the quarter ended 30 September 2026. The full-bleed photo shows Alluri Sitarama Raju Airport at Visakhapatnam, built using Tata Steel's Tiscon ReadyBuild, Sm@rtFAB and Structura.
Full-bleed aerial photograph with a white title band at the bottom centre, a date pill at bottom right, and the Tata Steel and Tata logos in the top corners
Standard forward-looking statements disclaimer. It warns that actual results may differ because of economic conditions, domestic and overseas demand, supply and price conditions, environmental changes, government regulations and judicial pronouncements.
Left text column in justified bold type with an underlined heading; right side has a diamond-shaped collage of three industrial photos and decorative hexagons
The slide shows a 19% LTIFR figure over the last 15 years, with a bar chart from FY11 to 1HFY27. Fatalities were 5, 4, 5 and 6 in FY23–FY26, and 6 in 1HFY27; safety initiatives include 'Safety Connect' with 15+ companies and regulators, mock drills, and 'Mental Health Matters' and CPR training.
Left half holds a KPI callout, a small fatalities bar chart and a long LTIFR bar chart; right half holds three photos with icon-led columns for Workplace Safety, Behavioral Safety and Employee Wellbeing
CSR has impacted 45 lakh+ lives, with 68 targets prioritised across 15 UN SDGs and more than ₹2,300 crores spent over the last 5 years. Programme metrics include 3 lakh+ children in foundational literacy, ₹800+ crores of public funds unlocked, 5,700+ persons with disabilities connected through Sabal, and ~1.7 million m3 of water storage created.
Left photo column with two colored KPI tiles; a 3x4 grid of titled cards, each with a one-line metric, around a central photo and spend callout
Section divider introducing the strategy section. The caption notes that Zinc-Aluminum-Magnesium coated coil is now produced at Tata Steel Kalinganagar for construction, infrastructure, solar and agriculture applications.
Split diagonal layout with large blue section title and italic caption on white at left, and a photo of steel coils at right
Six strategic pillars sit around a central heritage image: Leadership in India, Become Future Ready, Robust Financial Health, Leadership in Sustainability, Leadership in Technology & Digital, and Consolidate position as global cost leader.
Central circular photo flanked by three image tiles on each side, under the Tata Steel wordmark and headline
A table maps global shifts to data and strategic levers. India steel demand grew from 95 mn tons in FY2021 to 164 mn tons in FY2026; crude and coking coal prices were around $280/t in September 2026; the ECB and RBI each raised rates by 25 bps; and carbon is becoming a cost line in the UK, the EU and India.
Three-column, four-row matrix: Global Shift (with orange bullets), Data, and Strategic levers (in blue filled boxes)
India steel demand rose from 91 mn tons (FY18) to 164 mn tons (FY26), with 220 mn tons estimated for FY30. Per-capita use is 116 kg against a 210 kg global average; Tata Steel's India capacity grew from 13.0 to 27.4 MTPA and is planned at ~40 MTPA.
Three columns: a green demand bar chart, a stack of four driver callouts (116 kg, 1.8x, Premiumisation, Policy), and a blue capacity bar chart with a hatched planned bar
Existing India capacity totals 27.4 MTPA: Jamshedpur 7.5 flats and 3.5 longs, Kalinganagar 8.0, Meramandali 5.6, NINL 1.0, Gamharia 1.0 and Ludhiana EAF 0.75. Expansion projects include a 4.8 MTPA NINL expansion at Rs 33,873 crores, a 2.5 MTPA thin slab caster at TSM, and a planned 5 MTPA plant in Maharashtra.
Left capacity table by site (flats/longs); centre four strength statements; right 2x2 photo grid of expansion projects with captions
The downstream portfolio covers cold rolled, galvanised, color coated, tubes, tinplate, wires and ready-to-use products, each with its key brands. Expansions include a ~0.9 MTPA CAL and two ~0.5 MTPA CGL lines at TSK, a 0.7 MTPA HRPGL, tinplate Ph1 going from 0.4 to 0.7 MTPA, and a 75 KTPA wires addition.
Three-part table: product and brand-logo list, ramp-up/expansion descriptions, and an end-use matrix (Auto, Engineering, Packaging, Construction) shaded green where relevant
There are six segment strategies: auto, high-margin retail through Aashiyana, construction solutions, MSMEs, engineering and packaging, and emerging segments such as shipbuilding, defence and data centers. The network includes 80+ steel processing centers, 35 construction service centers, 22 stockyards, 80+ micro segments and 35k+ retail influencers.
2x3 grid of image-plus-text strategy blocks above a rounded KPI strip with five large numbers
Tata Steel targets Net Zero by 2045, with ESG focus areas ranging from circular economy to R&D. India levers and their status: HIsarna demo and EASyMelt pilot, a commissioned 0.75 MTPA EAF, coke oven gas injection at TSM and Kraftblock, renewable energy, and H2 injection trials with biochar and CBM gas.
Left panel with a Net Zero badge and six ESG icons; right panel with a row of four plant photos and a two-column Strategic Levers vs Status table
The UK is moving to a ~3 MTPA scrap-based EAF costing £1.25 billion, with £500 million of UK Government funding. It targets ~0.4 tCO2e per ton of crude steel and a 50 million ton CO2e reduction over a decade. In the Netherlands, Roadmap Plus has spent over €300 million, cutting odor load by 85%, PM10 by 41% and PAH emissions at the three largest sources by 50% against 2019.
Two side-by-side panels (UK EAF project update; Netherlands Roadmap Plus), each with a blue headline banner, a green tag, photos and three icon-led bullets
The digital programme includes 950+ AI models and agents, $1 bn+ GMV on digital customer platforms, 6 years as a Gartner Digital Execution Advanced Leader, and 78% of steel production from WEF Lighthouse sites. The three pillars are smart manufacturing, a single SAP/CFIN backbone across 169 entities, and AI-powered customer platforms.
Left column of four color-topped KPI cards; right three numbered pillar columns, each with a headline, description and screenshot
The cost optimization target for FY2027 is Rs 7,140 crores, measured against an average FY2026 baseline. Key drivers are raw material and procurement cost, production yield and fuel rate optimization, and downstream and supply chain value enhancement.
Large photo of the Meramandali raw material handling system at left; right has a target callout box and three plus-icon driver groups
Financial highlights: India EBITDA of Rs 10,634 crores, liquidity of Rs 40,076 crores, cash of ~Rs 10,300 crores, capex of Rs 3,280 crores and net debt to EBITDA of 2.4x. Total shareholder returns were 15% for Tata Steel against 5% for the Nifty 50 and 4% for the Sensex over 3 years, and 19% against 13% and 14% over 25 years.
Left four pillar tabs (Cash flows, Balance sheet, Capital Allocation, Risk Resilience) with bullets; right grouped bar charts of TSR over 3, 10 and 25 years
HR initiatives include a uniform One Tata Steel engagement model, insurance and engagement for 70,000+ contract workers, and an AI-enabled workforce framework. Tata Steel won the CII-EFI National Award for Excellence in Employee Relations in 2026.
Large employee photo with an award caption at left; three colored columns (Building One Tata Steel, Care for Contract Workforce, Digital Enablement) with icons and two items each
From FY22 to 1HFY27, EBITDA margin moved 26.2% → 15.9%, EBITDA per ton Rs 21,626 → 13,192, interest coverage 11.7x → 5.2x and net debt/EBITDA 0.80x → 2.39x. Gross and net debt reached Rs 1,02,368 and 91,423 crores; ratings are Moody's Baa2 and S&P BBB, both Stable.
Dashboard of six small line charts in two rows, plus a step-line credit rating chart with a ratings table inset
Section divider opening the quarterly results. The caption notes that India's first BIS-certified octagonal billets and Tata Tiscon rebars are now produced at Tata Steel Ludhiana.
Split diagonal layout with large green section title and italic caption at left, and a photo of octagonal billets at right
In 2QFY27 the consolidated business produced 8.07 mn tons, delivered 7.92 mn tons and earned revenue of Rs 65,436 crores, up 8% QoQ. EBITDA was Rs 10,665 crores (Rs 13,462/t) against 9,370 in 1QFY27 and 9,106 in 2QFY26; reported PAT was Rs 3,700 crores, helped by a Rs 349 crores exceptional gain from the TMILL stake fair valuation.
Left three-column P&L table (2QFY27, 1QFY27, 2QFY26) with bold key lines; right shaded 'Key drivers' bullet panel
EBITDA bridge from Rs 9,370 crores in 1QFY27: market impact +311, volume +294, DSP restart and improved cost profile at TSN +662, West Asia impact -275, and others +303, reaching Rs 10,665 crores.
Waterfall chart across most of the slide, with explanatory bullets on the right
Net debt walk: gross debt rose from Rs 97,985 crores (Jun'26) to Rs 1,02,368 crores (Sep'26), driven by leases +3,900, loans +209 and FX/others +273. Subtracting cash, bank and current investments of Rs 10,301 crores and an MTM hedge gain of Rs 644 crores gives net debt of Rs 91,423 crores.
Full-width waterfall chart with eight labelled bars
Six grouped bar charts compare India standalone, TSN and TSUK from FY23 to 1HFY27. In 1HFY27, India's coke rate was 365 kg/thm, specific energy 24.6 GJ/tcs, CO2 intensity 2.6 tCO2/tcs and solid waste utilisation 100%, against TSN's 294 kg/thm, 18.9 GJ/tcs and 1.8 tCO2/tcs.
2x3 grid of grouped vertical bar charts, each with a 'Good' direction arrow, under a three-entity color legend
India deliveries were 6.0 mn tons in 2QFY27 (5.4 domestic, 0.6 exports), against 5.2 in 1QFY27 and 5.6 in 2QFY26. The end-use split was Auto 24%, Retail 21%, Construction & Infra 20%, Engineering & Packaging 17%, Trade & Commercial 8% and Exports 10%.
Left stacked bar chart of deliveries; centre end-use split table; right four mini bar charts by segment (Auto, Retail, Construction, Engineering & Packaging)
High-end auto sales grew 26% YoY, and sales from the TSK CAL and CGL lines rose ~6x YoY. New products include CR IFHS340 approval for skin panels from a marquee PV OEM, chrome-free GA for 2W fuel tanks, and small-diameter bars for suspension and transmission.
Left large cutaway SUV image with two small capability callouts; right a value-play bar chart and growth arrow above four product photos
Branded volumes rose 17% QoQ and 11% YoY. TISCON sold 2.75 mn tons with ~$1.8 billion revenue, growing 13% YoY and serving ~500,000 customers, with double-digit growth in ~78% of districts. Digital GMV rose 35% QoQ and 50% YoY; retail brands grew 49%, 40% and 18% YoY.
Three columns: stacked bar chart (MSME/Retail), India district heat map with TISCON callouts, and digital GMV bar chart; brand logo strip along the bottom
In 2QFY27 Standalone produced 5.91 mn tons and delivered 5.98 mn tons, up 16% QoQ, with revenue of Rs 42,535 crores, up 15% QoQ. EBITDA was Rs 10,315 crores (Rs 17,257/t, against 18,198 in 1QFY27) and reported PAT was Rs 5,054 crores, against 4,535 in 1QFY27 and 4,060 in 2QFY26.
Left three-column P&L table; right shaded Key drivers panel
TSN produced 1.52 mn tons of liquid steel and delivered 1.30 mn tons, with revenue of Rs 15,330 crores. EBITDA recovered to Rs 790 crores (Rs 6,062/t) from Rs 39 crores in 1QFY27 after the Direct Sheet Plant restart, against Rs 916 crores in 2QFY26.
Left three-column operating P&L table down to EBITDA per ton; right Key drivers panel
TSUK had no liquid steel production. Deliveries fell 22% QoQ to 0.38 mn tons and revenue was Rs 5,275 crores. EBITDA was a loss of Rs 719 crores (Rs -19,027/t), against losses of 341 in 1QFY27 and 765 in 2QFY26, blamed on weak demand and supply-chain destocking around trade measures effective 1 July 2026.
Left three-column operating P&L table; right Key drivers panel
Closing slide celebrating Tata Steel's 120th Foundation Day, with investor relations contact ir@tatasteel.com for investor enquiries.
Full-bleed illustrative image with large '120th Foundation Day' typography, and a translucent contact panel at lower right
このスライドと基礎となるプレゼンテーションコンテンツに関する一般的な質問。
It covers the financial quarter ended 30 September 2026. Tata Steel follows India's April–March fiscal year, so Q2 FY27 (written 2QFY27 in the deck) means July–September 2026. Most tables compare it with 1QFY27 (April–June 2026) and 2QFY26 (July–September 2025).
Consolidated revenue from operations was Rs 65,436 crores. EBITDA was Rs 10,665 crores (Rs 13,462 per ton) and reported PAT was Rs 3,700 crores. Production was 8.07 mn tons and deliveries were 7.92 mn tons. Net debt stood at Rs 91,423 crores, with net debt/EBITDA of 2.39x.
Tata Steel Ltd filed it with BSE/NSE on 7 November 2026, along with its quarterly results. The exchange cover letter pages have been removed; the 30 slides here are the results presentation itself.
Financials are in Indian rupees, mostly 'Rs crores' (1 crore = 10 million), with Indian digit grouping such as 1,02,368. Volumes are in million tons and capacity in MTPA. Some items use other currencies: TISCON revenue (~$1.8 billion), coking coal prices ($/t), and UK and Netherlands project costs (£ and €).
Standalone (India) EBITDA was Rs 10,315 crores on deliveries of 5.98 mn tons, up 16% QoQ. Tata Steel Netherlands EBITDA recovered to Rs 790 crores from Rs 39 crores after the Direct Sheet Plant restart. Tata Steel UK posted negative EBITDA of Rs 719 crores, as deliveries fell 22% QoQ during its transition to an EAF.
India capacity is 27.4 MTPA and is planned to reach ~40 MTPA. Projects include the 4.8 MTPA NINL expansion (Rs 33,873 crores), a 2.5 MTPA thin slab caster at Meramandali and a 5 MTPA plant in Maharashtra. On decarbonisation, Tata Steel targets Net Zero by 2045 and is building a ~3 MTPA UK EAF costing £1.25 billion (with £500 million of UK Government funding).
Yes, as a structural reference. It shows a complete results-deck flow: safety and ESG, strategy, credit metric dashboards, P&L tables with key-driver panels, EBITDA and net debt waterfalls, operating KPI grids and segment spotlights. Replace Tata Steel's figures, logos and photos with your own.
Equity and credit analysts covering Indian steel, Tata Steel investors, IR and finance teams designing quarterly decks, and students researching the steel industry or European steel decarbonisation will find it useful.

Create Your Own Slides
Turn your ideas into professional presentations in seconds with 2slides AI.
プロフェッショナルなデザインを参照し、スタイルを選択し、完璧なテキストレンダリングでスライドを生成。Nano Banana搭載—今すぐプレゼンテーションの作成を始めましょう。
© 2026 2slides。全著作権所有。


