
収録コレクション: 投資家向けプレゼン資料の実例 · インド企業のIR資料 実例集
Tata Consumer Products Q2 FY27 Earnings Presentation: the investor presentation for the quarter ended September 2026 (dated 26 October 2026), filed with BSE/NSE. Consolidated revenue rose 14% to ₹5,661 crore, EBITDA rose 18% to ₹794 crore at a 14.0% margin (+40 bps), and 'Growth businesses' grew 40% to reach 38% of the India business.
このスライドの表紙をスタイルの参考にして、ご自身の内容からスライドを作成します。 下のページから好きな1枚を選び、そのレイアウトを参考にすることもできます。
クイックナビゲーション
タグ
スライドを共有
Tata Consumer Products Q2 FY27 Earnings Presentation: the investor presentation for the quarter ended September 2026 (dated 26 October 2026), filed with BSE/NSE. Consolidated revenue rose 14% to ₹5,661 crore, EBITDA rose 18% to ₹794 crore at a 14.0% margin (+40 bps), and 'Growth businesses' grew 40% to reach 38% of the India business.
レイアウト、主要コンテンツ、視覚要素を含む各スライドページの詳細ビュー。
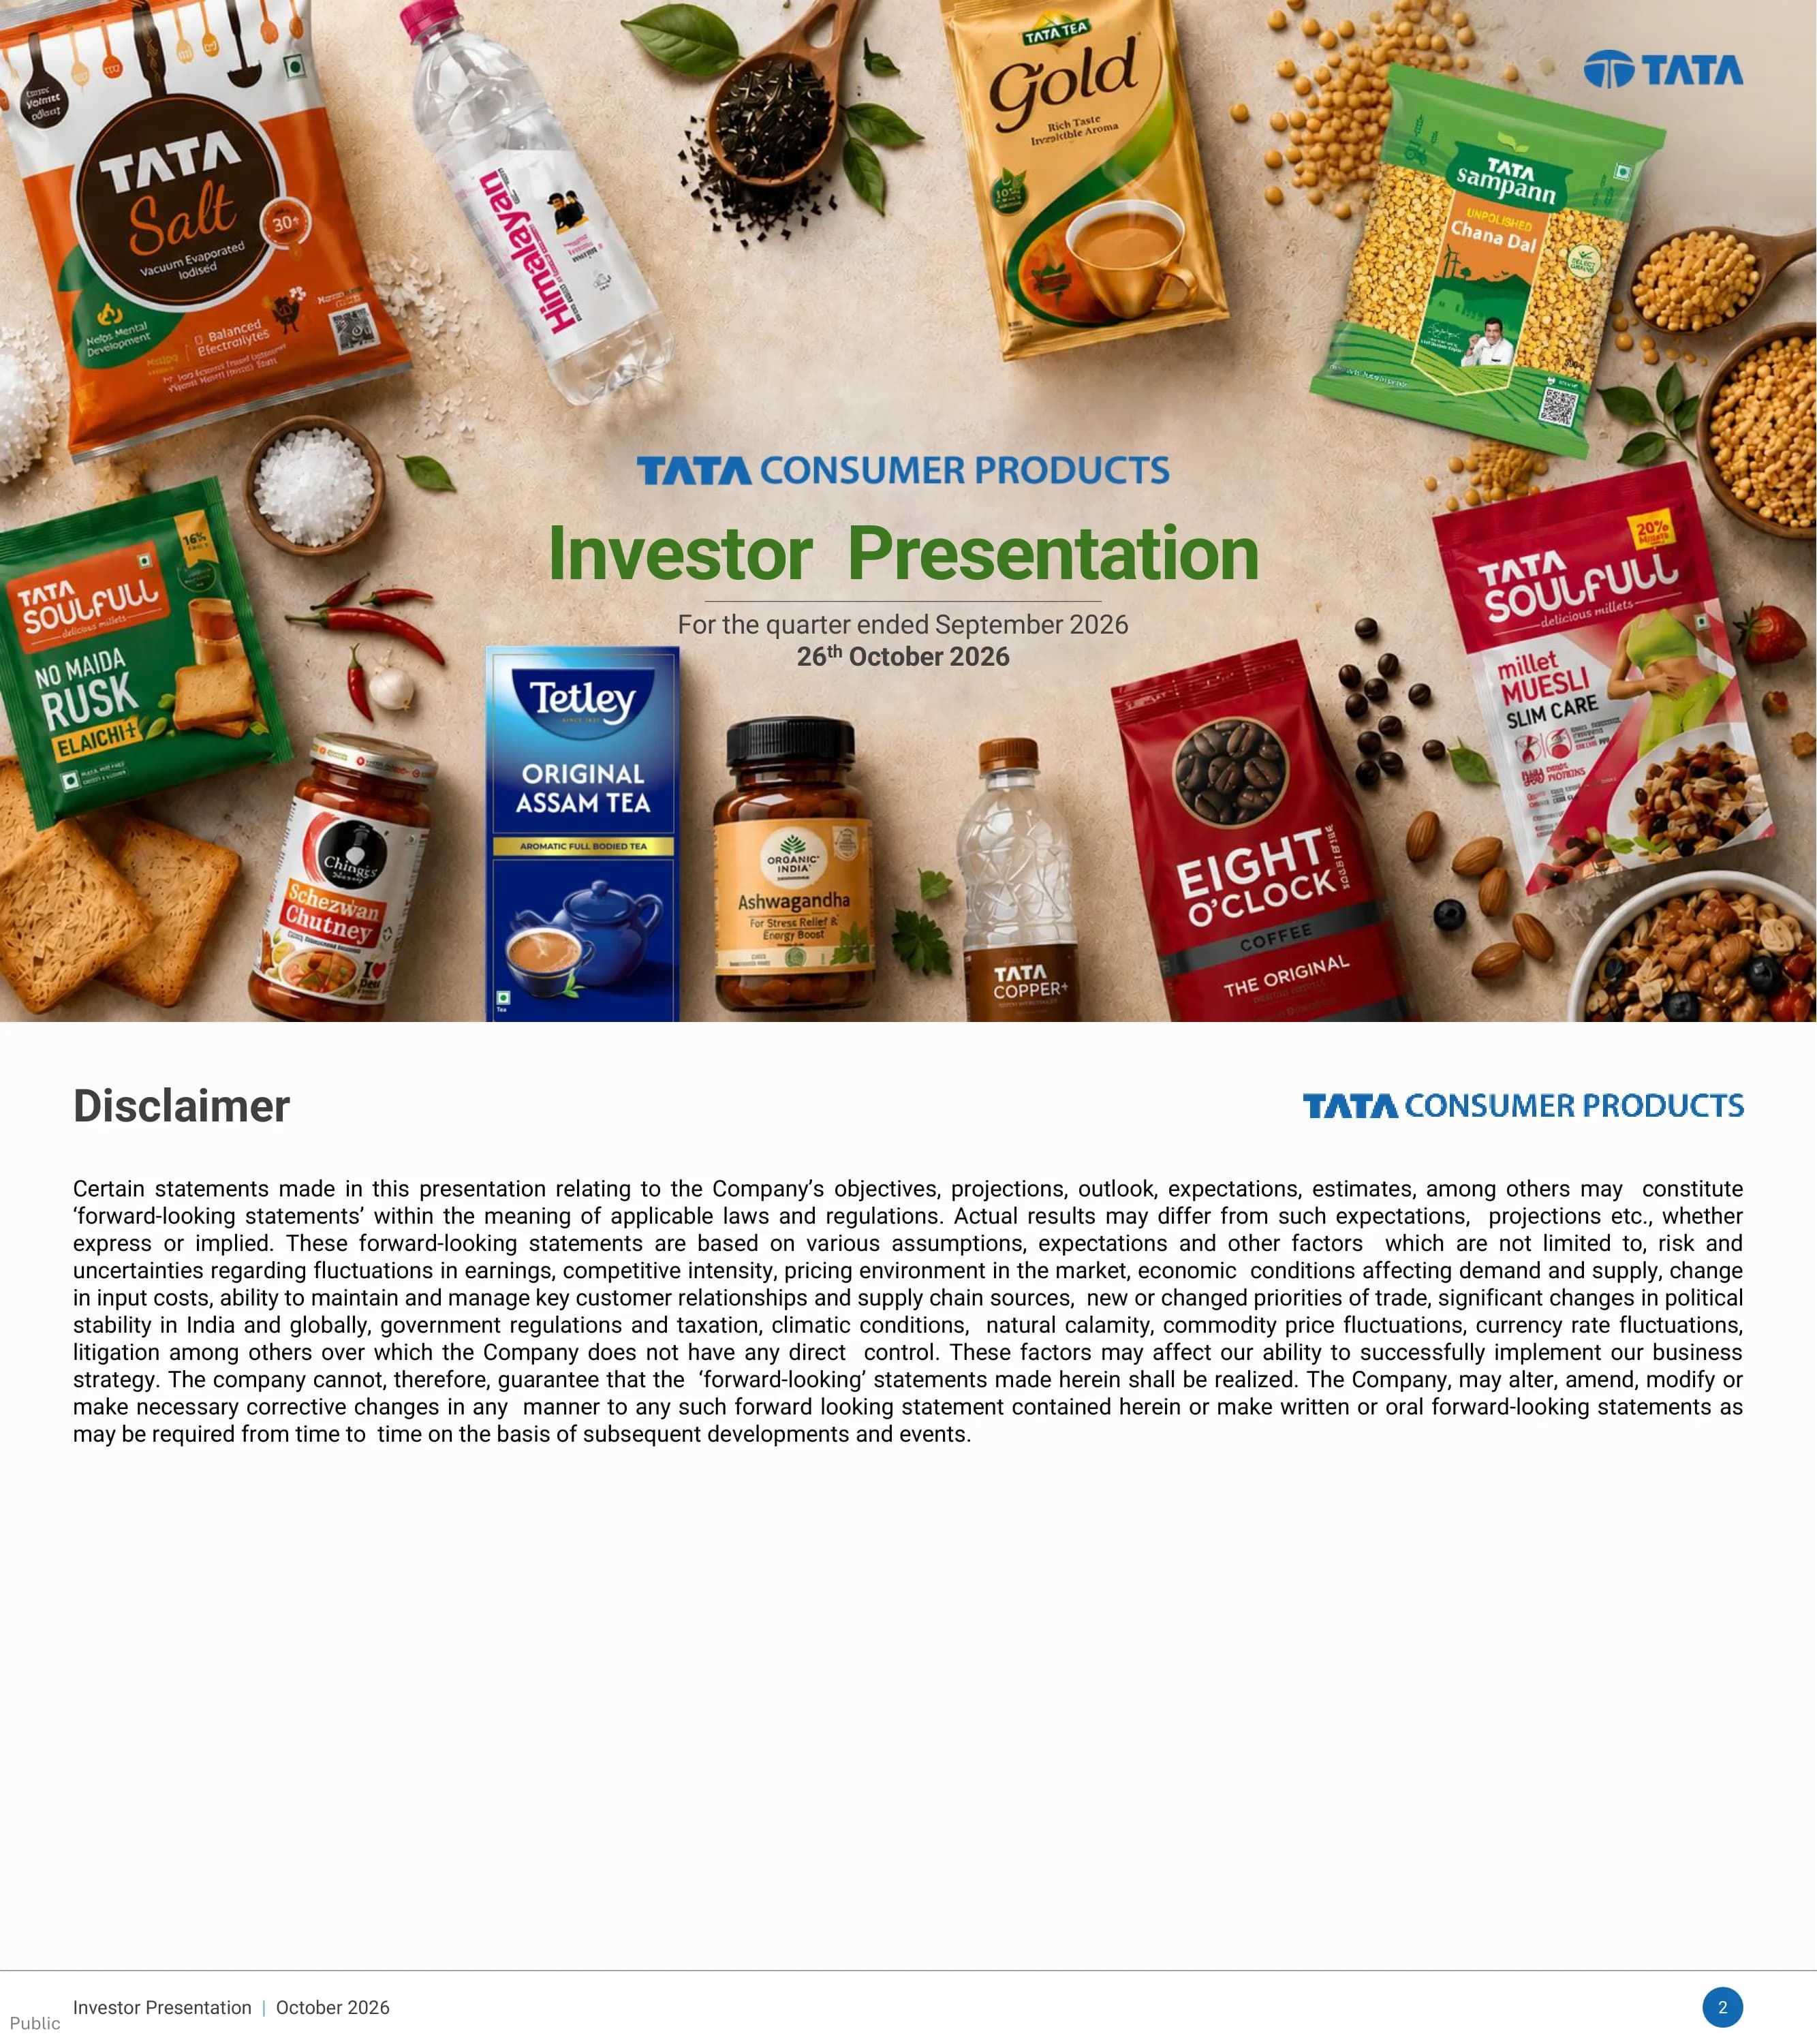
Cover slide: Tata Consumer Products Investor Presentation for the quarter ended September 2026, dated 26 October 2026.
Full-bleed flat-lay product photograph framing a centred title block; Tata logo top right, company wordmark above a large green 'Investor Presentation' title and the date line below.
Standard forward-looking statements disclaimer listing risks such as input costs, competition, regulation, climate, commodity prices and currency fluctuations.
Single justified text block under a left-aligned title, with the logo top right and a footer strip carrying 'Investor Presentation | October 2026' and a blue page-number dot.
Company overview: largest salt brand in India, 2nd largest tea brand in India, 3rd largest tea brand in the UK and largest in Canada (Tetley), #1 natural mineral water brand in India (Himalayan), 4th largest R&G bags coffee brand in the USA (Eight O'Clock); #2 branded tea player globally, reach of 290mn households and 4.5mn retail outlets in India, among the top 10 FMCG companies in India, 10,000+ employees.
Dark green background; product shelf photograph across the top, a white card row of eight brand logos with one-line positioning each, and an 'In a Nutshell' row of six icon-led facts at the bottom.
Section divider introducing the CEO's business review: Sunil D'Souza, Managing Director & Chief Executive Officer.
Speaker divider: circular portrait photo on the left, name and title on the right with a blue vertical accent bar, over a soft peach watercolour background.
Q2 FY27 highlights: consolidated revenue +14% with India underlying volume growth of 11%; Salt volume +9% and revenue +15%; India Tea volumes flat with revenue marginally lower; Growth businesses +40% (Tata Sampann +57%, RTD +47%, Capital Foods and Organic India +15% combined, +24% domestic); International +7% (-2% constant currency); Non-branded +12% (9% CC); consolidated EBITDA +18% with margin up 40 bps to 14%; Tata Starbucks revenue +15%, a multi-quarter high with strong same-store sales growth.
Two columns of four and four icon-led statements separated by thin rules, blue circular icons, with a product cluster (Organic India, Himalayan, Tata Tea Gold, Tata Salt, Sampann) and flying tea leaves on the right.
Q2 FY27 revenue in ₹ crore: India Salt 1,099 (+15%); India Tea/Coffee 1,244 (-1%); Growth Businesses 1,438 (+40%); International 1,256 (+7%, -2% CC); Non-Branded 659 (+12%, 9% CC); Consolidated 5,661 (+14%, 11% CC).
Six equal KPI cards in a row, each with a coloured circular icon on top, business name, a ringed revenue figure and green/red arrow growth indicators, with a CC column where relevant.
H1 FY27 revenue in ₹ crore: India Salt 2,189 (+11%); India Tea/Coffee 2,478 (-3%); Growth Businesses 2,752 (+43%); International 2,501 (+11%, 0% CC); Non-Branded 1,156 (+3%, 0% CC); Consolidated 11,010 (+13%, 10% CC).
Same six-card KPI layout as the Q2 snapshot with an H1 FY27 tab label, keeping the comparison visually identical.
Q2 FY27 in ₹ crore: revenue 5,661 (+14%); EBITDA 794 (+18%, 14.0% margin); PBT before exceptional items 632 (+21%, 11.2% margin); net profit 470 (+16%, 8.3% margin); EPS ₹4.75; adjusted EPS ₹5.18 (adjusted for exceptional items and amortisation of Capital Foods and Organic India).
Six KPI cards matching the business snapshot style, each with an icon, ringed headline number and a growth/margin split below.
H1 FY27 in ₹ crore: revenue 11,010 (+13%); EBITDA 1,523 (+18%, 13.8% margin); PBT (bei) 1,224 (+24%, 11.1% margin); net profit 897 (+22%, 8.2% margin); EPS ₹9.06; adjusted EPS ₹9.85.
Identical six-card layout to the Q2 summary with an H1 FY27 tab.
Six strategic priorities: strengthen core and accelerate growth businesses; build on new opportunities; drive execution excellence every day; create a future-ready organization; drive digital and innovation; embed sustainability.
Six blue icon-and-label pillars across the top with thin connector lines dropping into a pencil-sketch landscape (city, fields, wind turbines) and a row of hero products on a wooden table.
Brand-building examples (Tata Simply Better hexane-free cold-pressed oils, Tata Soulfull campaign, Tata Tea Gold Reserve ad) with India business A&P-to-sales of 5.5% in Q2 FY27 and 5.8% in H1 FY27.
Strategy-pillar pill tag at top left; collage of three campaign images on the left and centre, a navy KPI panel on the right showing the A&P ratio for two periods.
Growth businesses grew 40% YoY and their share of the India business rose from 8% (FY21) to 10% (FY22), 15% (FY23), 18% (FY24), 28% (FY25) and 31% (FY26); 32% in Q2 FY26 versus 38% in Q2 FY27. Brands shown: Tata Sampann, Ching's, Organic India, Tata Gluco+, Tata Copper+, Tata Soulfull, Himalayan, Tata MyBistro, Smith & Jones.
Large circular progress gauge with 40% on the left, a bar chart of share by year on the right (latest bars in dark blue), and a white strip of nine brand logos below.
AI initiatives: Saathi AI sales companion for general trade; AI voice agent for retailer ordering in local languages; TSE Calling AI coach for sales supervisors; Physical AI with computer vision for tea fine-leaf grading and Himalayan on-line bottle inspection; a pipeline including smart sourcing, agentic invoice validation and payment, AI-led consumer insights, trade spend optimizer and GT beat frequency optimizer. Underpinned by an 'Enterprise Collective Brain' of unified data and ontology, enterprise memory, AI reasoning and agents, and governance by design.
Five column cards grouped under Go-to-Market (teal), Operations (orange) and Project Pipeline (purple) headers, each with an icon, shaded subtitle and bullets; a dark navy foundation band across the bottom.
22 launches in the quarter grouped as Health & Wellness (Organic India seeds, Tata Gluco+ with iron, Tata ION, Simply Better high-fibre khapli flour), Convenience (Tata Tea Gold instant chai premixes, Smith & Jones pasta masala variants) and Premiumization (Simply Better Bilona A2 and cultured cow ghee, Tata Soulfull ChaBites millet rusk and khari).
Three bordered panels side by side with titles and circular theme icons on the panel edges, each filled with product pack shots.
India tea volumes were flat YoY with subdued category demand; revenue declined 1% as pricing actions narrowed the volume-value gap; launched Tata Tea Gold Reserve, Chakra Gold Select and Kanan Devan Gold for premiumization.
Atmospheric tea-estate sunrise photograph with tea packs at left; three white callout bars with brown-ringed cup icons on the right; a two-metric panel (volume, revenue) at the bottom.
Salt revenue grew 15% with 9% volume growth despite a price increase; further price increases were actioned in October; value-added and premium salt volumes grew 17%.
Callout bars with salt-shaker icons on the left, a stacked display of Tata Salt variants (Iron Health, Panch Tatva, Himalayan Rock Salt, Crystal, Immuno, 2-in-1 Shakti, Lite, Gourmet) on the right, and a volume/revenue panel at the bottom.
Tata Sampann (including the Tata Simply Better sub-brand) delivered 57% volume-led revenue growth; dry fruits and cold-pressed oils reached a combined ARR of about ₹1,000 crore; consumer-centric innovation drives growth and margin expansion.
Product imagery on the left (cold-pressed oils, biryani masala mixes, grains); three blue-icon callouts on the right; a pale-blue revenue panel with +57%.
RTD revenue grew 47% on 34% volume growth, broad-based across the portfolio; introduced Tata Gluco Plus with added iron in a ₹20 PET bottle and Tata ION, a functional electrolyte drink.
Five beverage bottles on a wooden table (Tata ION, Gluco+, Tata Lyfe alkaline water) against a sky background; three callouts on the right; volume/revenue panel at the bottom.
Capital Foods grew 18% and Organic India 9%; domestic performance was strong (+24% combined) while exports were hit by shipping disruptions; Capital Foods' innovation-to-sales (i2S) is 10%. Q2 revenue: Capital Foods ₹264 crore, Organic India ₹145 crore.
Ching's Secret, Smith & Jones and Organic India packs on a stone surface, three callout bars at left and a two-figure revenue panel at the bottom.
International revenue grew 7% (-2% constant currency) against a high base; US +4% CC led by 6% CC coffee growth; UK -8% CC as a heatwave hit tea consumption though Tetley outperformed the category; Canada +8% CC; South Africa launched instant Matcha Latte variants (Vanilla, Strawberry, Lemon Cream).
Product still life on the left (Eight O'Clock, Good Earth, Tetley camomile and matcha latte packs); five globe-icon callouts on the right with bold market names; revenue and CC revenue panel at the bottom.
Non-branded revenue grew 9% in constant currency on an elevated base, led by solubles; solubles volumes grew 21% and solubles revenue 23% (CC); softer Arabica and Robusta prices cut plantations revenue by 11%.
Three coffee-bean-icon callouts on the left; two stacked photographs on the right (Vietnam solubles plant aerial with a red label, coffee plantation landscape); three-metric panel at the bottom.
Tata Starbucks revenue grew 15% on the fifth consecutive quarter of same-store sales growth; 7 net new stores took the network to 505 stores in 81 cities, including entry into Shillong and two new Reserve stores; Starbucks Rewards was simplified to drive engagement and frequency.
Collage of a store exterior and Starbucks menu posters on a green diagonal band at left with a splashing iced coffee; three cup-icon callouts on the right; three-metric panel at the bottom.
Section divider introducing the financial review by Ashish Goenka, Group Chief Financial Officer.
Same speaker-divider template as the CEO slide: circular portrait at left, name and title with blue accent bar at right on a peach background.
Revenue from operations ₹4,966 crore to ₹5,661 crore (+₹695 crore, +14%); EBITDA ₹675 crore to ₹794 crore (+₹119 crore, +18%, margin +40 bps); adjusted EPS ₹4.44 to ₹5.18 (+17%).
Three side-by-side two-bar charts (prior year light blue, current year dark blue) with dark label tabs, green delta arrows and green growth bubbles.
Revenue ₹9,745 crore to ₹11,010 crore (+₹1,265 crore, +13%); EBITDA ₹1,291 crore to ₹1,523 crore (+₹232 crore, +18%, margin +60 bps); adjusted EPS ₹8.17 to ₹9.85 (+21%).
Same three-chart layout as the Q2 highlights for the half-year.
Segment revenue (₹ crore, Q2 FY27 vs Q2 FY26): India 3,666 vs 3,122 (+17%); International 1,370 vs 1,288 (+6%); total branded 5,036 vs 4,410 (+14%); non-branded 659 vs 590 (+12%); total 5,661 vs 4,966 (+14%). Segment results: India 409 vs 359 (+14%), International 182 vs 148 (+23%), branded 591 vs 507 (+17%), non-branded 98 vs 76 (+28%), total 625 vs 523 (+19%). Segment margins: India 11.1% vs 11.5%, International 13.3% vs 11.5%, branded 11.7% vs 11.5%, non-branded 14.8% vs 12.9%, total 11.0% vs 10.5%.
Financial table with a blue group header (Segment Revenue, Results, Margin), green sub-header row of periods, row icons in beige circles at left, bold totals and heavy bottom rules.
H1 segment revenue (₹ crore, H1 FY27 vs H1 FY26): India 7,206 vs 6,248 (+15%); International 2,713 vs 2,433 (+12%); branded 9,919 vs 8,681 (+14%); non-branded 1,156 vs 1,126 (+3%); total 11,010 vs 9,745 (+13%). Segment results: India 803 vs 649 (+24%), International 357 vs 302 (+18%), branded 1,160 vs 951 (+22%), non-branded 147 vs 140 (+4%), total 1,217 vs 989 (+23%). Margins: India 11.1% vs 10.4%, International 13.2% vs 12.4%, total 11.1% vs 10.1%.
Identical segment table structure to the Q2 slide with H1 period columns.
Q&A slide showing the full Tata Consumer Products portfolio on a wooden table.
Minimal title top left with a wide product line-up photograph across the middle of the slide on a warm background.
Closing slide with institutional investor contacts (Nidhi Verma, Head – Investor Relations & Corporate Communication; Kaiwan Olia, Senior Manager – Investor Relations), retail investor and media contacts, phone number, a link to the last 10 years of historical financial data, and the company's website and social handles.
Large blue 'Thank You' title above a rule; contact blocks on the left, four blue circular social icons with handles on the right, and a vertical design-agency credit at the far right.
このスライドと基礎となるプレゼンテーションコンテンツに関する一般的な質問。
It is the 29-slide investor presentation for the quarter ended September 2026, dated 26 October 2026 and filed with BSE/NSE. It covers consolidated and half-year results, a business-by-business review (tea, salt, Tata Sampann, ready-to-drink, Capital Foods, Organic India, International, non-branded, Tata Starbucks), the company's AI programme, 22 new product launches and segment tables.
Consolidated revenue was ₹5,661 crore (+14%), EBITDA ₹794 crore (+18%) at a 14.0% margin (+40 bps), PBT before exceptional items ₹632 crore (+21%), net profit ₹470 crore (+16%), EPS ₹4.75 and adjusted EPS ₹5.18. For H1 FY27 revenue was ₹11,010 crore (+13%) and EBITDA ₹1,523 crore (+18%).
Indian companies use an April–March fiscal year, so FY27 runs from April 2026 to March 2027. Q2 FY27 is July–September 2026 and H1 FY27 is April–September 2026.
They are Tata Sampann, Ready-to-Drink, Tata Soulfull, Vending, Capital Foods (Ching's Secret, Smith & Jones) and Organic India, including overseas revenue. They grew 40% in Q2 FY27 and made up 38% of the India business, up from 8% in FY21.
Yes. Besides the original PDF, there is a PPTX version converted from the PDF, so you can edit the text, tables and layouts. It is a conversion, not the company's original source file, so some text boxes and images may need small adjustments.
The deck reports in Indian rupee crore, as Indian listed companies usually do. One crore equals 10 million, so revenue of ₹5,661 crore is about ₹56.6 billion. This page keeps the units exactly as the company reported them.
Useful layouts include the six-card KPI snapshot (slides 6–9), the growth-share bar chart with a circular gauge (slide 12), the colour-grouped AI initiative cards (slide 13), the callout-plus-metric-panel business slides (slides 15–22), the two-bar year-over-year charts (slides 24–25) and the segment tables (slides 26–27).
The presentation was filed with the stock exchanges (BSE/NSE) alongside the quarterly results. Tata Consumer Products also publishes its results, presentations and historical financial data in the investors section of tataconsumer.com.
Official investor relations page with quarterly results, presentations and historical financial data.

Create Your Own Slides
Turn your ideas into professional presentations in seconds with 2slides AI.
プロフェッショナルなデザインを参照し、スタイルを選択し、完璧なテキストレンダリングでスライドを生成。Nano Banana搭載—今すぐプレゼンテーションの作成を始めましょう。
© 2026 2slides。全著作権所有。


