
収録コレクション: 投資家向けプレゼン資料の実例
Spotify Q3 2026 Update (Q3 2026 earnings presentation) shareholder deck dated October 22, 2026, filed with the SEC as an exhibit to Form 6-K
このスライドの表紙をスタイルの参考にして、ご自身の内容からスライドを作成します。 下のページから好きな1枚を選び、そのレイアウトを参考にすることもできます。
クイックナビゲーション
タグ
スライドを共有
Spotify Q3 2026 Update (Q3 2026 earnings presentation) shareholder deck dated October 22, 2026, filed with the SEC as an exhibit to Form 6-K
レイアウト、主要コンテンツ、視覚要素を含む各スライドページの詳細ビュー。
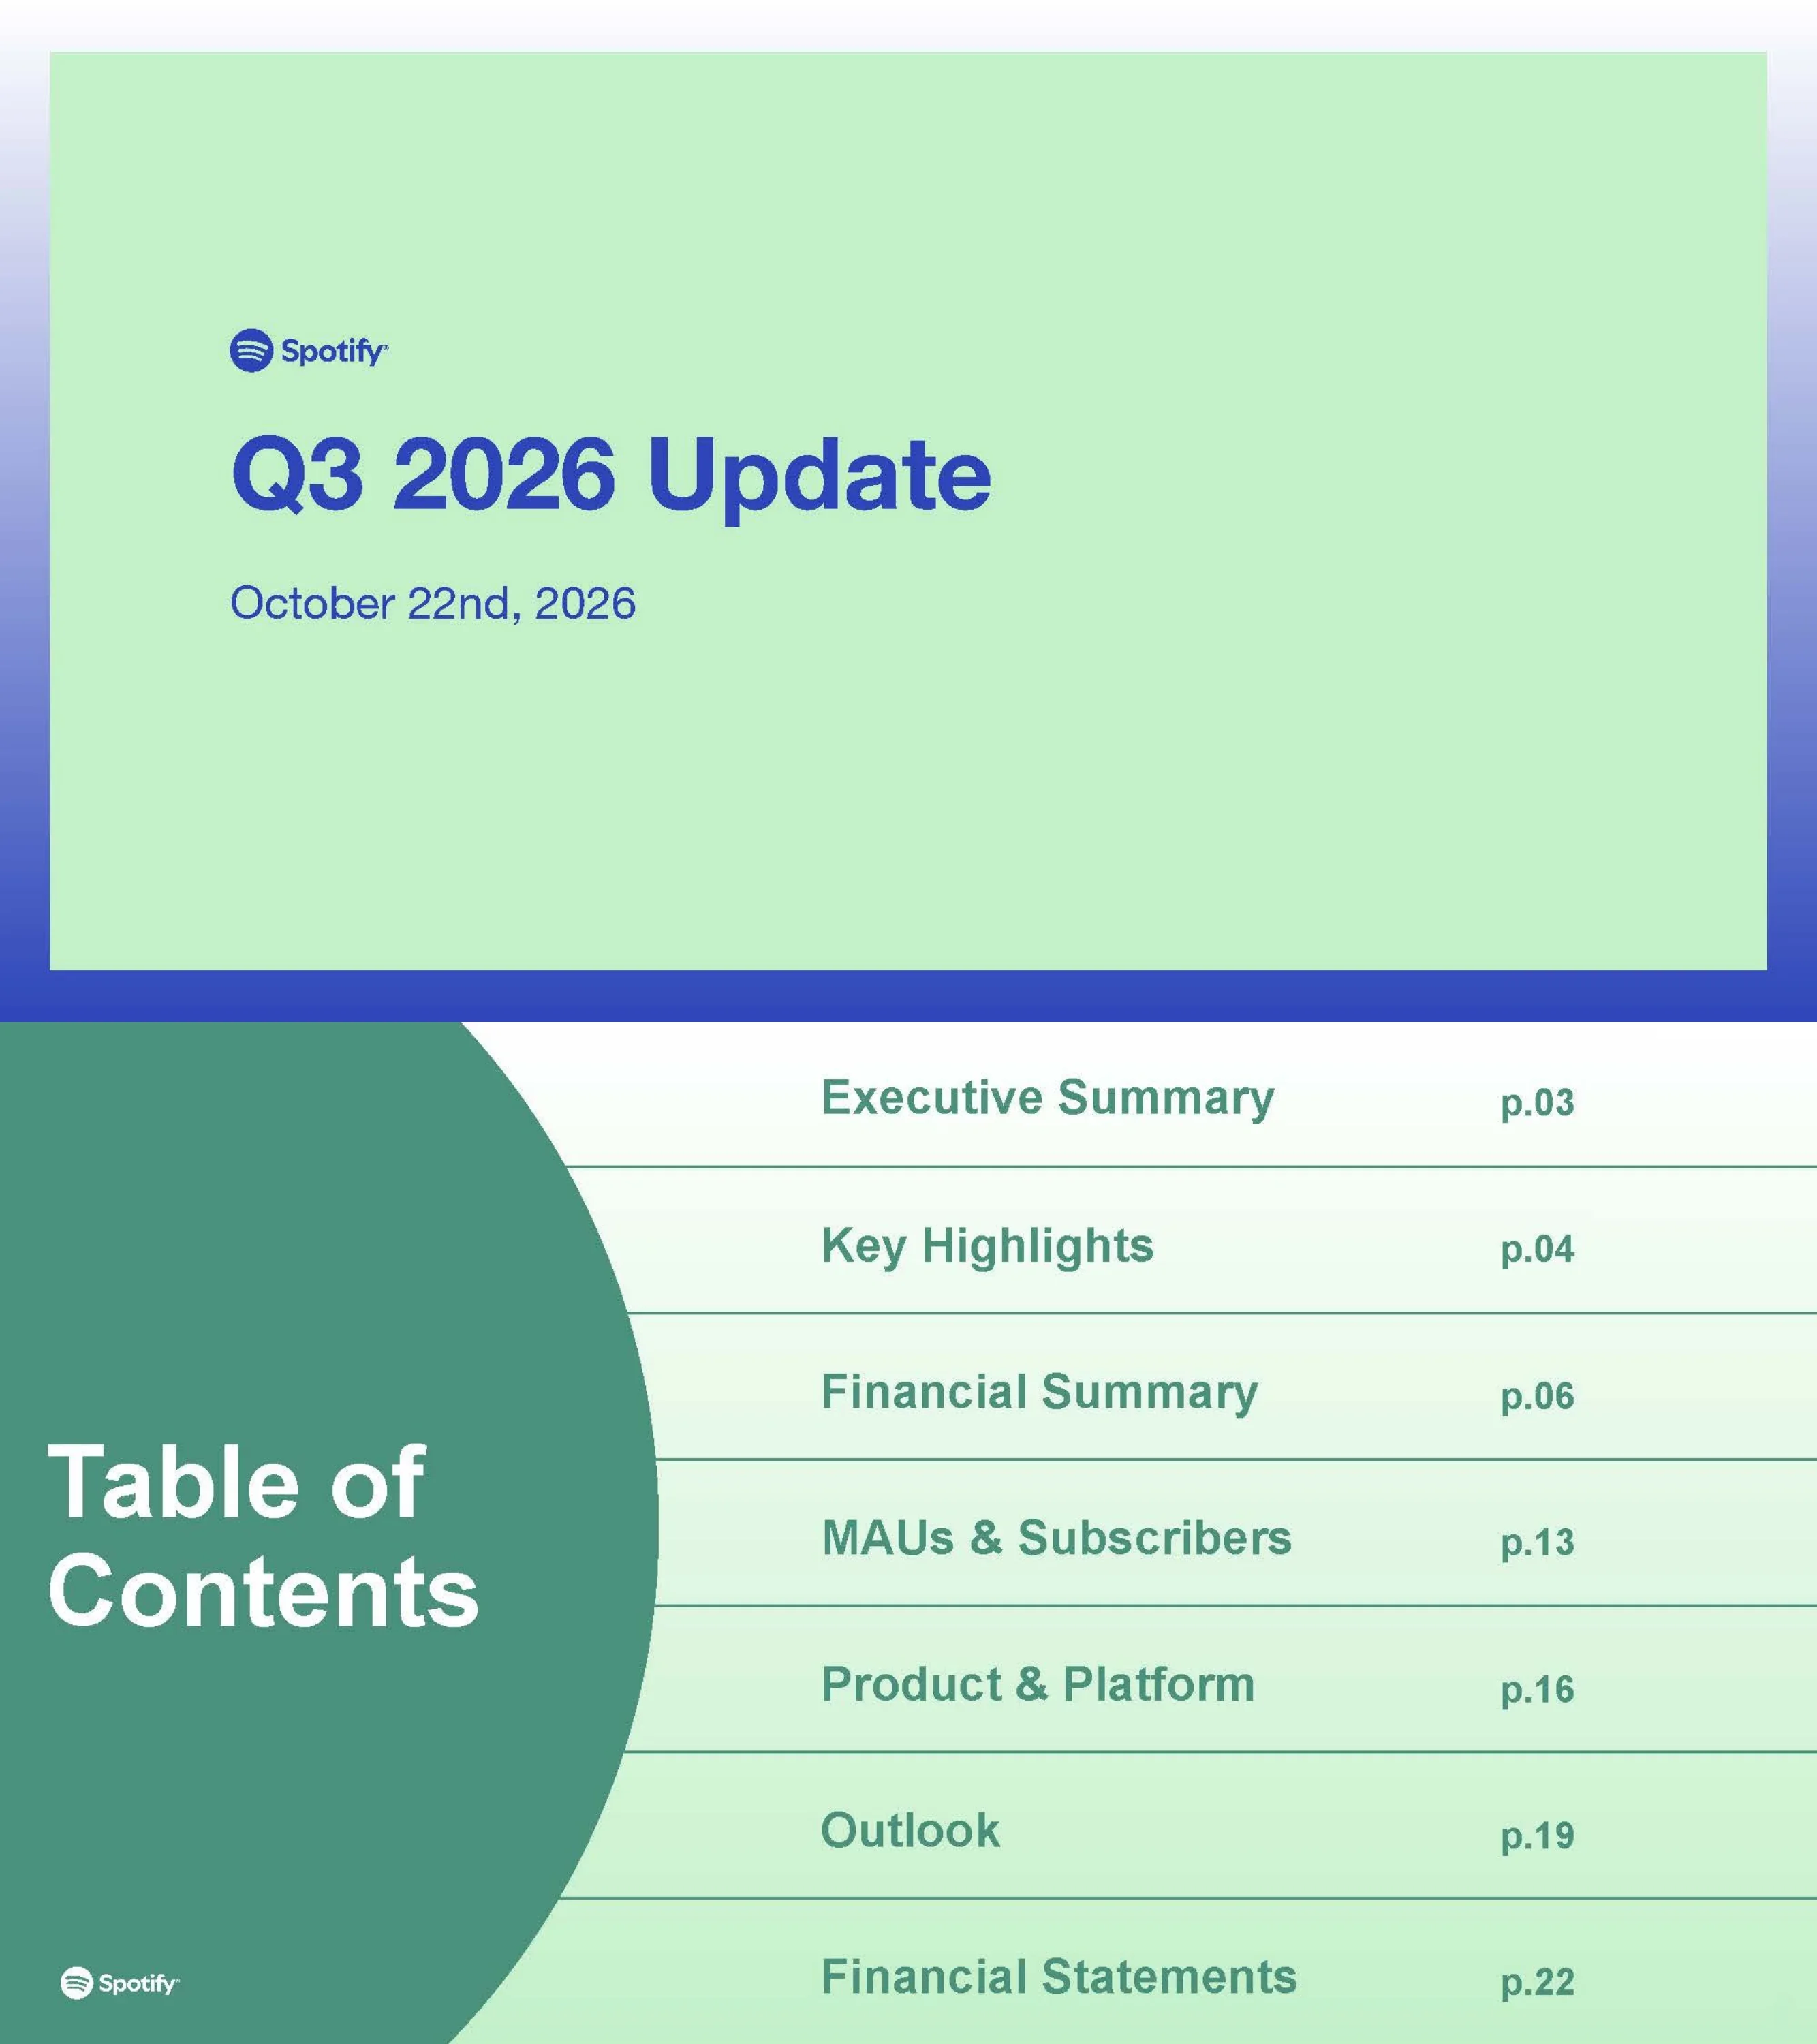
Title slide: Spotify Q3 2026 Update, dated October 22nd, 2026.
Left-aligned Spotify logo, large blue title and date on a mint-green panel with a blue gradient frame.
Agenda listing seven sections with page numbers: Executive Summary p.03, Key Highlights p.04, Financial Summary p.06, MAUs & Subscribers p.13, Product & Platform p.16, Outlook p.19, Financial Statements p.22.
Large dark-green semicircle with the title on the left, seven ruled rows of section names and page numbers on the right.
Narrative says all KPIs met or exceeded guidance: MAUs added 11 million, Subscriber net adds of 6 million (1 million ahead), Revenue up 14% Y/Y constant currency, Gross Margin 33.0% (up 136 bps Y/Y), Operating Income EUR 672 million, Social Charges EUR 22 million, Free Cash Flow EUR 735 million and LTM Free Cash Flow EUR 3.2 billion. The summary table compares Q3 2025, Q2 2026 and Q3 2026: MAUs 713M/777M/788M (+11% Y/Y), Premium Subscribers 281M/300M/306M (+9%), Ad-Supported MAUs 446M/494M/499M (+12%), Premium revenue EUR 3,835M/4,331M/4,487M (+17%), Ad-Supported EUR 437M/446M/482M (+10%), Total Revenue EUR 4,272M/4,777M/4,969M (+16%), Gross Profit EUR 1,639M, Gross Margin 33.0%, Operating Income EUR 672M, Operating Margin 13.5%, Free Cash Flow EUR 735M (-9% Y/Y). Footnotes explain non-IFRS measures, the January 1, 2026 segment reclassification and LTM.
Left column of narrative text, right column KPI table with blue header row and the Q3 2026 column outlined; footnotes at bottom.
Three columns. Subscriber outperformance: Premium Subscribers up 9% Y/Y to 306 million (6 million net adds), MAUs up 11% Y/Y to 788 million (11 million net adds), growth across all regions. Mid-teens revenue growth with improving profitability: Total Revenue EUR 5.0 billion, +16% Y/Y or +14% constant currency, record Q3 Gross Margin 33.0%, Operating Income EUR 672 million (13.5% margin), Free Cash Flow EUR 735 million. Scaling personalized experiences: Taste Profile for Premium Subscribers in the U.S., Creator Memberships and Spotify Partner Program expansion to 35+ new markets in October, audiobooks expanding from 22 markets to more than 180 by year-end 2026 with 350,000+ titles in 120+ languages.
Three equal text columns each with a blue heading and bullet list.
Two tables compare Q3 2026 actuals with guidance. Users: MAUs 788M vs 788M (in-line), Premium Subscribers 306M vs 305M (above). Financials: Total Revenue EUR 5.0B vs EUR 5.0B (in-line), Gross Margin 33.0% vs 32.9% (above), Operating Income EUR 672M vs EUR 670M (above). Footnote: includes EUR 22 million of Social Charges, EUR 13 million above forecast due to share price movement.
Two circular labels (Users in blue, Financials in green) with dotted-line tables of Results, Actuals and Guidance.
Section divider slide introducing the financial summary section of the deck.
Large uppercase title split across two coloured blocks at lower left.
Five-quarter table (Q3 2025 to Q3 2026) with Y/Y and Y/Y constant currency columns. MAUs 713/751/761/777/788M; Premium Subscribers 281/290/293/300/306M; Ad-Supported MAUs 446/476/483/494/499M. Total Revenue EUR 4,272/4,531/4,533/4,777/4,969M (+16% Y/Y, +14% FXN); Gross Profit EUR 1,639M Q3 2026 (+21%); Gross Margin 33.0%; Total Operating Expenses EUR 967M (+26%); Operating Income EUR 672M (+15%, +12% FXN); Operating Margin 13.5%; Net cash flows from operating activities EUR 740M; Free Cash Flow EUR 735M (-9%); cash, restricted cash and short-term investments EUR 9.9 billion.
Full-width table with blue header, grouped sections (Users, Financials, Free Cash Flow & Liquidity) and highlighted Q3 2026 column.
Revenue EUR 4,969 million up 16% Y/Y (14% constant currency); Premium revenue +17% (+15% FXN) driven by subscribers and ARPU, Ad-Supported +10% (+9% FXN); currency added ~190 bps vs ~200 bps guided. Gross Margin 33.0%, up 136 bps Y/Y. Operating Income EUR 672 million, with Operating Expenses lifted by marketing and cloud/AI spend and EUR 22 million Social Charges; workforce of 7,284 full-time employees. Free Cash Flow EUR 735 million; EUR 9.9 billion liquidity.
Three horizontal bands (Revenue, Profitability, Free Cash Flow & Liquidity) separated by dotted rules, blue labels left and text right.
Premium revenue grew 17% Y/Y to EUR 4,487 million (15% constant currency) on 9% subscriber growth and Premium ARPU of EUR 4.95, up 9.3% Y/Y (7.5% constant currency), helped by price increases. Ad-Supported revenue grew 10% Y/Y (9% constant currency); music advertising driven by impressions sold, podcasting by sponsorship gains, automated channels the largest contributors. Two charts: Premium revenue LTM (EUR M) bars with Premium ARPU FXN line (Q4'23 to Q3'26), and Ad-Supported revenue LTM bars with Auction-Based Revenue % of Ad-Supported line.
Left text blocks with blue headings, right two stacked combination bar-and-line charts, footnotes below.
Total Gross Margin 33.0% in Q3 (up 136 bps Y/Y); Premium Gross Margin 34.5% (up 130 bps); Ad-Supported Gross Margin 18.7% (up 105 bps). Three bar charts cover Q3'22 to Q3'26 with the latest bar highlighted in violet. Drivers: revenue growth outpacing music, audiobook and video podcast costs; podcast cost structure and other costs of revenue.
Three side-by-side bar charts, each with a caption paragraph underneath.
Operating Expenses rose ~26% Y/Y; excluding FX and Social Charges the increase was 19%, driven by marketing and cloud/AI spend. Social Charges explanation: EUR 22 million this quarter, EUR 13 million above forecast; prior-year Q3 included (EUR 16) million. Charts: Operating Expense Trends (LTM opex in EUR M bars, with opex as % of revenue line ending at 19%) and a waterfall of Y/Y items: total 25.7%, FX movements -1.4%, Social Charges -5.4%, all other expenses 19.0%.
Left explanatory text, right bar-and-line trend chart over a waterfall chart.
Free Cash Flow EUR 735 million, with capital expenditures down EUR 17 million Y/Y to EUR 6 million. LTM Free Cash Flow reached EUR 3.2 billion; cumulative EUR 9.5 billion since 2016; EUR 9.9 billion cash and investments. USD 1.1 billion of shares repurchased year-to-date through October 21st, fully neutralizing 2026 employee equity dilution; approximately 3 million shares (~1.5% of shares outstanding) bought back since August 2025. Charts: LTM Free Cash Flow and cumulative Free Cash Flow since 2016, Q4'23 to Q3'26.
Left text paragraphs, right two stacked bar charts with the latest bar in violet.
Section divider slide introducing the maus & subscribers section of the deck.
Title split across a white block at top left and a mint block at bottom right.
Total MAUs grew 11% Y/Y to 788 million, up from 777 million last quarter and in line with guidance, with Y/Y and Q/Q growth in all regions. Stacked bars Q3'22 to Q3'26: 456M, 574M, 640M, 713M, 788M. Q3'26 regional mix: Europe 25%, North America 16%, Latin America 21%, Rest of World 38%.
Left title and bullets, right mint panel with a stacked column chart and legend.
Premium Subscribers grew 9% Y/Y to 306 million, up from 300 million and 1 million above guidance, with growth in all regions driven by promotional campaigns and partnerships. Stacked bars Q3'22 to Q3'26: 195M, 226M, 252M, 281M, 306M. Q3'26 mix: Europe 36%, North America 25%, Latin America 24%, Rest of World 15%.
Left title and bullets, right mint panel with a stacked column chart and legend.
Section divider slide introducing the product & platform section of the deck.
Title split across a white block and a mint block.
Audiobooks on Spotify going global, from 22 markets to more than 180 by end of 2026 with 350,000+ titles in 120+ languages; Spotify Partner Program expanded to more than 35 new markets including Italy, Spain, Brazil, Mexico, Poland and Colombia; Creator Memberships launched in 34 markets for podcast creators to offer paid memberships.
Dark-green slide with three image cards above three bold-lead captions.
Managed Accounts available to families in the U.S., U.K., Australia, France, Germany and the Netherlands for listeners 13 and under; Taste Profile launched to Premium Subscribers in the U.S. with an editable view of how Spotify understands taste; Spotify integration with Muse enabling AI agent conversations to play music, save songs and build playlists.
Dark-green slide with three visuals (app screens, Taste Profile Beta graphic, mascot) above captions.
Section divider slide introducing the outlook section of the deck.
Title in a mint block on a blue background.
Forward-looking expectations as of October 22, 2026: Total MAUs 818 million (about 30 million net adds), Total Premium Subscribers 316 million (about 10 million net adds), Total Revenue EUR 5.2 billion (assumes ~230 bps FX tailwind vs ~190 bps in Q2; USD:Euro 0.8828 at September 30, 2026), Gross Margin 33.8%, Operating Income EUR 820 million (includes EUR 6 million Social Charges at Q3 close share price of USD 487.38).
Dotted-line table of metric, guidance value and explanatory note.
Text-only legal slide: live Q&A webcast at 8:00 a.m. ET on investors.spotify.com with Co-CEOs Alex Norstrom and Gustav Soderstrom and CFO Christian Luiga; use of non-IFRS measures (FX-excluded revenue, gross profit, operating income and expense, and Free Cash Flow); forward-looking statements and risk factors referencing the Form 20-F filed February 10, 2026; rounding note. Small print is dense but legible.
Full-page dense text blocks with bold headings and Spotify logo bottom left.
Section divider slide introducing the financial statements section of the deck.
Title in a mint block at top left and a white block at bottom right.
Three charts Q4'23 to Q3'26: MAUs column chart (axis 400 to 800M), area chart of Ad-Supported Users versus Premium Subscribers (M), and stacked columns of LTM Ad-Supported and Premium revenue (EUR M, up to about EUR 18,500M).
Three charts in a row with legends and footnotes.
Three charts Q4'23 to Q3'26: LTM Ads and Premium Gross Profit stacked columns (up to roughly EUR 6,000M+), LTM gross margin lines for Premium, Ad-Supported and Total (axis 0% to 40%), and LTM Free Cash Flow columns (up to about EUR 3,200M).
Three charts in a row with legends and footnotes.
Unaudited, EUR millions, three months ended Sept 30, 2026 / June 30, 2026 / Sept 30, 2025: Revenue 4,969/4,777/4,272; Cost of revenue 3,330/3,181/2,921; Gross profit 1,639/1,596/1,351; R&D 417/403/309; S&M 406/390/349; G&A 144/148/111; Operating income 672/655/582; Net income attributable to owners 518/545/899; basic EPS 2.52/2.65/4.36; diluted EPS 2.48/2.61/3.28.
Full-width financial statement table with shaded alternate rows.
Unaudited, EUR millions, September 30, 2026 vs December 31, 2025: Goodwill 1,118 / 1,083; Short term investments 3,856 / 4,209; Cash and cash equivalents 6,032 / 5,258; Total non-current assets 3,413 / 4,519; Total current assets 10,899 / 10,496; Total assets 14,312 / 15,015; Equity attributable to owners 8,741 / 8,329; Total liabilities 5,571 / 6,686; Exchangeable Notes nil vs 1,458.
Full-page balance sheet table, assets then equity and liabilities.
Unaudited, EUR millions, three months ended Sept 30, 2026 / June 30, 2026 / Sept 30, 2025: Net income 518/545/899; share-based compensation 87/86/75; net cash flows from operating activities 740/816/829; net cash used in investing (354)/62/(438); repurchases of ordinary shares (313)/(232)/(58); net cash used in financing (305)/(218)/(100); cash at period end 6,032/5,938/5,456.
Full-page cash flow table with operating, investing and financing sections.
Unaudited. Net income attributable to owners 518/545/899 (EUR M); weighted-average basic shares 205,718,815/205,788,241/205,964,504; basic EPS 2.52/2.65/4.36; diluted weighted-average shares 208,578,748/208,858,469/213,789,735; diluted EPS 2.48/2.61/3.28; prior-year diluted calculation includes fair value gains on Exchangeable Notes of (197).
Basic and diluted EPS tables in the upper half of the page.
Q3 2026 IFRS revenue EUR 4,969M, FX effect (81), revenue excluding FX 4,888M; +16% IFRS and +14% ex-FX Y/Y. Premium 4,487M, FX (74), 4,413M (+17%, +15%). Ad-Supported 482M, FX (7), 475M (+10%, +9%). Gross profit 1,639M, FX (30), 1,609M (+21%, +19%).
Two stacked reconciliation tables.
Operating expense EUR 967M, FX (11), 956M ex-FX (+26% IFRS, +24% ex-FX); R&D 417M, FX (5), 412M (+35%, +33%); Sales and marketing 406M, FX (4), 402M (+16%, +15%); G&A 144M, FX (2), 142M (+30%, +28%).
Four stacked reconciliation tables.
Operating income EUR 672M IFRS vs 582M Q3 2025; FX effect (19); excluding FX 653M; +15% IFRS and +12% ex-FX Y/Y.
Single reconciliation table at top of an otherwise blank page.
Three tables: quarterly Free Cash Flow from March 31, 2023 to September 30, 2026 (Q3 2026: operating cash flow 740, capex (6), restricted cash 1, FCF 735); last-twelve-months FCF from December 31, 2023 to September 30, 2026 (latest 3,190); and annual FCF 2016 to 2025 (2016: 73, 2023: 678, 2024: 2,285, 2025: 2,874). EUR millions, unaudited.
Three stacked wide tables.
Section divider slide introducing the appendix section of the deck.
Title in a mint block at top left.
Guidance incorporates Social Charges on share-based compensation, which are tied to the share price and can be volatile. At the Q3 close the stock price was USD 487.38; a 10% increase or decrease would have an approximate +/- EUR 20M impact on Social Charges in Q3.
Title, blue subtitle and one text paragraph on a white page.
Closing slide with the centered blue Spotify logo on a mint-green panel.
Centered logo on mint panel with blue gradient frame, mirroring the title slide.
このスライドと基礎となるプレゼンテーションコンテンツに関する一般的な質問。
Spotify calls it its Q3 2026 Update, a shareholder deck dated October 22, 2026, filed with the SEC as an exhibit to Form 6-K. Its 35 slides cover an executive summary, key highlights and actuals versus guidance, financial summary, revenue, gross margin, operating expenses, free cash flow, MAUs and Premium Subscribers, product and platform updates, the Q4 2026 outlook and financial statements.
Amounts are in euros (EUR) as the deck states. MAUs reached 788 million (+11% Y/Y) and Premium Subscribers 306 million (+9%). Total Revenue was EUR 4,969 million (+16% Y/Y, +14% constant currency), Gross Margin 33.0%, Operating Income EUR 672 million (13.5% margin) and Free Cash Flow EUR 735 million.
The deck reports the third quarter of 2026 (three months ended September 30, 2026). LTM means Last Twelve Months, the preceding 12 months relative to the last day of the quarter. Constant currency and Free Cash Flow are non-IFRS measures, reconciled in the appendix slides.
The outlook slide expects 818 million MAUs, 316 million Premium Subscribers, Total Revenue of EUR 5.2 billion, Gross Margin of 33.8% and Operating Income of EUR 820 million, as of October 22, 2026 and subject to substantial uncertainty.
It is Spotify's Q3 2026 Update shareholder deck, filed with the SEC as an exhibit to Form 6-K. The original is in English, and the images here were rasterised from the SEC filing, so footnotes on some slides are small.
The gallery page offers the slides as images, a PDF and a PPTX version, so you can browse every slide, download the PDF or open the PPTX for reference.
Yes. The structure works well as a reference for an earnings update: agenda, executive summary table, actuals versus guidance, KPI charts, outlook and financial statements. Logos, trademarks and figures belong to Spotify, so replace them with your own branding and data.
Slides 25 to 28 hold the interim condensed statements of operations, financial position and cash flows plus the earnings per share calculation. Slides 29 to 32 reconcile IFRS to non-IFRS results for revenue, gross profit, operating expense, operating income and Free Cash Flow.

Create Your Own Slides
Turn your ideas into professional presentations in seconds with 2slides AI.
プロフェッショナルなデザインを参照し、スタイルを選択し、完璧なテキストレンダリングでスライドを生成。Nano Banana搭載—今すぐプレゼンテーションの作成を始めましょう。
© 2026 2slides。全著作権所有。


