
収録コレクション: 投資家向けプレゼン資料の実例
SpaceX IPO Roadshow Presentation — a 60-slide investor deck for Space Exploration Technologies Corp.'s initial public offering, covering the company's integrated Space, Connectivity (Starlink), and AI (Grok/xAI) businesses, financials, market opportunity, and growth strategy.
クイックナビゲーション
タグ
スライドを共有
SpaceX IPO Roadshow Presentation — a 60-slide investor deck for Space Exploration Technologies Corp.'s initial public offering, covering the company's integrated Space, Connectivity (Starlink), and AI (Grok/xAI) businesses, financials, market opportunity, and growth strategy.
レイアウト、主要コンテンツ、視覚要素を含む各スライドページの詳細ビュー。
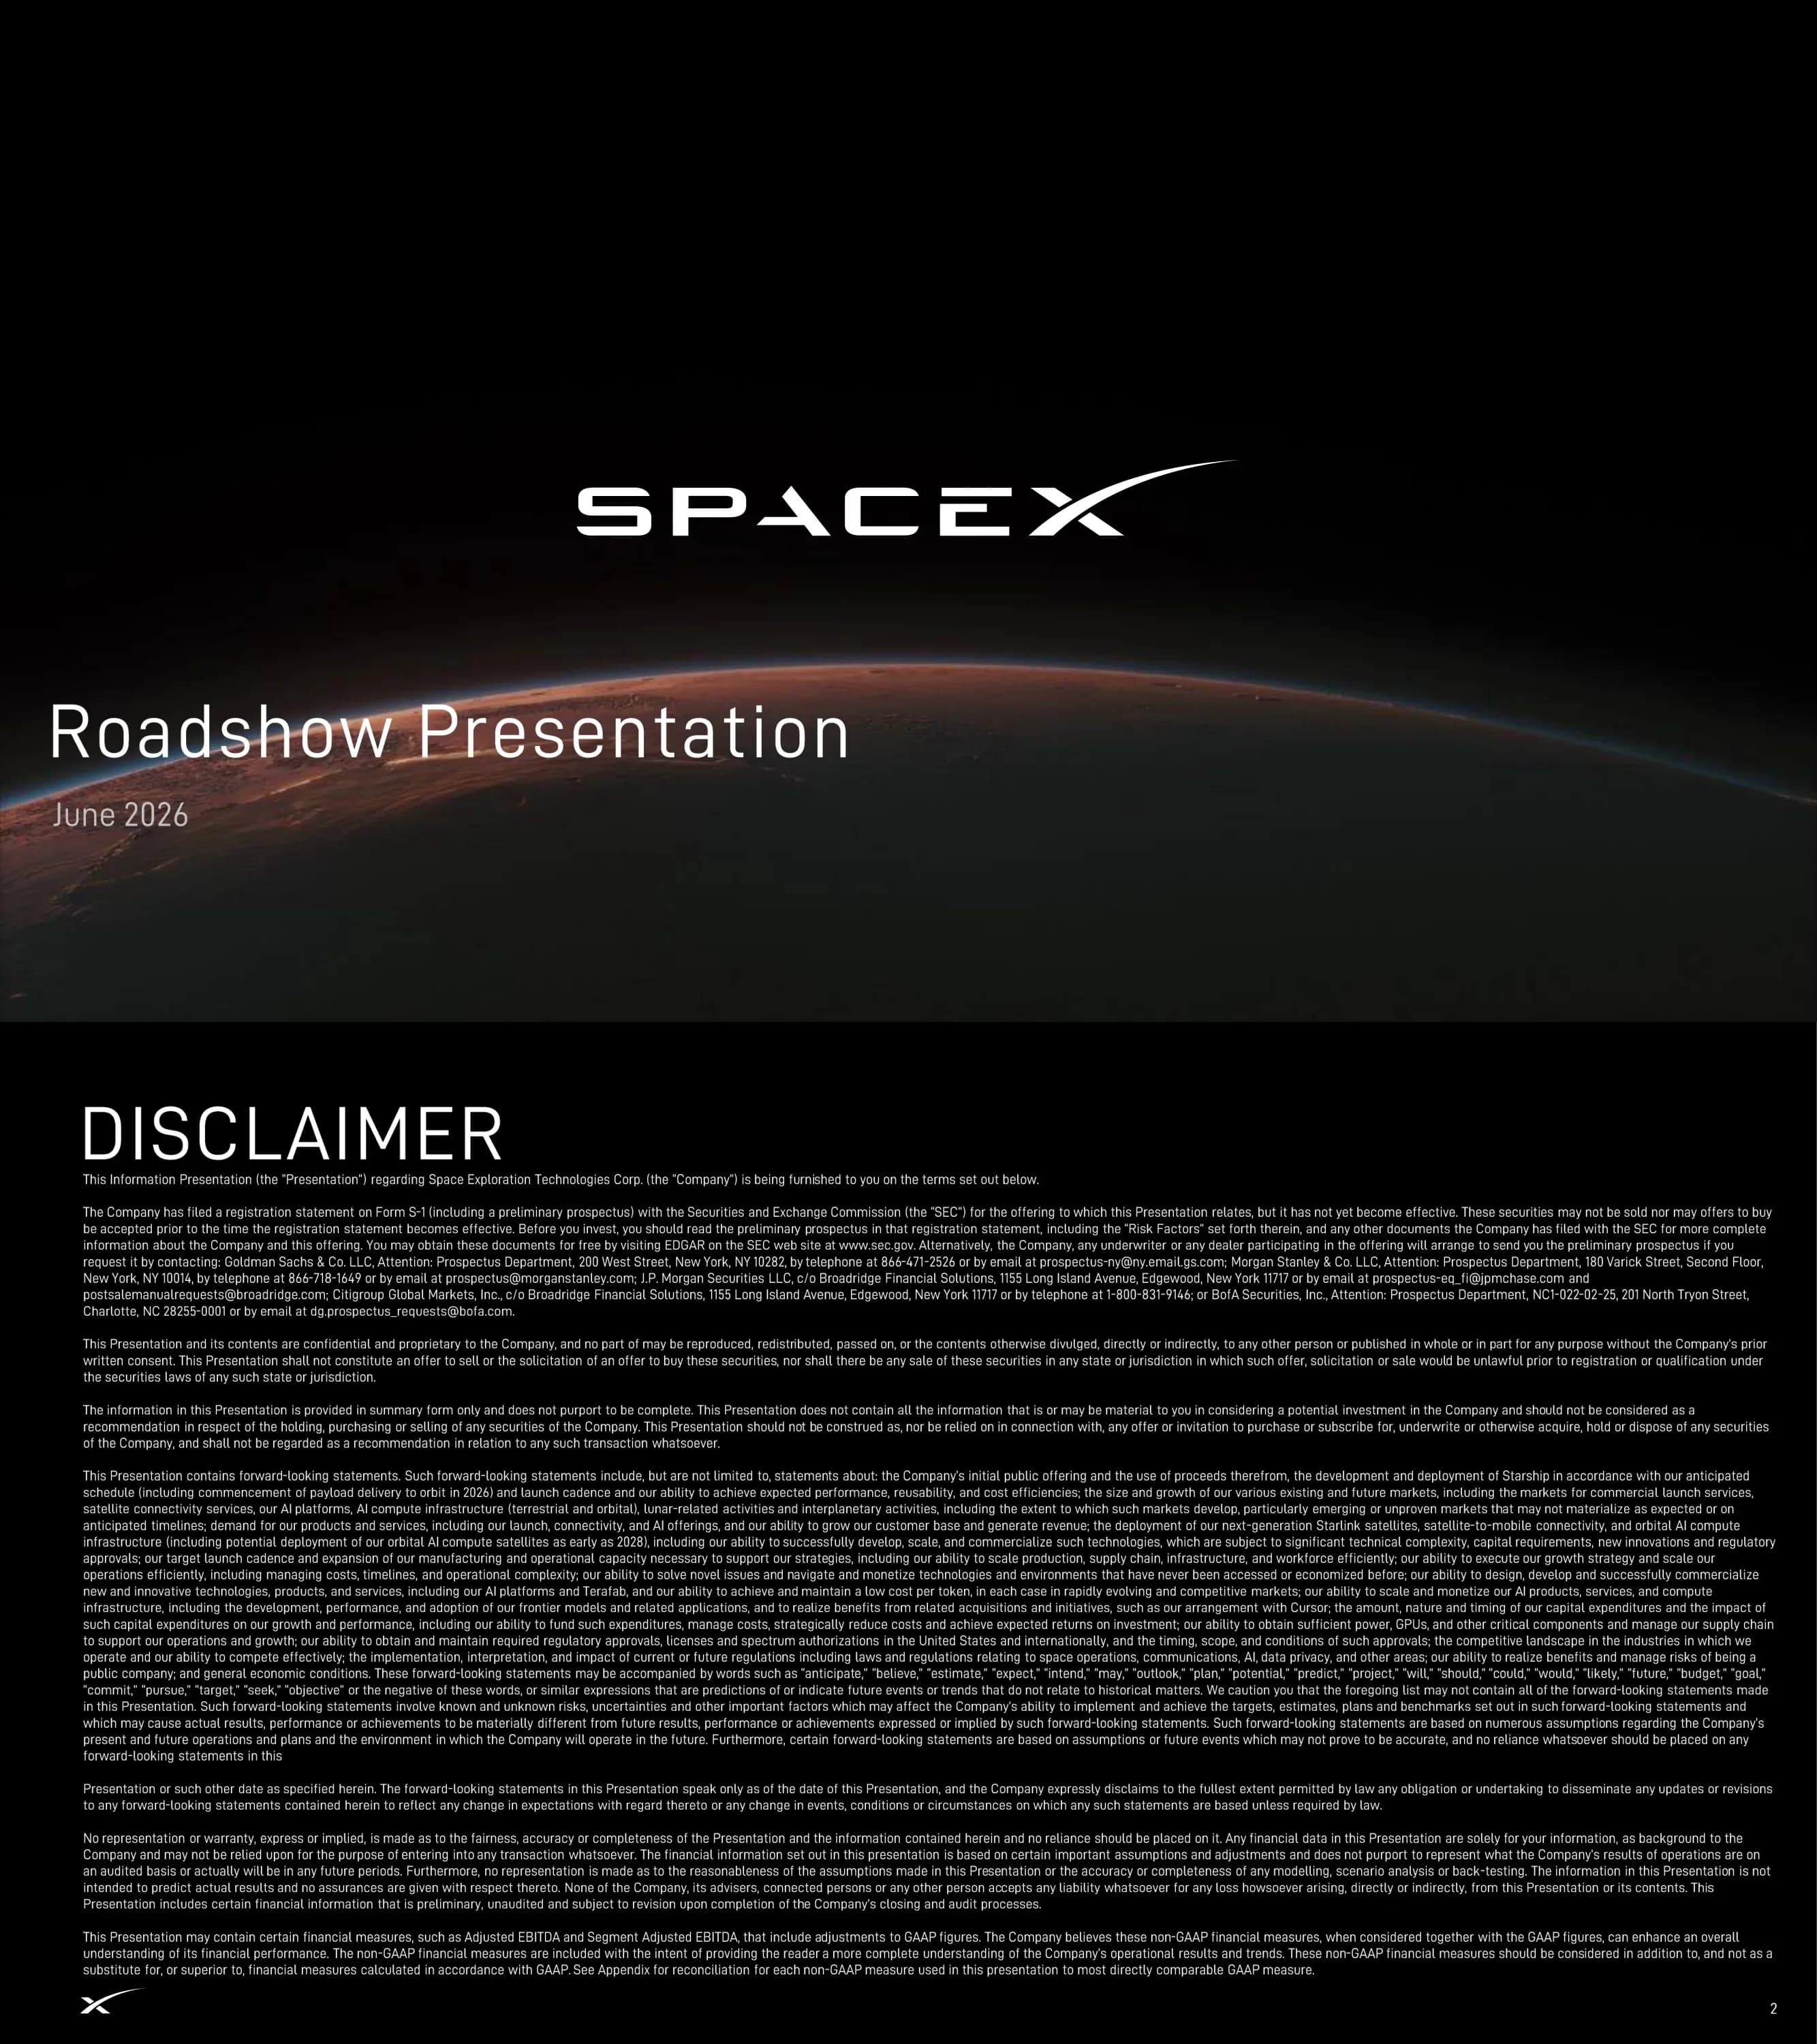
SpaceX wordmark over an Earth-from-orbit image; subtitle 'Roadshow Presentation, June 2026'.
Full-bleed dark cover image with centered logo and lower-left title block.
Dense legal disclaimer covering the registration statement, forward-looking statements, and non-GAAP measures.
Single large heading with multi-paragraph fine print on black.
Key IPO terms: issuer, 555.6M shares, $135/share, Nasdaq ticker SPCX, June 11 2026 pricing, use of proceeds, lock-up, bookrunners and co-managers.
Two-column label/value table with row dividers.
Mission to make life multiplanetary and extend the light of consciousness; connecting 3B+ people and accelerating the AI era.
Left text column with right-side Mars-and-Moon imagery.
Positions SpaceX as the only company building integrated hardware+software across space, connectivity, and AI.
Left title and short statement over a full-bleed Starship-in-orbit photo.
Three-pillar KPI grid (Space / Connectivity / AI) with metrics like ~650 launches, 9,600+ Starlink satellites, 4 major model releases.
Three columns each with header and stacked stat rows.
Firsts across Space, Connectivity, and AI with years (e.g., first private liquid-fuel rocket to orbit 2008).
Three stacked sections of FIRST/ONLY bullet lists over launch tower image.
Seven competitive advantages: launch leadership, satellite platform, truth-seeking AI, vertical integration, trillion-dollar markets, hard-to-replicate models, culture.
Vertically spaced single-column statements over a reentry image.
Matrix mapping Infrastructure/Hardware/Software/Operations/End Customer across Space, Connectivity, AI.
Row-by-column matrix with a left vertical timeline of nodes.
Five-step engineering principle: make requirements less dumb, delete, optimize, accelerate, automate.
Numbered left list with a photo of three engine generations on the right.
Leadership portraits (Musk, Shotwell, Johnsen) with tenure stats: 21yr top execs, 12yr senior mgmt, <2% engineer acceptance.
Left portrait trio with right-side stacked stats.
Countdown-style 7-to-1 + LIFTOFF business model: leverage launch, create markets, engineer, apply The Algorithm, vertically integrate, drive cost down, reinvest cash.
Left numbered countdown list with right-side landed-booster night image.
Bar chart of near-term TAM segments summing to $5.7T across Space ($370B), Connectivity ($1.6T), AI ($3.8T).
Ascending bar chart with segment color band beneath axis.
Extended TAM bar chart reaching $28.5T total, with AI growing to $26.5T including $22.7T enterprise applications.
Bar chart with faded near-term bars and prominent enterprise/total bars.
Timeline of 2026 milestones: xAI acquisition, Starlink 10M customers, Terafab, X Ads Manager, Grok 4.3, Cursor & Anthropic deals, EchoStar spectrum, Starship V3, American Airlines.
Vertical dated timeline with logos and descriptions.
Five forward roadmap columns: Starship V3, Broadband V3 Satellite, Mobile V2 Satellite, Terrestrial Compute, AI Compute Satellite with dates and metrics.
Five-column header + two-stat-each grid.
Section opener: world's leading launch provider with 80%+ of mass to orbit since 2023; foundation for other businesses.
Left title/text over full-bleed Starman/Tesla-in-orbit image.
Comparison of Falcon 9, Falcon Heavy, Starship V3 across payload, flights, success rate, use cases.
Three rocket silhouettes above a comparison table.
Dragon stats: 50+ ISS visits, 78 crew flown, 20 countries, only NASA-certified private crew vehicle.
Left stacked big-number stats over full-bleed capsule window view.
Benefits (cost, cadence, reliability, environment) and advantages to SpaceX and customers.
Left benefit list and right two-block advantage grid over night-launch image.
Starship capabilities: first heavy-lift fully reusable rocket, 12 test flights, propellant transfer, Mechazilla catch goal.
Left bulleted list with right Starship/Super Heavy annotated photo.
Bar chart of SpaceX share of world mass to orbit: 45% (2021) → 65% (2022) → 80%+ (2023-2025).
Left bar chart with right full-bleed launch image.
Line+bar chart of annual Falcon launches rising to 165 in 2025; new boosters flown declining to 8.
Combined line/bar chart with right-side keyword callouts.
Launch cost per kg to LEO: $18,500 historical vs $2,700 Falcon 9, $1,400 Falcon Heavy, near-zero Starship (99%+ target reduction).
Descending bar chart with cost-reduction percentages.
Payload capacity bar chart: Falcon 9 (23) to Future Starship (200 metric tons reusable).
Left engine-plume image with right payload bar chart.
Section opener: leveraged launch to build the most advanced global LEO satellite internet network.
Left title/text over full-bleed outdoor laptop-at-sunset image.
V2 vs V3 satellite comparison (bandwidth, deployment per launch) plus competitive strengths; 20x+ bandwidth per launch with V3.
Center two-column spec table with right strengths column.
Six scenario tiles where Starlink wins: low density, remote communities, topography, deep-sea, airborne, disaster zones.
2x3 image tile grid with labels.
Three-panel data: 9,600+ satellites (~75% share), subscriber growth bars to 10.3M, reach metrics (164 countries, 99.9% uptime, 225 Mbps).
Three-panel dashboard with two charts and a stats column.
Five customer categories (Fixed, Land Mobility, Maritime, Aviation, Starshield) with brand logos.
Five-column image+logo grid with bottom caption.
Gen 1 vs Gen 2 stats (~30 MNOs, ~1.9B covered, 5G to unmodified phones, 65MHz spectrum, 2027 V2 deployment).
Two stat columns with right text and canoe/lake image.
Section opener: only company vertically integrating AI compute infrastructure, frontier model, and real-time data.
Left title/text over full-bleed satellite-at-sunrise render.
Colossus data center: first gigawatt-scale training cluster, first GW Megapack install, first GB200/GB300 at scale, 1GW nameplate compute.
Full-bleed aerial datacenter photo with bottom 'first' stat row.
Two charts: stagnant US electricity growth vs China; US compute supply shortfall (62GW demand vs 49GW supply); 99.8% solar energy note.
Two bar charts left/center with right sun image and stat.
Three reasons orbital compute wins: readily available, lower ongoing & deployment costs, faster time to useful tokens.
Left category labels with right supporting bullet rows over solar-panel image.
Evolution diagram from Starship V3 + Starlink V3 to AI Satellite via reduce/keep/add components; key technical hurdles removed.
Left-to-right evolution diagram with reduce/keep/add columns.
Virtuous flywheel: infrastructure advantage → lower cost per token → more users → better UX → monetization → reinvestment.
Left title with right circular flywheel diagram over moon image.
Grok positioning: frontier performance fast, rapid iterations, real-time data via X; phone UI mockup.
Left phone mockup with right spaced statements.
X platform: ~550M MAU, ~350M daily posts; monetization strategy (Everything App, Premium, ads).
Left logo+stats and strategy list with right phone mockup.
Three monetization paths: selling compute (Anthropic $1.25B/mo), enterprise intelligence (Grok/Cursor), consumer intelligence (Grok, Imagine stats).
Three-column with partner logos and stats.
Section opener title over a cinematic Starship reentry close-up.
Left title over full-bleed dark vehicle image.
Three-track growth plan across Space (launch capacity, lunar economy), Connectivity (broadband, mobile), AI (monetization, orbital compute, chips, human augmentation).
Three text columns positioned along an ascending launch arc.
Three lunar phases: human moon return, lunar base, building ground for AI compute satellites.
Three-column list over a lunar-base render.
Six future market tiles: point-to-point travel, in-orbit manufacturing, Mars energy/manufacturing, Mars transport, asteroid mining, lunar transport.
2x3 captioned image tile grid.
Section opener over a glowing Starship-over-Mars reentry image.
Left title over full-bleed image.
Space & Connectivity segment Adj. EBITDA bars ($2.6B→$7.8B) with $9B raised and R&D investment table.
Center bar chart flanked by arrow callouts, R&D table below.
Stacked revenue bars ($10.4B→$18.7B, 33% growth) and Adj. EBITDA bars by segment (Space/Connectivity/AI).
Two stacked bar charts side by side with segment legend.
Capital expenditures stacked bars ($4.4B→$20.7B) with right-side notes on Space/Connectivity/AI capex.
Left stacked bar chart with right explanatory notes.
2025 vs future target table: revenue growth 33%→higher, gross margin 49%→~70%, GAAP net income margin (26%)→~45%.
Three-row metric table with 2025/target columns and commentary.
Appendix section divider over a Mars-window cabin interior render.
Left title over full-bleed cabin image.
Current vs future revenue streams mapped across Space (Launch, Lunar), Connectivity (Broadband, Mobile), AI (Advertising, Subscriptions, Enterprise).
Three-column timeline with current/future stream labels over Mars horizon.
Space segment revenue ($3.6B→$4.1B) and Adj. EBITDA ($1.0B→$0.7B) bars with R&D row and commentary.
Two stacked bar charts (revenue, EBITDA) with right notes.
Connectivity revenue ($3.9B→$11.4B) split consumer/enterprise and Adj. EBITDA ($1.6B→$7.2B) bars with commentary.
Two bar charts with right-side bullet notes.
AI revenue ($3.0B→$3.2B, ads vs solutions) and Adj. EBITDA ($1.2B→($1.2B)) bars; note on X representing most AI revenue in 2023-24.
Two bar charts with right commentary and divider note.
Definitions of key metrics by segment: mass to orbit, launches, Starlink subscribers, ARPU, nameplate compute draw, segment income, Adj. EBITDA, capex.
Left segment labels with right metric/definition rows.
Consolidated reconciliation from net loss to Adjusted EBITDA for 2023-2025 and Q1 2026.
Multi-row financial reconciliation table with year columns.
Space segment reconciliation from income from operations to Segment Adjusted EBITDA.
Financial reconciliation table with year columns.
Connectivity segment reconciliation to Segment Adjusted EBITDA across periods.
Financial reconciliation table with year columns.
AI segment reconciliation to Segment Adjusted EBITDA across periods.
Financial reconciliation table with year columns.
Closing slide with SpaceX wordmark over a planetary horizon, mirroring the cover.
Centered logo on full-bleed dark planetary image.
このスライドと基礎となるプレゼンテーションコンテンツに関する一般的な質問。
It's a premium investor-deck template modeled on an IPO roadshow presentation. It's ideal for IPO and late-stage fundraising roadshows, investor days, and board updates where you need to combine a compelling narrative with rigorous financials.
60 slides covering the full investor story: title and disclaimer, offering summary, mission and competitive moats, TAM sizing, three business segments (Space, Connectivity, AI), growth strategy, segment financials, and GAAP-to-non-GAAP reconciliations.
Yes. The deck uses a disciplined dark palette with full-bleed imagery and clean typography. You can swap the cover and section images, replace the accent color, and reuse the chart and table layouts with your own data.
Yes. You get reusable layouts for KPI dashboards, single and stacked bar charts, combined line/bar charts, comparison tables, capex and EBITDA visuals, and full financial reconciliation tables.
Absolutely. The structure — mission, why we win, market size, segment deep-dives, financials, and roadmap — maps directly onto growth-stage venture pitches and strategic board presentations.
There are several three-pillar layouts (KPI grids, vertical integration matrix, revenue components map, and growth strategy columns) that work well for any company presenting two or more business lines.
The gallery provides the visual reference and structure. You'll rebuild the slides with your own copy and figures, using these layouts as a proven blueprint for pacing and information density.
It turns dense, technical, and financial information into a clear, high-conviction narrative — pairing cinematic imagery with restrained typography and well-designed data visualizations, a model for premium investor communication.

Create Your Own Slides
Turn your ideas into professional presentations in seconds with 2slides AI.
プロフェッショナルなデザインを参照し、スタイルを選択し、完璧なテキストレンダリングでスライドを生成。Nano Banana搭載—今すぐプレゼンテーションの作成を始めましょう。
Your AI Agent for slides. Save time, shine faster with intelligent presentation creation.




© 2026 2slides. All rights reserved.