
収録コレクション: 投資家向けプレゼン資料の実例 · 決算説明資料の実例集
Seiko Epson H1 FY2026 Earnings Presentation: Japanese-language Q2 FY2026 (fiscal year ending March 2027) results briefing deck (決算説明会), released November 5, 2026 and originally published on TDnet, the Tokyo Stock Exchange's timely disclosure system. It covers Q2 and first-half results by segment, the revised full-year forecast, shareholder returns and a feature on Epson's crystal devices for AI data centers.
このスライドの表紙をスタイルの参考にして、ご自身の内容からスライドを作成します。 下のページから好きな1枚を選び、そのレイアウトを参考にすることもできます。
クイックナビゲーション
タグ
スライドを共有
Seiko Epson H1 FY2026 Earnings Presentation: Japanese-language Q2 FY2026 (fiscal year ending March 2027) results briefing deck (決算説明会), released November 5, 2026 and originally published on TDnet, the Tokyo Stock Exchange's timely disclosure system. It covers Q2 and first-half results by segment, the revised full-year forecast, shareholder returns and a feature on Epson's crystal devices for AI data centers.
レイアウト、主要コンテンツ、視覚要素を含む各スライドページの詳細ビュー。
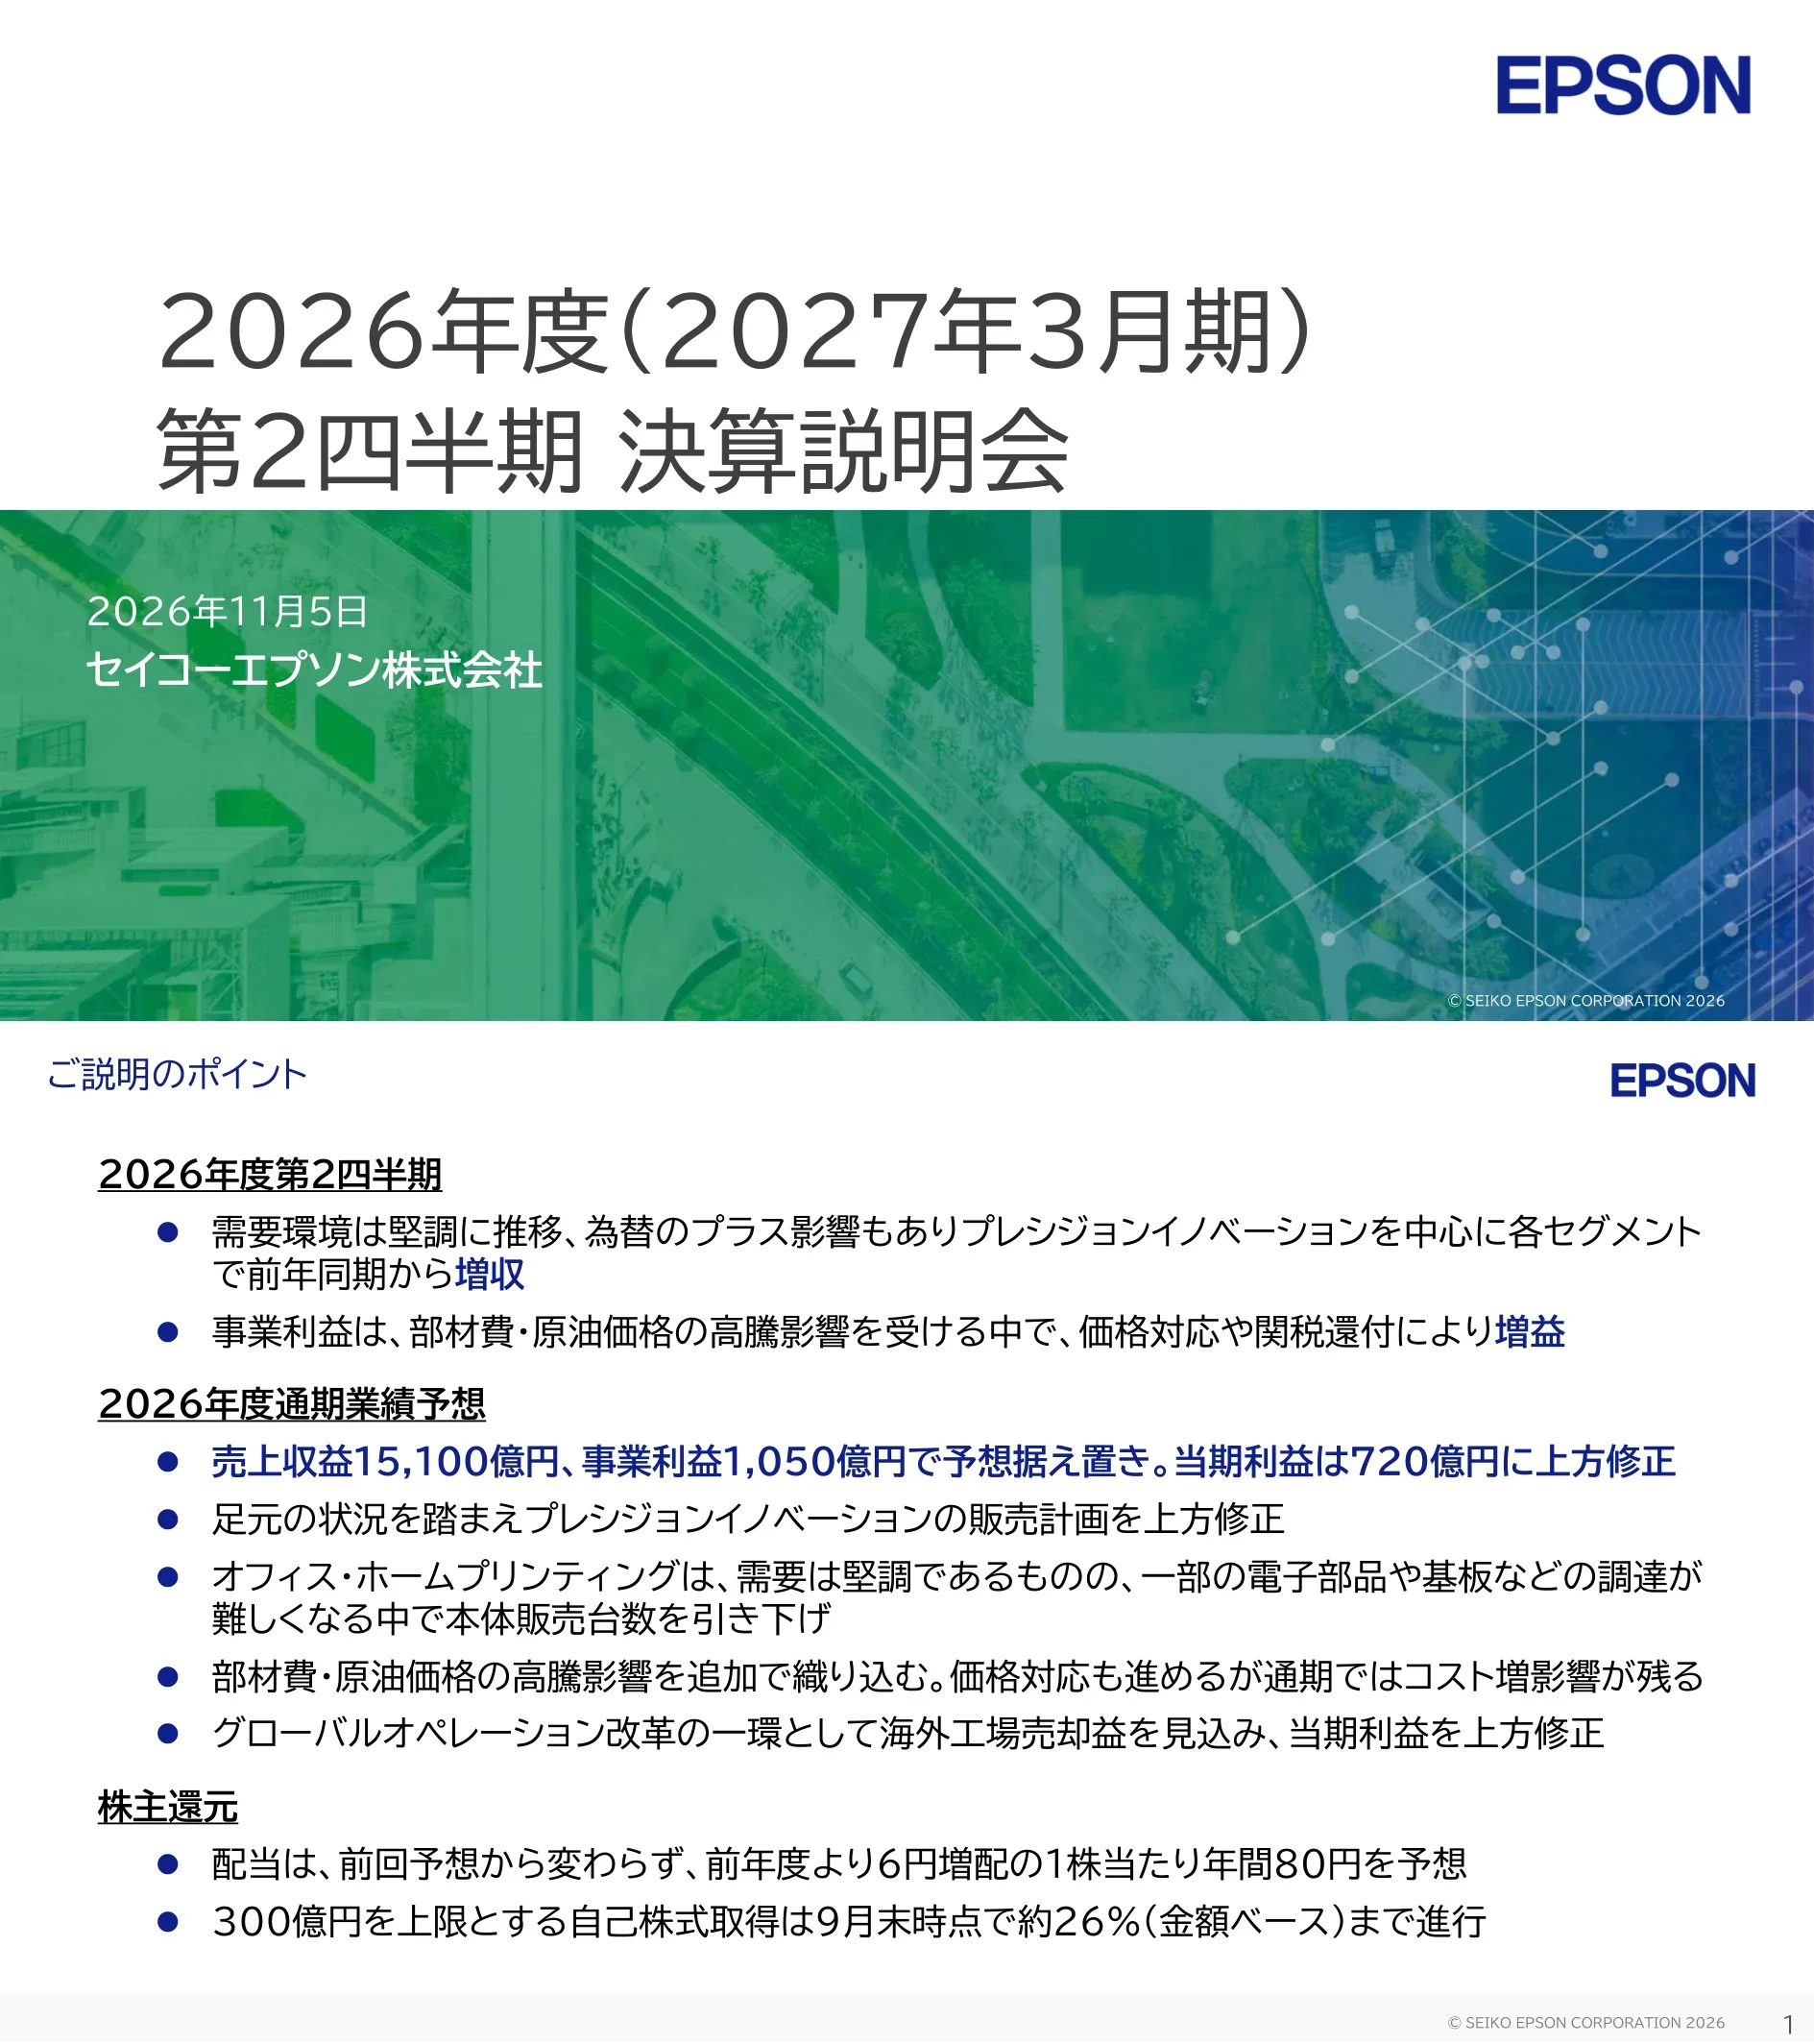
Cover slide for Seiko Epson's Q2 FY2026 earnings briefing (2026年度(2027年3月期)第2四半期決算説明会), dated November 5, 2026.
Large title in the upper half, date and company name over a full-width green-to-blue aerial photo band, EPSON logo top right.
Summary: Q2 revenue rose in every segment, led by Precision Innovation and helped by a weaker yen; business profit rose on price increases and US tariff refunds despite higher material and oil costs. Full-year revenue 15,100億円 and business profit 1,050億円 are unchanged, net profit is raised to 720億円; dividend of ¥80 (+¥6) and a 300億円 buyback about 26% complete.
Three underlined headings (Q2, full-year forecast, shareholder returns) with bullet points beneath each; key forecast line highlighted in blue.
Segment summary table for Q2 and full year. Q2 revenue 3,739億円 (+7.9%) and business profit 450億円 (+154.8%); full-year forecast revenue 15,100億円 and business profit 1,050億円. Precision Innovation forecast raised to revenue 2,030億円 and profit 610億円; Office & Home Printing cut to revenue 7,000億円 and profit 540億円.
Wide two-block table: Q2 (prior year, current, YoY) on the left and full year (FY2025 actual, previous forecast, new forecast, YoY, vs previous) on the right; current columns shaded blue.
Section divider listing the three parts: Q2 FY2026 results (highlighted), full-year forecast and shareholder returns, and topics.
Three stacked agenda lines with the active section in blue and the others in grey, photo band along the bottom.
Q2 revenue 3,739億円 (+274, +7.9%), business profit 450億円 (12.0% margin, +154.8%), operating profit 426億円, pre-tax profit 415億円, net profit 317億円 (+162.8%), EPS ¥99.07. Average rates USD ¥159.26 and EUR ¥183.29; currency added +238億円 to revenue and +52億円 to business profit. A foreign exchange loss was booked as the yen strengthened during the quarter.
Main P&L table on the left, currency impact table below it, commentary box with checkmarks on the right, footnotes bottom right.
Precision Innovation revenue 511億円 (+25.4%) and segment profit 168億円 (+49.8%, 32.9% margin). Inkjet Solutions 199億円 (+31.0%) on project wins in China, Microdevices 280億円 (+23.2%) on network and industrial crystal demand, Epson Atmix 44億円 (+16.2%).
Segment table top left, change columns in the middle, commentary panel right, three quarterly bar charts across the bottom (FY24 Q1 to FY26 Q4).
Industrial & Robotics revenue 829億円 (+12.4%) and segment profit 140億円 (+203.9%, 16.8% margin), helped by US tariff refunds. Commercial & industrial printing 761億円 (+10.9%) on strong photo, label and small printer sales; robotics 69億円 (+33.0%) on AI-related demand in China and Asia.
Teal-headed segment table, change columns, commentary panel, two quarterly bar charts below.
Office & Home Printing revenue 1,715億円 (+2.4%) and segment profit 191億円 (+59.6%, 11.2% margin). Printer unit sales fell below last year because of component shortages, but price increases and a weaker yen lifted revenue; tariff refunds offset higher costs.
Segment table with SOHO/home, office shared and other lines; commentary panel; three charts: stacked printer unit sales, ink revenue YoY line chart, office shared revenue bars.
Visual & Lifestyle revenue 674億円 (+6.8%) and segment profit 99億円 (+75.5%, 14.7% margin). Visual products 461億円 (+3.5%) on mix and currency, wearables 132億円 (+20.5%), PCs 81億円 (+6.4%) as higher prices offset lower units after last year's OS end-of-support demand.
Segment table, change columns, commentary panel, three quarterly bar charts for visual products, wearables and PCs.
Business profit rose from 177億円 to 450億円: volume -12, price +123, cost -62, US tariff refund +173 (Phase 2), currency +52. Price increases are being used to offset higher material and oil costs.
Headline message and four labelled bullets at the top, horizontal waterfall chart across the lower half.
Total assets 15,755億円 at end of September 2026; cash 2,998億円 against interest-bearing debt 2,385億円 for net cash of 613億円; inventories 4,194億円 at 103 days; equity attributable to owners 8,751億円 with a 55.5% equity ratio.
Four-quadrant dashboard of bar charts, each covering quarter-ends from June 2024 to March 2027.
Section divider with the full-year forecast and shareholder returns section highlighted.
Same three-line agenda layout with the second item in blue.
November 5 forecast: revenue 15,100億円 and business profit 1,050億円 (7.0%) unchanged; operating profit raised to 1,030億円, pre-tax to 1,000億円 and net profit to 720億円 (+30 vs August), EPS ¥226.39. Assumed rates USD ¥156 and EUR ¥179 for the year, ¥153 and ¥174 from Q3; currency sensitivity tables included.
Forecast table comparing FY2025 actual, August 5 and November 5 forecasts with change columns; currency sensitivity table below; commentary panel and Q3+ rate assumptions on the right.
Two waterfalls from FY2025's 838億円 to 1,050億円. The November forecast assumes volume +270, price +250, materials and freight -500, other -160, US tariff refund +180 (adding Phase 3) and currency +170, versus the August view of +260, +210, -380, -130, +170 and +80.
Bulleted list of changes since the previous forecast, then two stacked waterfall charts (August vs November) sharing one axis of labels.
Precision Innovation forecast raised to revenue 2,030億円 (+80 vs August, +21.2% YoY) and segment profit 610億円 (+60, 30.0% margin). Inkjet Solutions 770億円 and Microdevices 1,120億円 raised; Epson Atmix unchanged at 190億円.
Forecast table with FY2025 actual, August and November forecasts and change columns; commentary panel on the right; lower half left blank.
Industrial & Robotics revenue forecast 3,270億円 (+20 vs August, +9.8% YoY), but segment profit trimmed to 300億円 (-10) to reflect higher costs; robotics unchanged at 290億円.
Single forecast table with commentary panel; large white space below.
Office & Home Printing cut to revenue 7,000億円 (-120 vs August) and segment profit 540億円 (-40, 7.7% margin) as AI-driven demand tightens supply of some electronic components and boards. Printer unit forecast cut by 600,000 to about 16.6 million (ink tank 13.7 million, cartridge 2.5 million, office shared 0.4 million); ink revenue roughly unchanged.
Forecast table on top, second table of unit sales and ink growth below, commentary panel on the right.
Visual & Lifestyle revenue raised to 2,740億円 (+30) on stronger wearables demand (500億円); segment profit held at 220億円 as visual products absorb higher costs. Projector units unchanged at about 1.3 million.
Forecast table, small projector unit table beneath, commentary panel on the right.
R&D forecast 460億円, capex 850億円 vs depreciation 780億円, operating cash flow 1,400億円 and free cash flow 750億円. Indicators: ROS 7.0%, ROA 6.8%, ROE 8.5%, ROIC 6.8% for FY2026, against FY2028 mid-term targets of revenue 15,000億円, ROS 8%, ROE 10% and ROIC 8%.
Four-panel grid: R&D bar chart, free cash flow combo chart, capex vs depreciation paired bars, and a key indicator table covering FY2023 to the FY2028 target.
Policy: invest for growth, then return profits actively, with a dividend floor of 3% DOE and flexible buybacks. FY2026 dividend forecast ¥80 per share (interim ¥40, year-end ¥40), up ¥6; a buyback of up to 300億円 runs from August 7, 2026 to March 31, 2027, about 26% complete by value at end of September, with all shares to be cancelled.
Policy text block on top; dividend history bar chart FY17 to FY26 with yellow buyback badges and a payout-ratio row underneath.
Section divider with the topics section highlighted.
Three-line agenda with the third item in blue and photo footer.
Precision Innovation is the growth engine for the ENGINEERED FUTURE 2035 long-term vision, and within Microdevices, crystal devices benefit from AI data centers, autonomous driving and high-speed communication. The slide maps all four segments to their role: growth engine, full growth in Phase 2, or earnings base.
Matrix with four colored segment columns, rows for businesses, positioning, shared capabilities and materiality; Microdevices outlined in orange.
Market growth in automotive, network and consumer/industrial uses; crystal device revenue grew 1.6 times from FY24 Q2 to FY26 Q2, led by network. Epson's strengths are in-house design and manufacturing of both crystal devices and semiconductors, and the No. 1 crystal device patent registrations in Japan and the US in 2025 (company research).
Three columns: market trend arrows with icons, stacked bar comparison, and a strengths checklist.
Integrated design of crystal and semiconductor delivers high precision, low power and small size together. Products include kHz and MHz resonators, SPXO, TCXO and VCXO oscillators, gyro sensors, RTC modules, accelerometers and IMUs, serving networks, infrastructure, aerospace, industrial equipment, automotive ADAS and consumer IoT.
Left inputs (crystal device and semiconductor boxes), central flow of product photos on blue bands, right grid of six application photos; footnotes overlap the arrows.
Optical links in AI data centers moving from 800G to 1.6T and 3.2Tbps need crystal devices with high frequency, low jitter, low power and small size. The crystal device provides the reference clock to the transceiver DSP, and Epson's integrated design resolves trade-offs among these four requirements with short lead times.
Four numbered panels: data centers move to optics, optical transceiver block diagram, required reference clock (jitter waveforms), and Epson's value as four icon tiles.
Plain EPSON logo slide marking the end of the main presentation before the appendix; no other content.
Centered logo on a white background.
Divider introducing the appendix (補足資料).
Small left-aligned title above a navy-to-grey gradient rule.
First-half revenue 7,411億円 (+738, +11.1%), business profit 672億円 (9.1% margin, +79.4%), operating profit 632億円, pre-tax profit 622億円, net profit 447億円 (+139.3%), EPS ¥139.52. Average rates USD ¥159.32, EUR ¥184.31; currency added +565億円 to revenue and +144億円 to business profit.
Centered P&L table with prior and current half-year columns, currency impact table below, footnotes bottom right.
First-half Precision Innovation revenue 1,009億円 (+24.4%) and segment profit 324億円 (+55.5%, 32.1% margin); Inkjet Solutions 390億円, Microdevices 552億円, Epson Atmix 91億円.
Single large table with change and currency columns; lower half white space.
First-half Industrial & Robotics revenue 1,649億円 (+15.1%) and segment profit 194億円 (+131.7%, 11.8% margin); commercial & industrial printing 1,511億円, robotics 139億円.
Single large table with change and currency columns.
First-half Office & Home Printing revenue 3,385億円 (+7.0%) and segment profit 306億円 (+14.9%, 9.0% margin); SOHO/home 2,668億円, office shared 458億円, other 259億円.
Single large table with footnotes defining the sub-categories.
First-half Visual & Lifestyle revenue 1,346億円 (+7.0%) and segment profit 141億円 (+21.1%, 10.5% margin); visual products 947億円, wearables 259億円 (+20.2%), PCs 141億円 (-1.4%).
Single large table with change and currency columns.
Quarterly growth indicators from FY2025 Q1 to FY2026 Q2 plus full-year forecast: printer hardware revenue, unit sales (Q2 -9%), ink revenue (Q2 +6% in yen) and ink ratio (37% forecast), projector revenue and units (Q2 units -12%). Unit forecasts: printers about 16.6 million, projectors about 1.3 million.
Dense grid table with quarterly columns and growth-rate rows; current quarter columns shaded.
SG&A was 1,092億円 in Q2 FY2026, up 72億円 year on year (personnel +31, other +28, sales promotion +9, R&D +5, advertising 0), at 29.2% of revenue. FY2025 SG&A totalled 4,170億円 (29.5%).
Stacked bar chart FY24 Q1 to FY26 Q4 with SG&A ratio line above, annual totals table on top, YoY breakdown boxes on the right.
Quarterly table of exchange rates, segment revenue and profit, corporate adjustments, consolidated revenue, business profit and ROS, R&D, capex and depreciation by segment, operating cash flow, free cash flow and ROIC. Q2 FY2026 operating cash flow 491億円 and FCF 318億円; full-year forecast capex 850億円.
Full-page spreadsheet-style table with FY2025 Q1-Q4, full year, FY2026 Q1-Q2 actuals and full-year forecast columns.
Q2 FY2026 revenue by region: Japan 570億円 (15.3%), Americas 1,240億円 (33.2%), Europe/Middle East/Africa 769億円 (20.6%), Asia/Oceania 1,159億円 (31.0%). Employees at end of September 2026: 77,232 (19,593 in Japan, 57,639 overseas).
Three tables stacked vertically: regional revenue, regional mix, and headcount, each across quarters from FY24 Q1.
IDC data on A4 printer shipments by type (ink tank, ink cartridge, laser 1-20ppm, laser 21ppm+) from 2023 Q3 to 2026 Q2, split between Japan/North America/Western Europe and other regions; ink tank printers dominate other regions.
Two side-by-side stacked bar charts in millions of units by calendar quarter, with legend and IDC source line.
Product map of all four segments: print heads, crystal and semiconductor devices, metal powders; photo, signage, textile and label printers, Fiery, PaperLab and robots; SOHO/home and office inkjet printers, scanners and label printers; projectors, watches (Orient Star, Orient, Seiko Business) and Epson Direct PCs.
Four colored columns with business sub-headers and product photos under each.
ESG index inclusions and ratings, including all six Japanese ESG indices used by GPIF, MSCI ESG rating AAA and CDP A List for water security, plus awards such as RBA Platinum at overseas plants, Clarivate Top 100 Global Innovators 2026 and Health & Productivity Management (White 500).
Two labelled blocks of bullets on the left (indices/ratings, awards), callout box of index logos on the right connected by a navy wedge.
Links to Epson's investor relations pages (IR library, strategy briefings, integrated report, 'Epson in 5 minutes', shareholder returns), purpose and long-term vision, and sustainability pages (environment, people, ESG data).
Two grey banner sections (investor information, sustainability) each with a website screenshot on the left and bulleted URLs on the right.
Epson Atmix makes metal powders by its own atomizing process, metal injection molded parts (printer parts, orthodontic parts) and synthetic quartz for crystal devices, with three sites in Hachinohe, Aomori.
Three business columns with bullet text and product photos, Japan map with ATMIX logo and three factory photos along the bottom.
Glossary of abbreviations: I/C, IJP, LIJ, LP, RIPS, high-capacity ink tank model, SOHO, office shared, Epson Connect, Color Control Technology, SIDM, 3LCD, high-brightness and smart projectors, FPD, MEMS and industrial domain.
Two-column bordered glossary table.
Forward-looking statement disclaimer; business profit defined as revenue minus cost of sales and SG&A, close to Japanese GAAP operating profit; figures rounded to the displayed unit and fiscal years used unless stated.
Three blue headings with bulleted paragraphs.
Closing slide with the EPSON logo only.
Centered logo on white.
このスライドと基礎となるプレゼンテーションコンテンツに関する一般的な質問。
The slides are in Japanese. This is Seiko Epson's 決算説明会資料 (earnings briefing material) for Q2 of FY2026, released on November 5, 2026 through TDnet, the Tokyo Stock Exchange's timely disclosure system, and on Epson's IR site. The summaries on this page are in English, and amounts are kept in the company's own unit of 億円 (¥100 million).
Epson's FY2026 (2026年度) runs from April 2026 to March 2027, which is why the cover says 2027年3月期 (fiscal year ending March 2027). Q2 is July to September 2026, and the first half (H1) is April to September 2026.
Q2 revenue was 3,739億円 (about ¥373.9 billion, +7.9%) and business profit 450億円 (+154.8%), with net profit of 317億円. For the first half, revenue was 7,411億円 (+11.1%) and business profit 672億円 (+79.4%).
Revenue of 15,100億円 and business profit of 1,050億円 were kept unchanged, but net profit was raised from 690億円 to 720億円 because of an expected gain from selling an overseas factory. Precision Innovation was revised up, while Office & Home Printing was cut on component shortages.
AI-related demand has tightened supply of some electronic components and boards, so Epson cut its inkjet printer unit forecast by 600,000 units to about 16.6 million and lowered segment revenue to 7,000億円 and profit to 540億円, while continuing price increases.
Epson expects an annual dividend of ¥80 per share (¥40 interim and ¥40 year-end), up ¥6, under a policy of a 3% DOE floor. A share buyback of up to 300億円 runs until March 31, 2027 and was about 26% complete by value at the end of September 2026.
Yes. The gallery offers the original PDF and an editable PPTX version, which is useful as a reference for building a results presentation with summary tables, segment pages, waterfall charts and a data appendix. The financial content belongs to Seiko Epson and should be cited as the source.
Official Japanese investor relations library where Epson posts its quarterly earnings briefing materials; the URL is listed in the deck itself.

Create Your Own Slides
Turn your ideas into professional presentations in seconds with 2slides AI.
プロフェッショナルなデザインを参照し、スタイルを選択し、完璧なテキストレンダリングでスライドを生成。Nano Banana搭載—今すぐプレゼンテーションの作成を始めましょう。
© 2026 2slides。全著作権所有。


