
収録コレクション: 投資家向けプレゼン資料の実例 · 半導体企業の決算説明資料・IR資料の実例集
Qualcomm Q4 FY26 Earnings Presentation: the 27-slide deck Qualcomm published on its investor relations site on November 4, 2026 for its fourth quarter and fiscal 2026 results. It covers Q4 non-GAAP revenue of $10.4B and non-GAAP EPS of $2.17, a first $2B quarter for QCT Automotive, full-year FY26 revenue of $43.2B, Q1 FY27 guidance of $10.4B-$11.2B, the Apple, Huawei and Transsion license renewals, the Amazon data center collaboration with warrants covering up to $60B, the move of Data Center into the QCT segment from FY27, pricing actions against rising semiconductor input costs, and full GAAP to non-GAAP reconciliations.
このスライドの表紙をスタイルの参考にして、ご自身の内容からスライドを作成します。 下のページから好きな1枚を選び、そのレイアウトを参考にすることもできます。
クイックナビゲーション
タグ
スライドを共有
Qualcomm Q4 FY26 Earnings Presentation: the 27-slide deck Qualcomm published on its investor relations site on November 4, 2026 for its fourth quarter and fiscal 2026 results. It covers Q4 non-GAAP revenue of $10.4B and non-GAAP EPS of $2.17, a first $2B quarter for QCT Automotive, full-year FY26 revenue of $43.2B, Q1 FY27 guidance of $10.4B-$11.2B, the Apple, Huawei and Transsion license renewals, the Amazon data center collaboration with warrants covering up to $60B, the move of Data Center into the QCT segment from FY27, pricing actions against rising semiconductor input costs, and full GAAP to non-GAAP reconciliations.
レイアウト、主要コンテンツ、視覚要素を含む各スライドページの詳細ビュー。
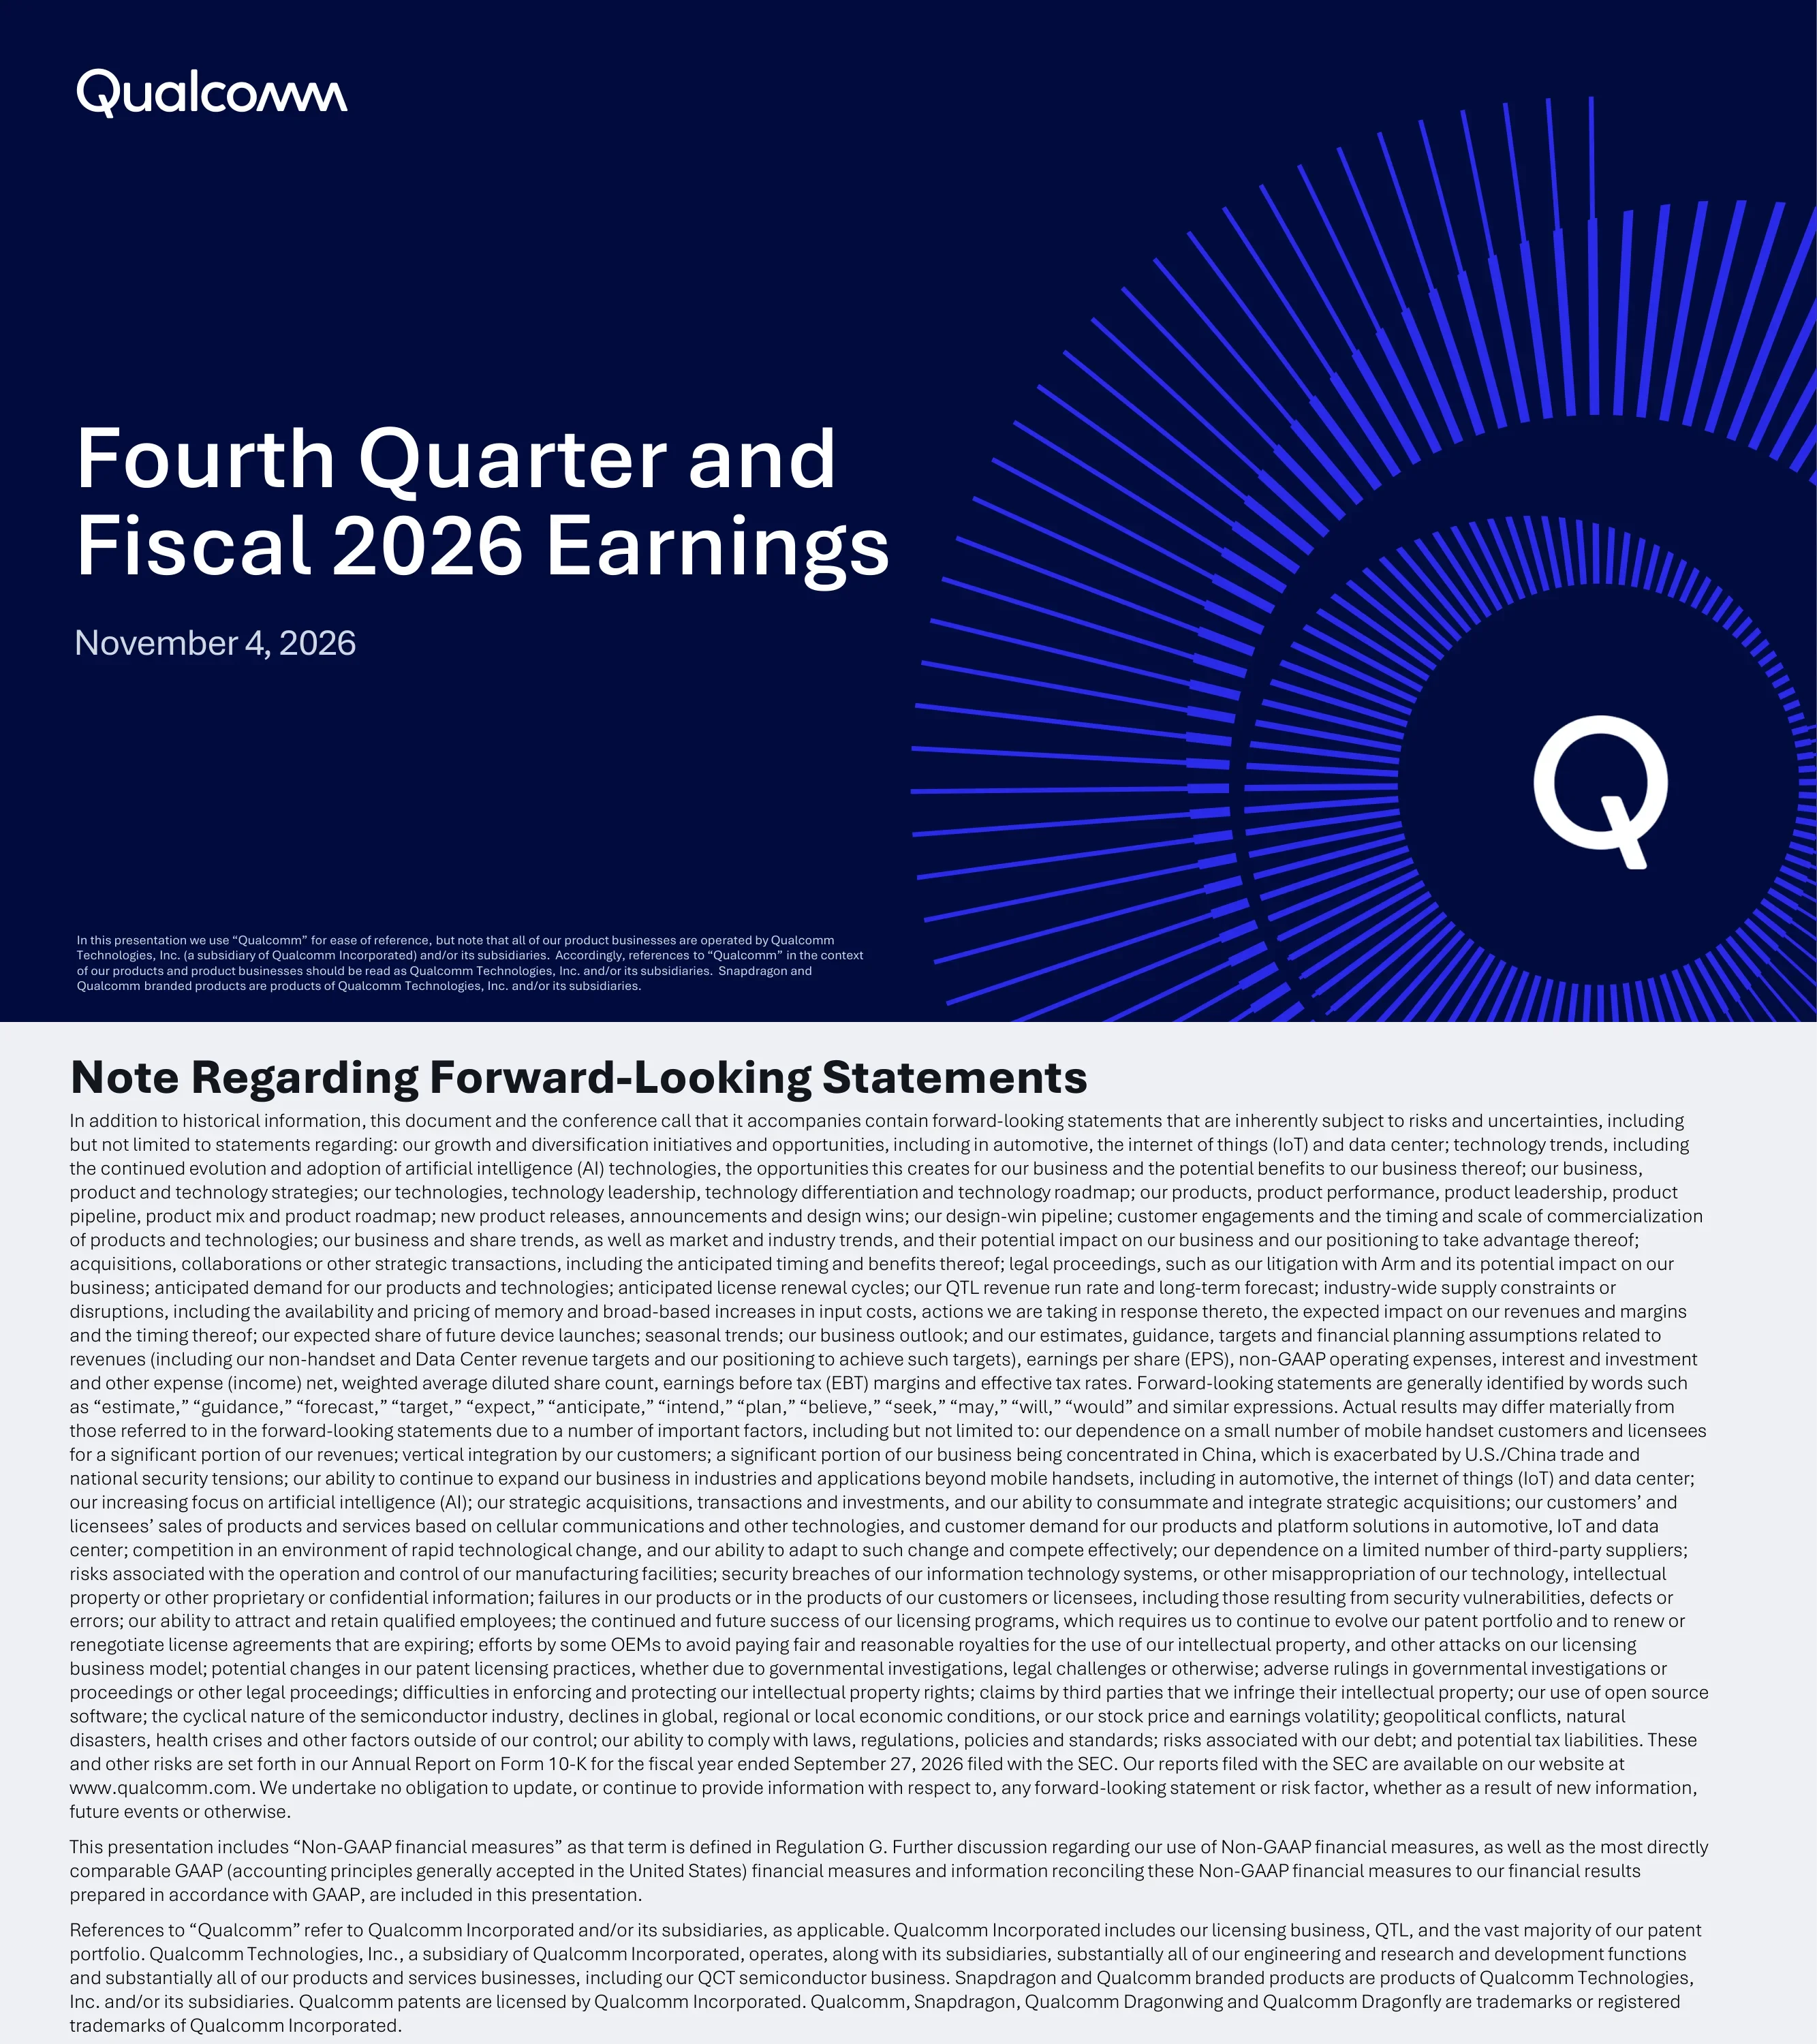
Cover slide dated November 4, 2026, with the Qualcomm wordmark and a small-print note that Qualcomm's product businesses are operated by Qualcomm Technologies, Inc. and its subsidiaries, and that Snapdragon and Qualcomm branded products are its products.
Full-bleed dark navy background; logo top left; large white two-line title left of center with the date below; a radiating blue line burst around a white 'Q' mark fills the right half; legal note in small type at the bottom left.
Safe-harbor text listing forward-looking topics (diversification into automotive, IoT and data center, AI adoption, license renewal cycles, the Arm litigation, memory availability and higher input costs, guidance assumptions) and key risk factors (dependence on a few handset customers and licensees, customer vertical integration, China concentration and U.S./China tensions). It points to the Form 10-K for fiscal year ended September 27, 2026, notes the deck uses non-GAAP measures under Regulation G, and explains Qualcomm Incorporated versus Qualcomm Technologies, Inc.
Light grey background with a bold black headline and three dense full-width text paragraphs.
Section divider introducing the highlights section of the earnings deck.
Dark navy background with a single white headline at left center and a partial blue line-burst ring around the Q mark in the bottom right corner.
Headline figures: non-GAAP revenues $10.4B, GAAP EPS $1.17, non-GAAP EPS $2.17. QCT revenues of $9.0B at the high end of prior guidance, EBT of $2.1B with a 24% EBT margin at the guidance midpoint, and combined Automotive and IoT revenues of $3.9B, up 36% YoY, with record QCT Automotive revenue and its first $2B quarter. QTL revenues of $1.3B and a 70% EBT margin, both at the guidance midpoint. Other: $2.0B returned to stockholders, $1.0B in share repurchases and $1.0B in dividends.
White top band with three oversized KPI numbers in columns; dark navy lower band with three outlined boxes (QCT, QTL, Other) each with a blue header strip and stacked metric callouts; footnote line at the bottom.
Non-GAAP table in millions: revenues $10,442 vs $11,270 (-7%), EBT $2,666 vs $3,792 (-30%), EPS $2.17 vs $3.00 (-28%). QCT revenues $9,015 vs $9,821 (-8%): Handsets $5,137 vs $6,961 (-26%), Automotive $1,990 vs $1,053 (+89%), IoT $1,888 vs $1,807 (+4%); QCT EBT $2,142 vs $2,896 (-26%), margin 24% vs 29% (-5 points). QTL revenues $1,304 vs $1,409 (-7%), EBT $918 vs $1,015 (-10%), margin 70% vs 72% (-2 points).
Dark navy slide with a three-column comparison table (Q4FY26, Q4FY25, YoY change); the current-quarter and change columns are highlighted in brighter blue; rows grouped under Non-GAAP, QCT and QTL subheads with indented sub-lines.
Full-year non-GAAP table in millions: revenues $43,240 vs $44,141 (-2%), EBT $12,976 vs $15,458 (-16%), EPS $10.54 vs $12.03 (-12%). QCT revenues $37,208 vs $38,367 (-3%): Handsets $24,072 vs $27,793 (-13%), Automotive $6,004 vs $3,957 (+52%), IoT $7,132 vs $6,617 (+8%); QCT EBT $10,101 vs $11,670 (-13%), margin 27% vs 30% (-3 points). QTL revenues $5,556 vs $5,582 (flat), EBT $4,022 vs $4,043 (-1%), margin 72% in both years.
Same table design as the quarterly summary: FY26, FY25 and YoY change columns, with Non-GAAP, QCT and QTL row groups.
Q4FY26 guidance vs results vs Q1FY27 guidance: non-GAAP revenues $9.7B-$10.5B / $10.4B / $10.4B-$11.2B; non-GAAP diluted EPS $2.05-$2.25 / $2.17 / $2.15-$2.35; non-GAAP opex ~$2.70B / $2.70B / ~$2.80B; GAAP interest, investment and other expense (income), net $90M / $183M / $120M; non-GAAP tax rate 12.5% throughout; diluted shares ~1.08B / 1.07B / ~1.08B. Segments: QCT revenues $8.4B-$9.0B / $9.0B / $9.0B-$9.6B; QCT EBT margin 23%-25% / 24% / 20%-22%; QTL revenues $1.2B-$1.4B / $1.3B / $1.3B-$1.5B; QTL EBT margin 68%-72% / 70% / 72%-76%. Annual non-GAAP tax rate 13% (FY26 guidance and result), 12.5% for FY27. The intro paragraph flags higher input costs, pricing actions with full gross-margin benefit in 2H FY27, and a 3-point QCT margin impact from moving Data Center into QCT, with the 30% long-term QCT EBT margin target unchanged.
Dark navy slide with title, dated subtitle and an italic explanatory paragraph; a wide banded table with three value columns, the guidance column outlined in bright blue; three sections (quarterly, segment, annual); dense footnotes at the bottom.
Qualcomm renewed long-term licensing agreements with Apple, Huawei and Transsion; QTL's revenue run rate stays unchanged and the licensing business is set into the 6G era, scaling with global handset units. The next renewal cycle runs from FY30 through FY33. Takeaway: these agreements complete the renewal cycle for the 5G era.
Dark navy gradient slide with a title, a wide outlined 'Summary' box with three bullets, and a large centered bold takeaway statement below.
Multi-generation design wins to date: Connectivity with 2 customers (including Amazon), Custom Silicon/AI Accelerator with 3 customers (including Amazon), and CPU with Meta. Qualcomm says it remains on track for its FY29 Investor Day targets: the Amazon collaboration includes warrants covering up to $60B in potential purchases over 10 years with 15% vested immediately; Data Center revenue is expected at $650M+ in Q1FY27, rising every quarter to exit FY27 at a $7B annualized run rate; order coverage supports strong YoY growth in FY28. A bar chart shows the Investor Day 2026 revenue targets of $5B in FY27 and $15B+ in FY29. Closing line: discussions with new large customers on GW-scale opportunities for High Bandwidth Compute and CPU platforms.
Left two-thirds outlined text box with two bold subheads and bullets; right third a two-bar chart with value labels and a spaced caps caption; full-width bold statement across the bottom.
Reporting change: at the June 2026 Investor Day Qualcomm set a path for non-handset revenue, including Data Center, to reach two-thirds of QCT revenue by FY29; from FY27 Data Center will be reported as a new revenue stream within QCT, having sat in nonreportable segments in FY26. QCT revenue streams become Handsets, Automotive, IoT and Data Center. Q1FY27 QCT EBT margin guidance includes a 3-percentage-point impact from adding Data Center, reflecting investment in AI accelerator and CPU roadmaps ahead of revenue; no impact on total company guidance or the 30% long-term QCT EBT margin target.
Single large outlined box on dark navy with two bold subheaded sections of bullets; bold lead-in phrases on the second section's bullets.
Pricing actions: the semiconductor industry faces broad-based input cost increases across wafer fabrication, assembly, test, advanced packaging, memory and other materials, and Qualcomm is raising prices across its products to reflect them. Gross margin impact: the price actions layer in over time, with full benefit now expected in QCT gross margins in the second half of FY27; custom silicon revenue is dilutive to gross margin but accretive to QCT EBT margin.
Dark navy slide with a centered outlined box holding two subheaded bullet sections; generous empty space below.
Section divider for the key announcements part of the deck.
Dark navy background, white headline left of center, partial blue line ring with Q mark in the bottom right.
Qualcomm and Amazon will collaborate over multiple generations on customized silicon for large-scale AI data centers, working together on AI inference, plus optical connectivity extending up to 1.6T and future generations. A warrant structure covers up to $60B in potential Amazon purchases over ten years, with 15% vested immediately based on initial purchase commitments. Qualcomm is already in production with Amazon, with revenue beginning in the December quarter. Takeaway: the partnership lays the foundation to scale Data Center revenue to $15B+ by FY29. Right panel: Custom Silicon (multiple generations for AWS AI infrastructure) and Optical Connectivity (high-bandwidth interconnects inside Amazon data center networks), with the $60B and 15% figures in large type.
Light header strip with a category label, cloud-server icon, press-release headline with a link and a 'Key Announcements' tab; dark body split into a left highlights box with diamond bullets and a bold takeaway, and a right panel with Qualcomm | Amazon logos, two icon-led feature lines, big stat numbers and a 3D server-rack illustration with a Qualcomm Dragonfly chip badge.
Qualcomm Technologies is supplying Qualcomm Dragonwing Cellular Infrastructure solutions for Starlink Mobile's terrestrial base stations for high-capacity U.S. nationwide 5G coverage. Dragonwing QRU100 and QDU100 platforms bring Massive MIMO, power-efficient processing and commercial-grade Layer 1 software. SpaceX plans to start the U.S. rollout in 2027, with tens of thousands of sites over the multi-year agreement. Takeaway: building cellular infrastructure in the United States today with a path to AI-native 6G.
Same announcement template: light header with antenna icon and linked headline; left highlights box with three diamond bullets and bold takeaway; right panel with a Qualcomm | Starlink logo lockup over a faint network-mesh background.
Snapdragon X Elite powers Googlebook, a new laptop category designed for Gemini Intelligence, offering all-day battery life, performance, proactive intelligence, cross-device connectivity with Android, Snapdragon NPU-powered tools and support for thousands of native Android apps and games. Dell and HP Googlebook designs are available for pre-order. Takeaway: Googlebook opens a new laptop category for Snapdragon X Elite built around Gemini and the Android ecosystem.
Announcement template with a laptop icon; left highlights box; right half a light grey product panel with red 'Introducing' and 'Powered by Snapdragon' text around a large black Googlebook wordmark and a photo of an open laptop beside a Snapdragon X Elite chip.
Qualcomm is partnering with Japanese robotics, industrial automation, research and technology organizations to build an open physical AI ecosystem backed by a long-term investment initiative. The new Qualcomm Japan Robotics Center is a hub for applied R&D, ecosystem collaboration, workforce enablement and robotics innovation; the initiative has four pillars: innovation, ecosystem development, commercialization and deployment. Right panel headline: building Japan's open robotics ecosystem to accelerate edge AI, with partner logos including AIRoA, Amatama, Apto, NTT docomo, FANUC, Fixstars, Fujitsu, Kawada, Kawasaki, KDDI, MinebeaMitsumi, NEC, Panasonic Industry, Preferred Networks, Preferred Robotics, Sony and Toyota.
Announcement template with a robot icon; left highlights box with bold takeaway; right panel on a blue-to-black glow with a two-line headline and a four-column grid of white partner logos.
Qualcomm launched Snapdragon 8 Elite Extreme Gen 6 and Snapdragon 8 Elite Gen 6, 2nm dual-flagship mobile platforms for the agentic AI age, with gains in AI, gaming, camera and connectivity. Devices will come from HONOR, iQOO, Motorola, OnePlus, OPPO, REDMI, RedMagic, vivo and Xiaomi. Specs: 5.0 GHz CPU (described as the world's fastest mobile CPU), up to 44% GPU and up to 35% NPU performance improvement for the Extreme version (35% and 14% for 8 Elite Gen 6), all versus Snapdragon 8 Elite Gen 5.
Announcement template with a phone icon; left highlights box; right panel with a headline, two red-and-gold Snapdragon chip badges of different sizes, and a three-column spec strip (CPU, GPU, NPU) with large numbers and small comparison notes.
At Network X 2026 Qualcomm showed an AI-native broadband platform with gFiber built on the Dragonwing NPro A8 Elite Platform with Wi-Fi 8, introduced Dragonwing Security and Management (SAM), launched Dragonwing point-to-point and point-to-multipoint infrastructure solutions, and demonstrated next-generation Dragonwing Fixed Wireless Access. The gFiber gateway specs: 20 Gig symmetrical broadband, quad-band concurrent Wi-Fi 8, and on-device AI through a dedicated Hexagon NPU. Also announced: Dragonwing SAM, Dragonwing FWA Gen 6 Elite Platform, and Dragonwing Point-to-Point and Point-to-Multi-Point Platforms.
Announcement template with an industrial icon cluster; left highlights box with four bullets and takeaway; right panel with gFiber and Dragonwing logos over a home-interior photo, a three-stat row, and a list of three additional products with product badge thumbnails.
A list of 20 press releases from the quarter, each with a link, including: Sergio Buniac appointed EVP and Group GM, Mobile, Compute and Personal AI; Arduino VENTUNO Q with Dragonwing IQ8; the Japan robotics initiative; Adobe migrating AI workloads onto HUMAIN, accelerated by Qualcomm; the Qualcomm and HUMAIN Horizon Ultra AI PC at LEAP 2026; Dragonwing Q-2390 and IQ-2390 processors; the Amazon collaboration; Googlebook; Snapdragon 8 Elite Gen 6; the planned PickNik acquisition; Snapdragon Sound Elite Gen 2; the Apple patent license renewal; the Huawei patent license; the 2027 Innovation Fellowship for North America; Network X broadband innovations; the gFiber/Gemtek Wi-Fi 8 gateway; a statement on a trial verdict win; the Transsion cross-license; a global V2X solution; and the SpaceX Starlink Mobile selection.
Dark navy left side with a large blue line-burst ring framing the 'Key Announcements' title; a large white rounded panel on the right with a single-column bullet list of headlines, each ending in an underlined blue 'Link'; legal entity note at the bottom.
Section divider opening the appendix of GAAP to non-GAAP reconciliations.
Dark navy background, white headline left of center, blue line ring with Q mark bottom right.
Explains why Qualcomm uses non-GAAP measures (consistent benchmarking, measuring QCT and QTL performance, comparing with competitors, and executive incentive pay) and what is excluded: the QSI (Qualcomm Strategic Initiatives) segment, share-based compensation, acquisition-related items, restructuring, impairments, legal settlements and deferred compensation revaluation. From Q1 fiscal 2026 a fixed estimated non-GAAP tax rate is used. Free cash flow is defined as operating cash flow less capital expenditures.
Light grey text slide with a large headline and several paragraphs with nested circle and square bullets.
Q4 FY26 (millions): GAAP revenues $10,322, plus a $120 customer legal-settlement payment, gives non-GAAP $10,442; GAAP EBT $1,173 to non-GAAP $2,666 after QSI ($123), share-based compensation ($873) and other items ($497); net income $1,251 to $2,332; diluted EPS $1.17 to $2.17 on 1,073M shares. Q4 FY25: revenues $11,270 both bases; EBT $2,971 to $3,792; net (loss) income ($3,117) to $3,257; EPS ($2.89) to $3.00, with GAAP shares of 1,078M vs 1,085M because of the net loss. Footnotes list $235M of restructuring, $141M of acquisition-related charges, $1M of interest on the 2019 European Commission fine, and $41M of offsetting deferred compensation revaluation.
Light slide with two stacked reconciliation tables, each with five columns (GAAP, Less QSI, Less Share-Based Compensation, Less Other Items, Non-GAAP) and banded rows; numbered footnotes below.
FY26 (millions): GAAP revenues $43,120, plus $120, gives non-GAAP $43,240; GAAP EBT $9,414 to non-GAAP $12,976 after QSI $794, share-based compensation ($3,452) and other items ($904); GAAP net income $13,628 to non-GAAP $11,311, because other items include a $4,690 tax benefit add-back; diluted EPS $12.70 GAAP vs $10.54 non-GAAP on 1,073M shares. FY25: revenues $44,284 GAAP vs $44,141 non-GAAP; EBT $12,663 to $15,458; net income $5,541 to $13,298; EPS $5.01 to $12.03 on 1,105M shares. Footnote: the FY26 tax adjustment mainly reflects a $5.7B income tax benefit from releasing a valuation allowance in Q2 FY26; FY26 items also include $435M of acquisition-related charges and $343M of restructuring.
Continuation of the reconciliation layout: two stacked five-column tables with banded rows and long footnotes.
Bridges GAAP to non-GAAP EPS guidance. Q4FY26 prior guidance: revenues $9.7B-$10.5B, GAAP diluted EPS $1.22-$1.42, less share-based compensation ($0.72) and other items ($0.11), non-GAAP EPS $2.05-$2.25. Q1FY27 guidance: revenues $10.4B-$11.2B, GAAP EPS $1.03-$1.23, less share-based compensation ($0.99) and other items ($0.13), mostly acquisition-related, non-GAAP EPS $2.15-$2.35. GAAP and non-GAAP revenue guidance are the same, and Q1FY27 guidance includes the estimated impact of higher input costs.
Light slide with a compact two-column guidance table in the upper half, indented 'less' rows, banded shading, and long numbered footnotes at the bottom.
Operating expenses (millions): GAAP combined R&D and SG&A ~$3,600 guided, $3,647 actual, ~$3,850 guided for Q1FY27; actual adjustments of QSI $3, share-based compensation $847 and other items $92, giving non-GAAP opex of $2,705 vs ~$2,700 guided and ~$2,800 for Q1FY27. Effective tax rates (GAAP to non-GAAP): Q4FY26 estimated 14% to 12.5%; Q4FY26 actual (6.5%) to 12.5%; Q1FY27 estimated 15% to 12.5%; previous FY26 estimate (40.5%) to 13%; FY26 actual (45%) to 13%; FY27 estimate 16.5% to 12.5%. N/P means not provided.
Light slide with two tables: a three-column opex bridge on top and a five-column tax-rate bridge below; six numbered footnotes at the bottom.
FY26 (millions): operating cash flow $11,145 less capital expenditures $2,494 equals free cash flow of $8,651. Cash paid for share repurchases $7,817 plus cash dividends $3,854 equals total capital returned to stockholders of $11,671, more than free cash flow for the year.
Light slide with a single-column FY26 table of six rows in two blocks, with underline rules above subtotals; the lower half is left empty.
FY26 (millions): net income $13,628, less income tax benefit $4,214, plus D&A $1,630, plus interest expense $689, less investment and other income $1,445, equals EBITDA of $10,288. Adding back the QSI operating loss ($11), share-based compensation ($3,452) and other items ($796) gives adjusted EBITDA of $14,547. Other items: deferred compensation revaluation ($177), acquisition-related charges ($167), restructuring ($332), and a payment to a customer for a legal settlement ($120).
Light slide with a single-column FY26 table in three blocks (EBITDA build, adjustments, breakdown of other items), with subtotal rules and three footnotes.
このスライドと基礎となるプレゼンテーションコンテンツに関する一般的な質問。
It is Qualcomm's 27-slide deck for its fourth quarter and fiscal 2026 results, dated November 4, 2026. It covers headline results, quarterly and annual financial summaries, results against guidance with Q1 FY27 guidance, the licensing renewals, a Data Center update, the segment reporting change, pricing actions, seven key-announcement slides and a full reconciliation appendix.
Non-GAAP revenue was $10.4B, down 7% year over year. GAAP EPS was $1.17 and non-GAAP EPS was $2.17. QCT revenue was $9.0B, at the high end of guidance, with a 24% EBT margin. QCT Automotive had a record $1.99B quarter, up 89%. QTL revenue was $1.3B at a 70% EBT margin, and Qualcomm returned $2.0B to stockholders.
Non-GAAP revenue of $10.4B-$11.2B, non-GAAP EPS of $2.15-$2.35, QCT revenue of $9.0B-$9.6B at a 20%-22% EBT margin, and QTL revenue of $1.3B-$1.5B at a 72%-76% margin. QCT margin guidance includes a 3-point impact from moving Data Center into the QCT segment from FY27.
Qualcomm reports multi-generation data center design wins in connectivity, custom silicon/AI accelerators and CPUs (Meta), plus a multi-generation collaboration with Amazon that includes warrants covering up to $60B in potential purchases over 10 years. It expects $650M+ of Data Center revenue in Q1 FY27, an exit run rate of $7B for FY27, and targets of $5B in FY27 and $15B+ in FY29.
Yes. The deck follows a clear earnings-call structure (KPI highlights, segment tables, guidance, strategy, announcements, appendix) in one consistent dark-navy design. Its results-versus-guidance table and announcement layout adapt easily to other companies, and you can recreate a similar deck with 2Slides.
It is the original earnings presentation Qualcomm published on its investor relations site for its November 4, 2026 earnings call. You can download the PDF for free from this page. Figures are as reported by Qualcomm; see the company's SEC filings for audited financial statements.
GAAP net income of $13.6B includes a $5.7B income tax benefit from releasing a valuation allowance in Q2 FY26. Qualcomm removes it to reach its fixed non-GAAP tax rate of about 13%. Non-GAAP net income was $11.3B, and non-GAAP EPS was $10.54 against GAAP EPS of $12.70.
Free cash flow was $8.65B ($11.15B operating cash flow less $2.49B capex). Qualcomm returned $11.67B through $7.82B of share repurchases and $3.85B of dividends.
Official investor relations site with earnings releases, presentations and SEC filings

Create Your Own Slides
Turn your ideas into professional presentations in seconds with 2slides AI.
プロフェッショナルなデザインを参照し、スタイルを選択し、完璧なテキストレンダリングでスライドを生成。Nano Banana搭載—今すぐプレゼンテーションの作成を始めましょう。
© 2026 2slides。全著作権所有。


