
収録コレクション: 投資家向けプレゼン資料の実例
PharmaEssentia Investor Presentation November 2026 — PharmaEssentia (TWSE: 6446) reports Q3 2026 revenue of NT$ (New Taiwan dollars) 7.76 billion and 9M 2026 revenue of NT$19.7 billion, then walks through its ROPEG (ropeginterferon alfa-2b) approvals, trials and oncology/immunology pipeline.
このスライドの表紙をスタイルの参考にして、ご自身の内容からスライドを作成します。 下のページから好きな1枚を選び、そのレイアウトを参考にすることもできます。
クイックナビゲーション
タグ
スライドを共有
PharmaEssentia Investor Presentation November 2026 — PharmaEssentia (TWSE: 6446) reports Q3 2026 revenue of NT$ (New Taiwan dollars) 7.76 billion and 9M 2026 revenue of NT$19.7 billion, then walks through its ROPEG (ropeginterferon alfa-2b) approvals, trials and oncology/immunology pipeline.
レイアウト、主要コンテンツ、視覚要素を含む各スライドページの詳細ビュー。
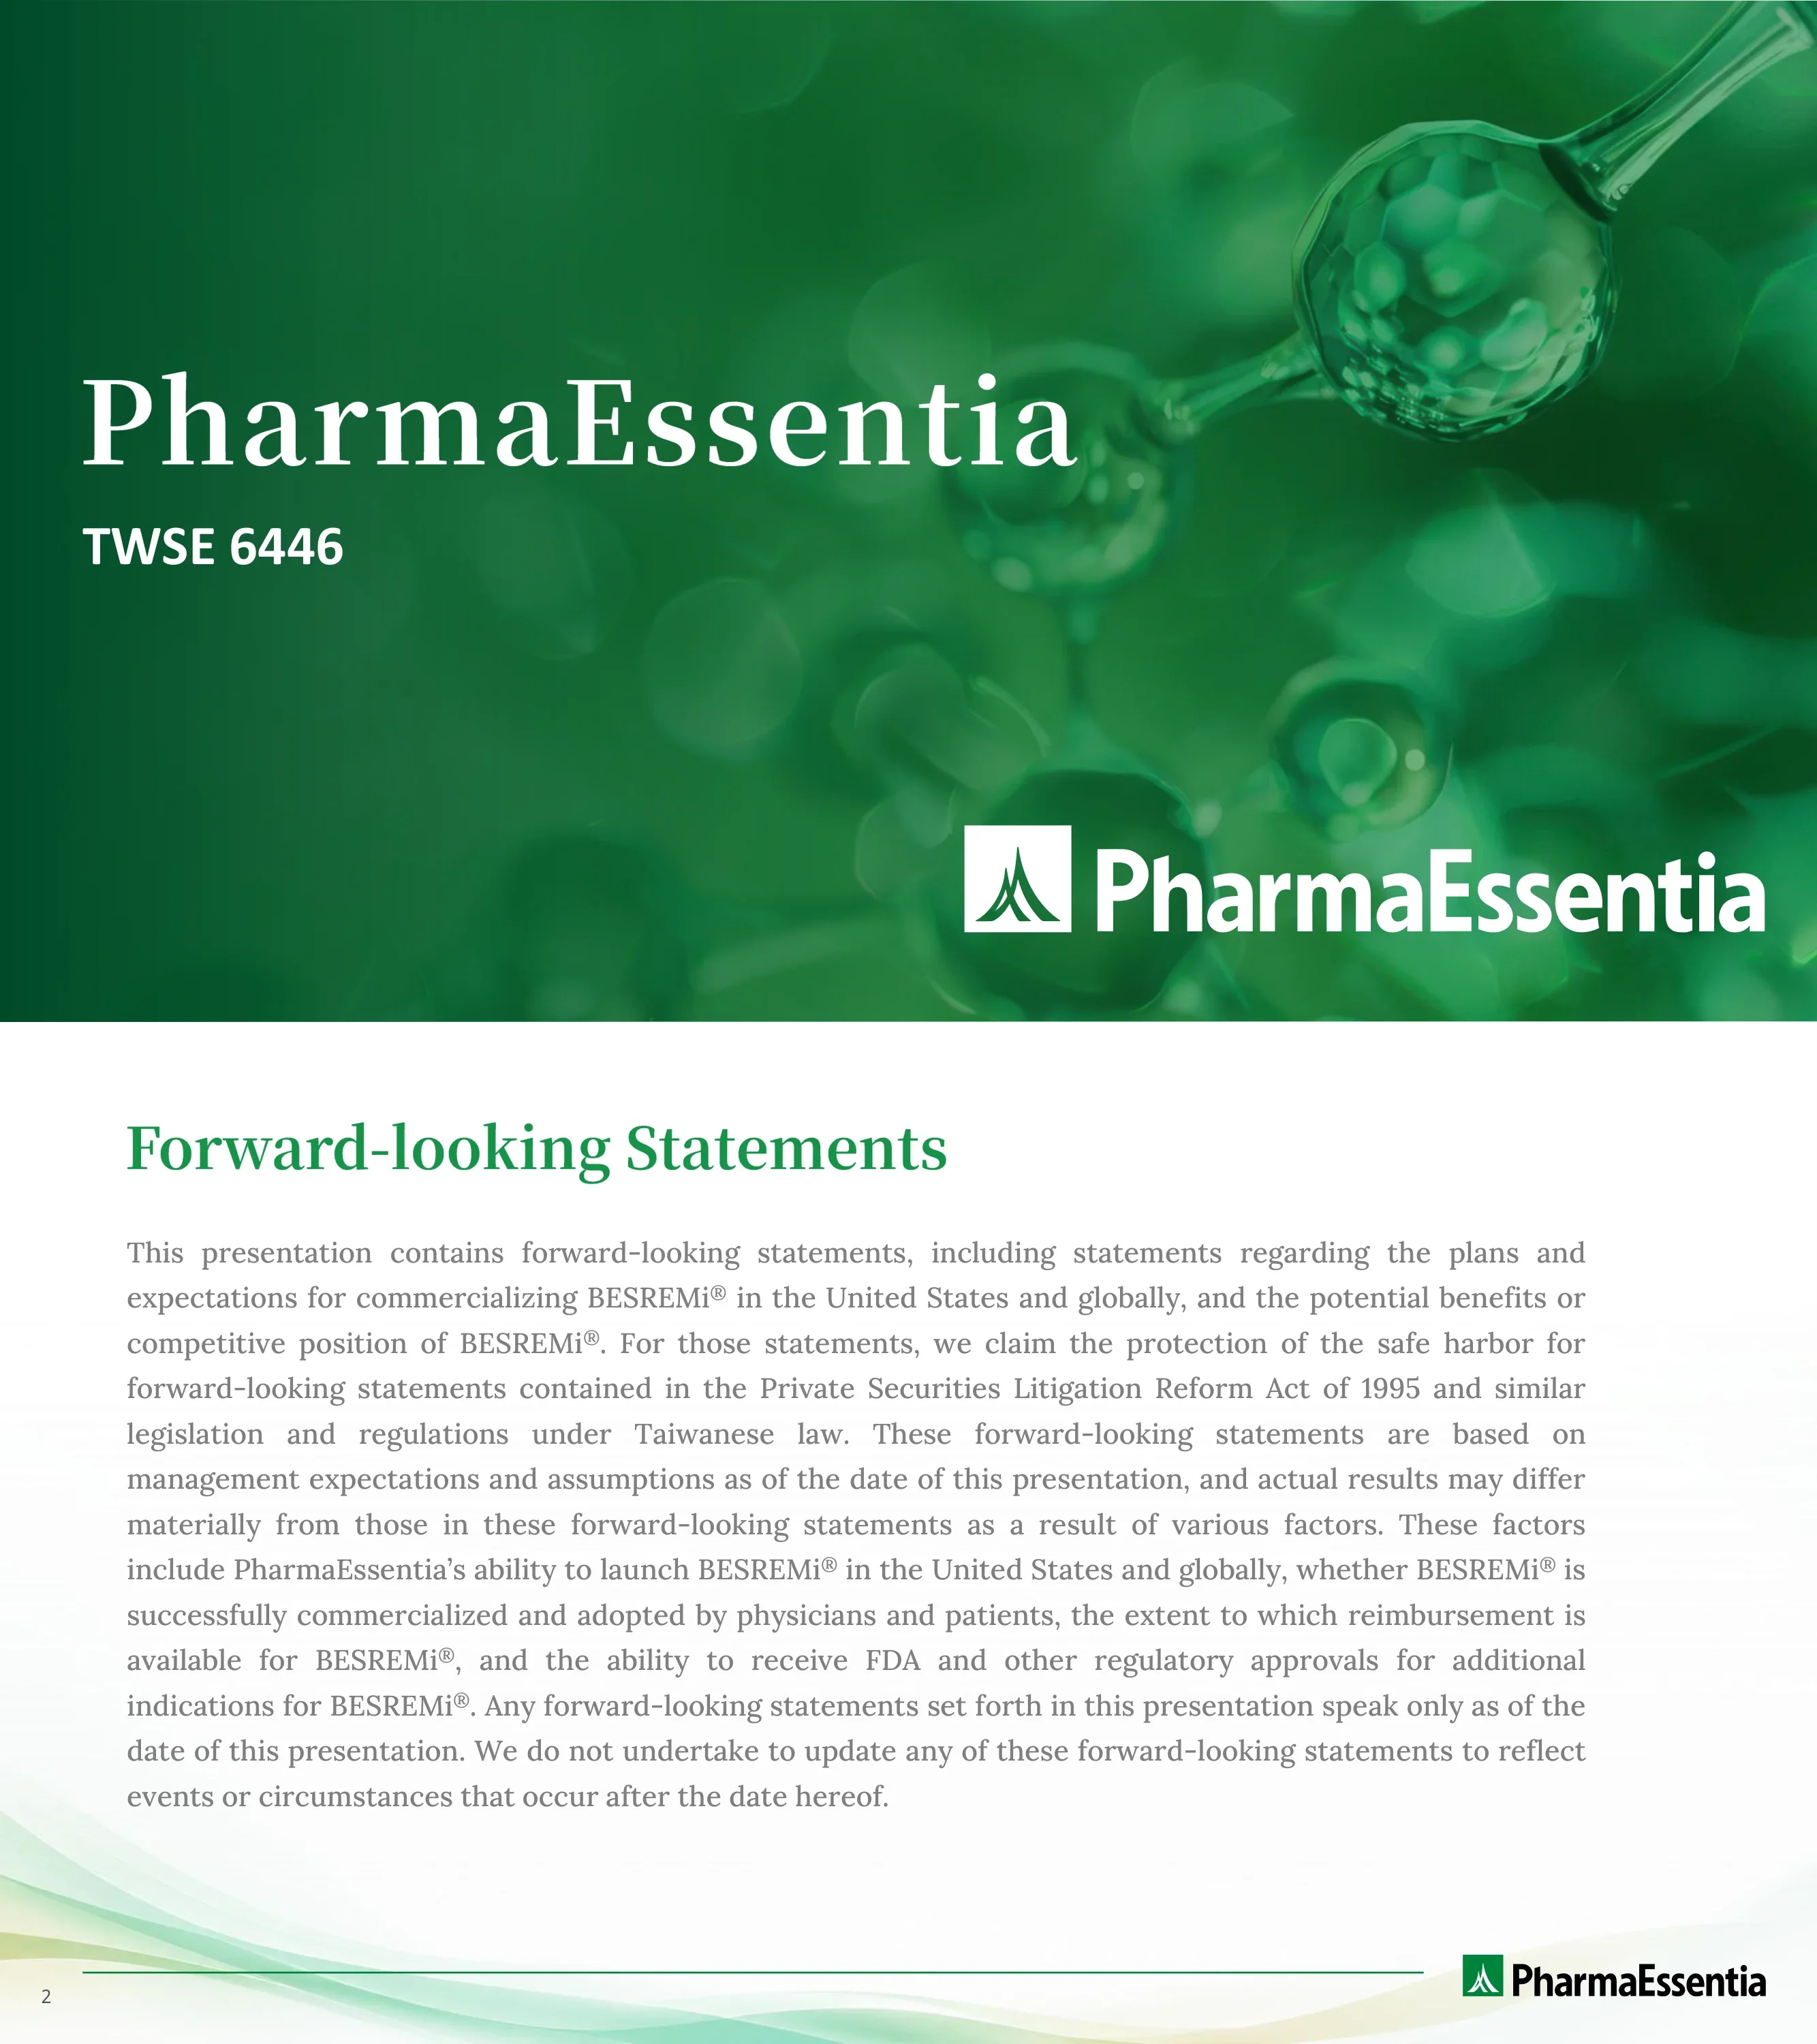
Title slide showing the company name PharmaEssentia and its Taiwan Stock Exchange code, TWSE 6446. No date is printed on the slide.
Left-aligned large serif title with ticker beneath, white logo at bottom right, full-bleed green background.
Disclaimer stating the presentation contains forward-looking statements about commercializing BESREMi in the United States and globally, claims safe harbor protection under the Private Securities Litigation Reform Act of 1995 and similar Taiwanese law, and lists risk factors such as launch ability, adoption, reimbursement and further FDA and other approvals.
Title at top left with a single justified paragraph of body text, page number at bottom left, logo bottom right.
Section divider introducing the Q3 2026 financial results part of the deck.
Centered-left large title on a full-bleed green background with logo at bottom right.
Q3 2026 revenue is NT$7.76 billion and 9M 2026 revenue surpasses FY2025 at NT$19.7B. The bar chart (unit: NTD 100 million) runs Q4'24 30.6, Q1'25 32.6, Q2'25 36.0, Q3'25 38.9, Q4'25 48.8, Q1'26 51.2, Q2'26 68.6 and Q3'26 77.6, with a YoY +100% arrow.
Two-line headline at top, eight-bar column chart below with the final bar highlighted in dark green inside a circle, a curved growth arrow across the chart.
Operating revenue rises from 38.9 to 77.6 (+99% YoY) and operating expense from 24.0 to 43.9 (+83% YoY), in NTD 100 million. The expense ratio moves from 61.6% to 56.5%, down 5.1 ppt.
Two side-by-side paired bar charts under green pill labels, YoY bubbles with arrows, expense ratio line at bottom right.
9M operating revenue rises from 107.5 to 197.4 (+84%) and operating expense from 62.5 to 101.0 (+62%), in NTD 100 million. The expense ratio falls from 58.1% to 51.2%, down 6.9 ppt.
Same two-chart layout as the previous slide with 9M'25 vs 9M'26 bars and a headline with the key numbers emphasised in large green type.
Q3 2026 operating income is NT$3.13 billion, up 168% YoY, and net profit is NT$2.92 billion, up 98% YoY. The charts show operating income 11.7 to 31.3 and net income 14.7 to 29.2 (NTD 100 million).
Two-line headline with large green figures, two paired bar charts under pill labels with YoY bubbles.
9M 2026 operating income is NT$8.37B (YoY 149%) and net income is NT$7.60B (YoY 113%). Bars show operating income 33.7 to 83.7 and net income 35.7 to 76.0 (NTD 100 million).
Same paired-bar layout as slide 7, with 9M'25 vs 9M'26 comparison and YoY bubbles.
Line chart from Q4'24 to Q3'26 with Q3'26 labels: 96.8% gross margin (YoY +5.2pp), 40.3% profit margin (YoY +10.4pp) and 37.7% operating margin (YoY -0.1pp).
Full-width line chart with three series, gridlines at 20% intervals and end-point labels in series colours at the right.
EPS by quarter (NTD): Q4'24 3.03, Q1'25 3.09, Q2'25 2.03, Q3'25 3.60, Q4'25 3.60, Q1'26 5.21, Q2'26 6.13, Q3'26 7.08, with YoY +97%. A note says EPS for 2026 Q1 and earlier periods was retrospectively adjusted for the stock dividend.
Headline over an eight-bar column chart with the final bar highlighted, a rising arrow and YoY bubble above, footnote at bottom.
Section divider introducing the company overview part of the deck.
Large left-aligned title on the green molecular background with logo at bottom right.
Describes a company covering R&D, clinical development, manufacturing and commercialization. Panels cover the commercial pipeline (ROPEG approved for adult PV, Ropeg Pen approved and launched), growth drivers (Canada PV approval in July, ET approvals in Taiwan, Japan, the U.S. and China in 2026, a Phase III trial in early-stage PMF with approval expected in 2028, more than 10 IITs) and a 2026 10M global revenue of about NTD 22.6B, YoY 86%. Also shown: operations commenced in 2003, headquarters and R&D in Taipei, and employees expected to reach 1,000 by 2026.
Dense infographic: banner header over a mountain photo, three stacked text panels on the left, a large circular revenue callout in the centre, manufacturing, headquarters and location facts on the right.
A donut chart centred on 347K US market prevalence splits into PV 163K, ET 170K and PMF 14K. PV approvals are listed by year from EMA in 2019 through Canada in 2026; ET approvals are Taiwan 2026.05.12, Japan 2026.08.24, US 2026.08.28 and China 2026.10.15; the PMF Phase 3 trial completed enrollment in H1 2026.
Central donut with three connected panels, PV approval timeline on the left, ET and PMF panels on the right.
World map marking where ROPEG is approved for PV, including Canada (July 2nd), the U.S., the EU, the Middle East, China, Korea, Taiwan, Japan, Hong Kong, Macau, Singapore, Malaysia, Brazil and Argentina; Mexico, Colombia and Vietnam are shown as application in progress.
Full-slide world map with pill-shaped country labels and pins, legend and headline at lower left.
A flow chart of NCCN treatment pathways for low-risk and high-risk PV, with a summary table for the 2025 Version 2 guideline. The slide states ropeginterferon alfa-2b-njft is the only preferred treatment in low-risk PV and the only preferred interferon in high-risk PV, with hydroxyurea and peginterferon alfa-2a listed among other options.
Left side two stacked flow diagrams (low-risk in red frame, high-risk in grey) and a right-hand two-row summary table.
A bar chart compares Ropeg and a phlebotomy-only control: treatment response 81.3 vs 50.8 (P < 0.001), hematocrit control 81.3 vs 58.7 (P = 0.006), disease progression 0 vs 12.7. A side box cites Takeda and Protagonist on 2026.08.28 regarding MIMRYLO (rusfertide). Source cited: Barbui et al. NEJM Evid. 2023.
Chart on the left with a red highlight around the disease progression group, a text card on the right, source line in the footer.
A screenshot of a Leukemia review article, published 08 April 2026, titled on a paradigm shift in the treatment of polycythemia vera and the early use of recombinant interferon-alpha. Five check-mark takeaways cover early advantage, clinical evidence of durable hematologic control, reduced mutant allele burden, immunomodulatory mechanism and paradigm shift.
Journal page screenshot on the left, five check-list items on the right, article link in footer.
States U.S. ET approval was granted on August 28, 2026. ET approval dates: Taiwan 2026.05.12, Japan 2026.08.24, U.S. 2026.08.28, China 2026.10.15; Korea marketing authorization is expected in 2027 and Singapore's application was accepted on 2026.10.12.
World map with colour-coded countries, headline at lower left, boxed list of approvals beneath and a legend at right.
The randomized, double-blind, placebo-controlled Phase 3 HOPE-PMF study of ropeginterferon alfa-2b (P1101) in pre-fibrotic/early or low to intermediate-1 risk PMF has 160 patients enrolled across the U.S., China, Taiwan, South Korea, Japan, Singapore and Canada. Randomization is 2:1 (about 100 ropeginterferon vs about 50 placebo), with dosing 250 (W0), 350 (W2) and 500 (W4) and endpoint analysis at 80W; enrollment completed in June.
Top summary card with patient count and trial description, bottom study design flow from core study box through randomization to two arms.
A MOPS-style announcement card: SEQ_NO 1, Date 115/09/18 (Republic of China calendar), Time 05:36:43. The subject line reads: Announcement of Positive DSMB Recommendation to Continue Phase III P1101 Trial for Pre-fibrotic/Early PMF or Overt PMF at Low or Intermediate-1 Risk.
White panel with a header row of three labelled fields and a subject box with a Chinese 主旨 (subject) label.
Text says ROPEG in early myelofibrosis, PMF and secondary MF showed efficacy while maintaining hemoglobin levels and reducing blood cell counts. Timeline: 2024 P1101MF results presented orally at ASH and EHA; 2025 posters at ASCO and an oral EHA presentation. Four charts show WBC, Hb, platelet and a hematological response bar chart (61.4% week 12, 63.8% week 24, 63.5% week 48, 70.0% week 104).
Left column with summary text and year-tagged conference banners, right 2x2 grid of scientific charts.
A statement that the Zhubei facility will be ready to supply more than 100,000 patients worldwide, shown beside a photo of a large glass-fronted PharmaEssentia building.
Circular green callout on the left with the figure, large building photo on the right.
Two photos of the company's Puerto Rico plant, one aerial view with the site boundary outlined and one exterior view with the PharmaEssentia sign. No figures are shown.
Title bar at top and two rounded photos side by side.
Oncology and immunology pipeline table with phase bars. PV and ET are in Commercialization; early-stage PMF shows Ph3 HOPE-PMF ongoing; ROPEG + dasatinib in CML has IND approved for Ph 1/2 (IIT); ROPEG + anti PD-1 in HCC shows Ph1 data published; AML Phase 1 ongoing (IIT); CTCL preparation for Phase 2 (IIT); CMML IND preparation for Ph2 (IIT); ROPEG + ruxolitinib in MF has IND submitted for Phase 1 (IIT).
Table with candidate and indication columns, a Gantt-style phase bar area (discovery to Phase 3) and a development update column; footnote explains abbreviations.
Background slide describing CTCL as a rare non-Hodgkin lymphoma involving the skin, with Mycosis Fungoides said to account for 60-70% of cases and Sézary Syndrome as a more aggressive subtype. The slide states it is chronic, prone to relapse and has significant unmet medical needs, and shows three clinical photographs.
Four icon-led bullets in a tinted box above a row of three clinical images under a Clinical manifestations divider.
Early-stage pipeline: PEG-IL-2 (P11838) in immunology, PEG-Cytokines in solid tumors, PD-1-IL-2v in solid tumors (planned IND in 2026), two ADC programs, Type 2 JAK2 and mCALR antibody for MPN, and KRAS TCR-T cell therapy. All others show planned IND in 2027.
Table of colour-coded modality groups with progress bars across Discovery, IND Enabling and Phase 1 columns, plus a development update column.
Four strategic forces: top-tier innovation drugs (best-in-class and first-in-class checkpoint inhibitors, TCR-T therapy, partnerships), expanding PEG platform applications, broadening ROPEG's therapeutic use (new hematologic and solid tumor indications, anti-PD-1 combinations for HCC), and becoming the global leader in MPNs.
Four horizontal bands with icons and bullet text, with a stepped 3D arrow graphic rising on the right.
Closing slide reading Thank You with the tagline Better Science, Better Lives and the PharmaEssentia logo.
Centered text over a green gradient background with a curved line graphic, logo at the bottom.
このスライドと基礎となるプレゼンテーションコンテンツに関する一般的な質問。
It covers Q3 2026 and the first nine months (9M) of 2026, with quarterly charts going back to Q4'24. Slide 12 also cites a 2026 10M global revenue of about NTD 22.6B.
It was filed on Taiwan's Market Observation Post System (MOPS) for the company's investor conference (法說會). A Chinese-language version of the presentation also exists on MOPS; this deck is the English version.
The slides show Q3 2026 revenue of NT$7.76 billion, operating income of NT$3.13 billion (YoY 168%) and net profit of NT$2.92 billion (YoY 98%). Slide 4 labels the revenue growth as YoY +100%, while slide 5 shows +99%.
9M 2026 revenue is NT$19.7B, which the slide says surpasses FY2025. Operating income is NT$8.37B (YoY 149%) and net income is NT$7.60B (YoY 113%). Q3 2026 EPS is NT$7.08, described as a new quarterly high, and 9M 2026 EPS is NT$18.43.
The deck lists PV approvals by year (EMA 2019, US 2021, Japan 2023, China, Singapore and Malaysia 2024, Brazil, Argentina and Hong Kong 2025, Canada 2026) and a map stating ROPEG is approved in 50 countries for PV. ET approvals are Taiwan 2026.05.12, Japan 2026.08.24, US 2026.08.28 and China 2026.10.15.
Slides 19 and 24 describe the Phase 3 HOPE-PMF study of ropeginterferon alfa-2b (P1101) with 160 patients enrolled and a new indication expected in 2028. Slides 24 and 26 list IIT programs and early-stage candidates with planned IND dates in 2026 and 2027.
It has 28 slides: title and forward-looking statements, a Q3'26 financial results section (slides 4 to 10), a company overview section covering ROPEG indications, approvals, clinical data and facilities, then the pipeline, a four-force growth strategy slide and a closing slide.
Yes. It shows common elements: a disclaimer, section dividers, single-metric bar charts with YoY callouts, a margin line chart, world approval maps, a clinical data slide and a phase-bar pipeline table. The slides are shown as images, so content is viewed rather than edited.

Create Your Own Slides
Turn your ideas into professional presentations in seconds with 2slides AI.
プロフェッショナルなデザインを参照し、スタイルを選択し、完璧なテキストレンダリングでスライドを生成。Nano Banana搭載—今すぐプレゼンテーションの作成を始めましょう。
© 2026 2slides。全著作権所有。


