
収録コレクション: 投資家向けプレゼン資料の実例 · 決算説明資料の実例集
Osaka Gas (Daigas Group) H1 FY2026 earnings presentation: first-half results for the fiscal year ending March 2027, a revised full-year forecast, progress on Medium-Term Management Plan 2026 and the direction of the next 2027–2030 plan. Translated summary of the Japanese-language deck filed on TDnet.
このスライドの表紙をスタイルの参考にして、ご自身の内容からスライドを作成します。 下のページから好きな1枚を選び、そのレイアウトを参考にすることもできます。
クイックナビゲーション
タグ
スライドを共有
Osaka Gas (Daigas Group) H1 FY2026 earnings presentation: first-half results for the fiscal year ending March 2027, a revised full-year forecast, progress on Medium-Term Management Plan 2026 and the direction of the next 2027–2030 plan. Translated summary of the Japanese-language deck filed on TDnet.
レイアウト、主要コンテンツ、視覚要素を含む各スライドページの詳細ビュー。
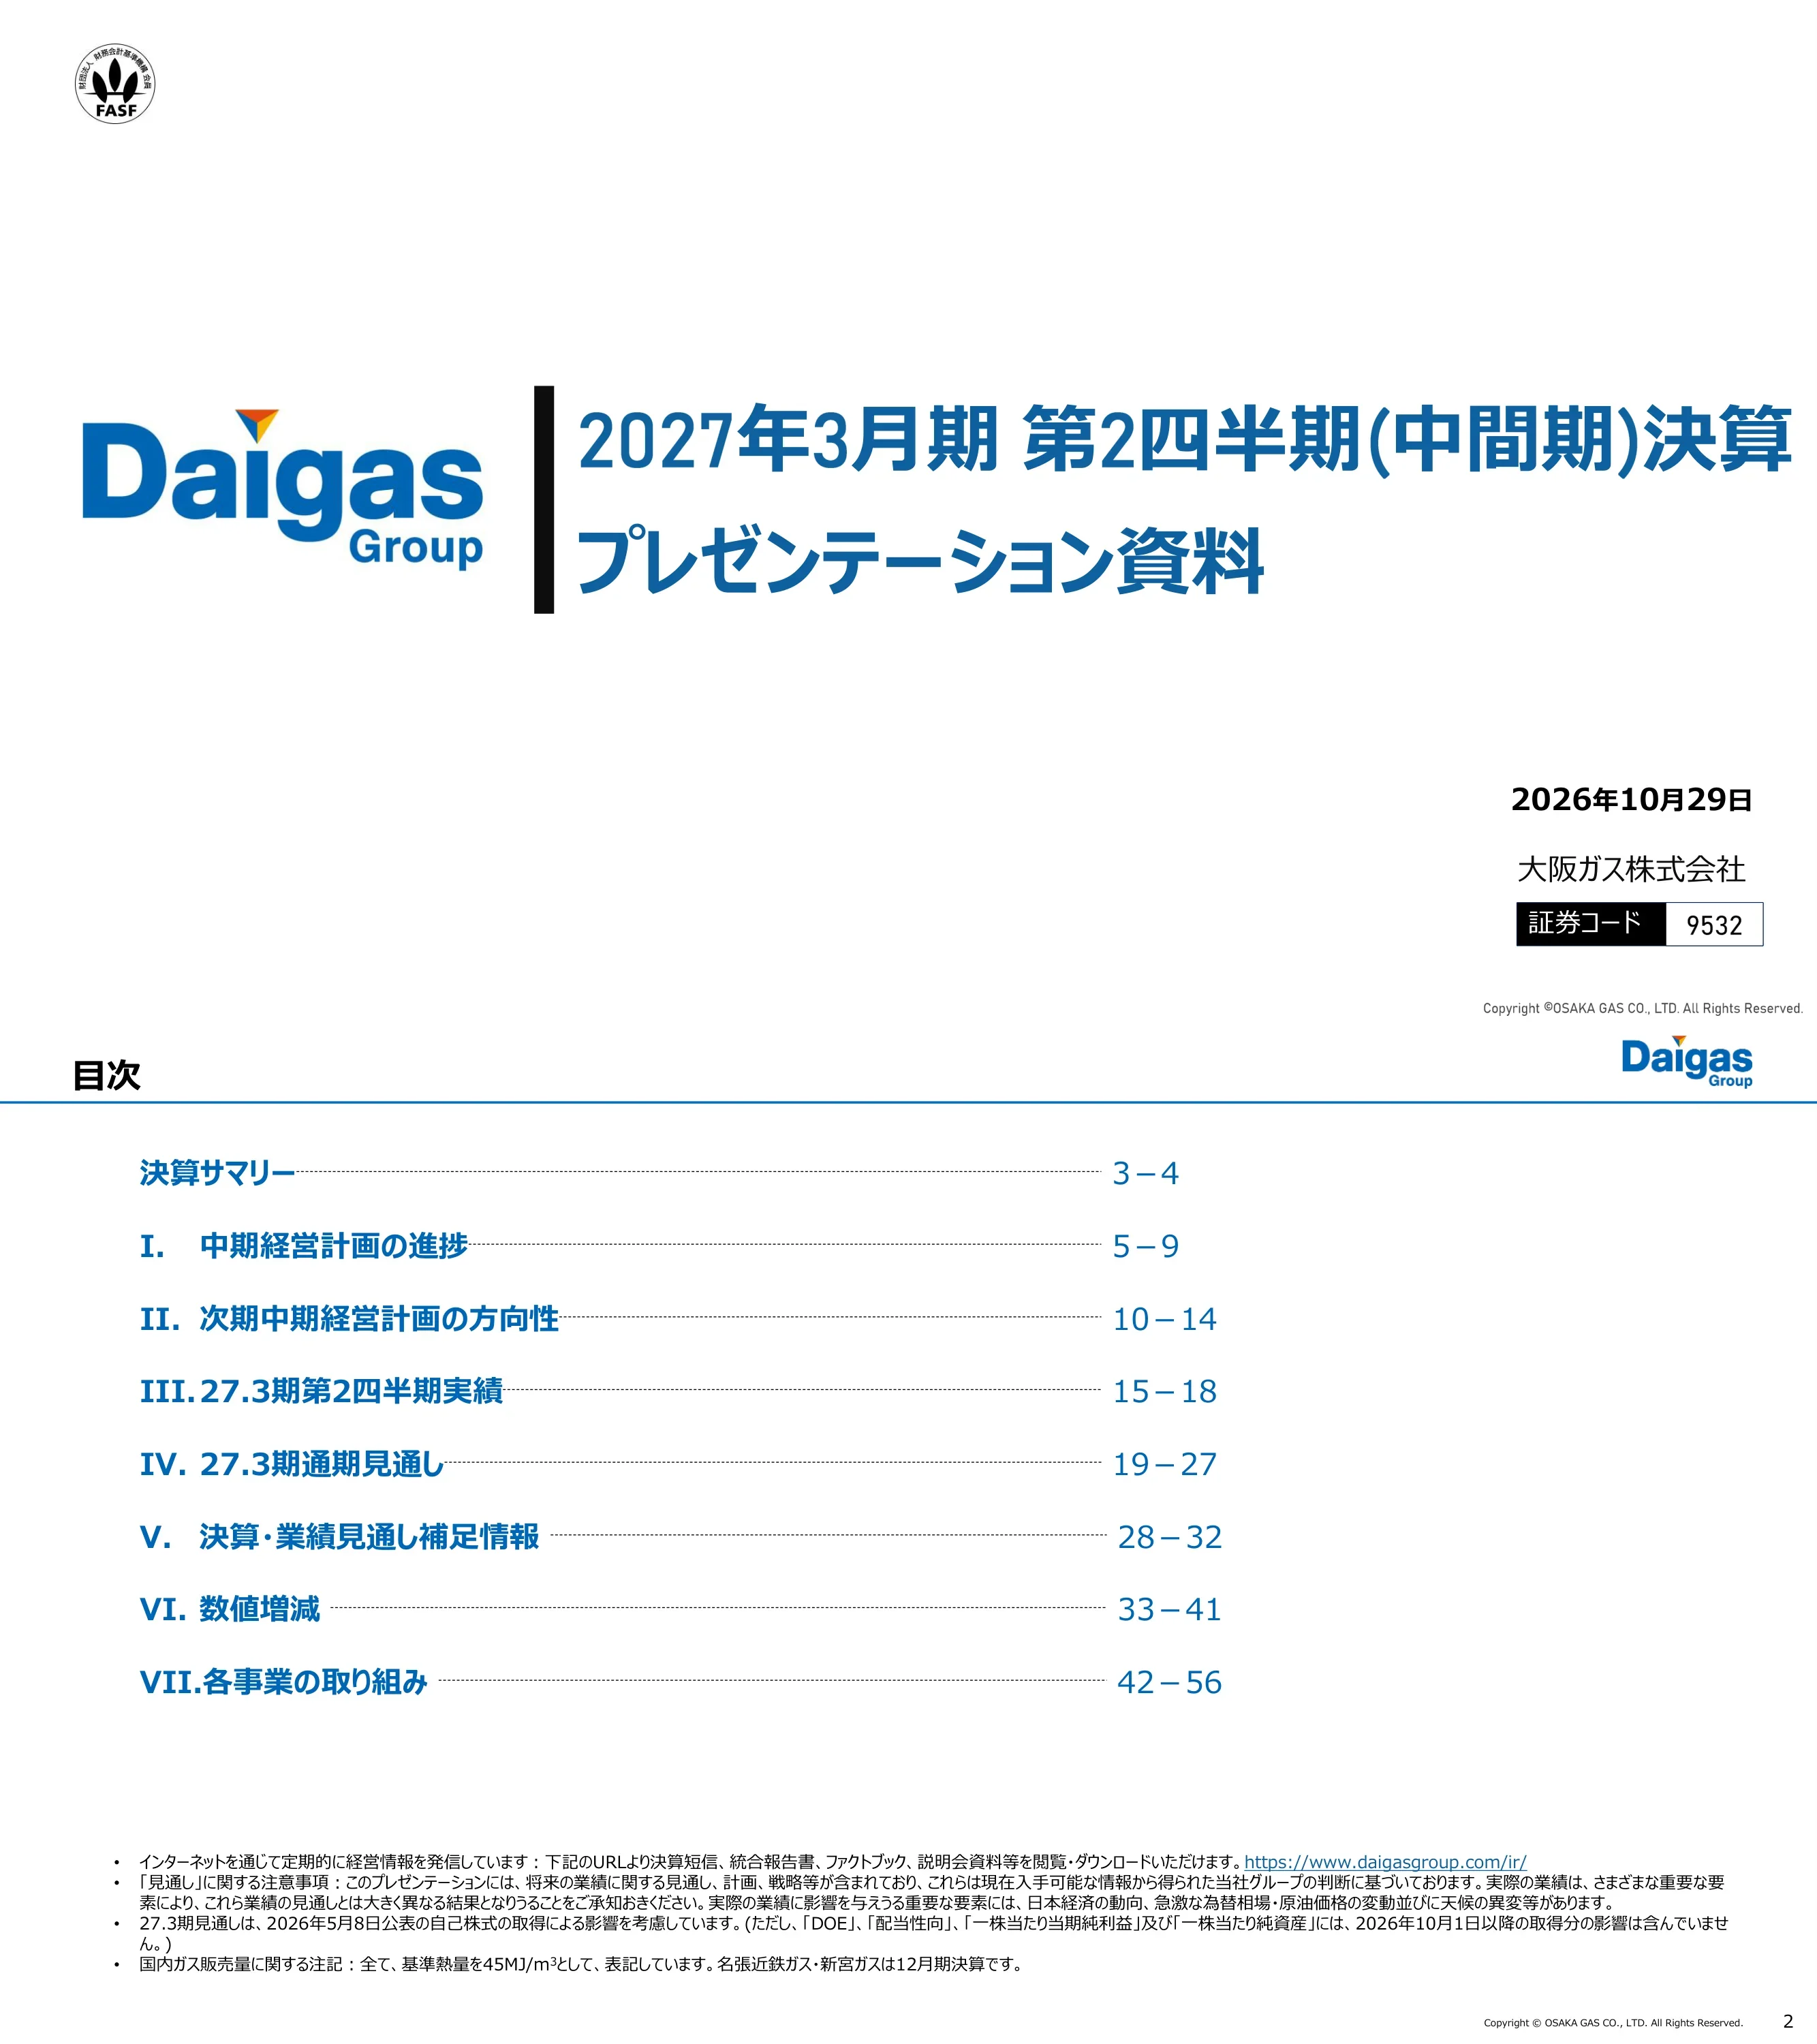
Cover slide for the Daigas Group presentation on second-quarter (interim) results for the fiscal year ending March 2027, dated October 29, 2026, issued by Osaka Gas Co., Ltd. with securities code 9532.
Logo on the left, vertical divider bar, two-line title on the right, date, company name and securities-code box bottom right; FASF membership mark top left.
Agenda: results summary (pp.3–4); I. progress of the medium-term management plan (5–9); II. direction of the next medium-term plan (10–14); III. Q2 results (15–18); IV. full-year forecast (19–27); V. supplementary information (28–32); VI. key figures (33–41); VII. business initiatives (42–56). Footnotes cite the IR site, a forward-looking-statements disclaimer, the May 8, 2026 buyback, and gas volumes stated at 45 MJ/m³.
Table of contents with dotted leader lines to page ranges; footnote bullets at the bottom.
H1 ordinary profit fell ¥22.7 billion to ¥82.7 billion (827 億円) because rising crude prices tied to the Middle East situation created time-lag losses, and net income attributable to owners fell to ¥66.6 billion from ¥94.8 billion. Excluding time lag, ordinary profit rose ¥22.2 billion to ¥108.5 billion and net income rose to ¥85.0 billion, helped by long-term LNG contracts priced competitively against the Japan LNG Cocktail (JLC) benchmark and by US and Australian businesses. The full-year forecast keeps reported ordinary profit at ¥190.0 billion and net income at ¥145.0 billion. Excluding time lag, the forecast rises to ¥226.0 billion ordinary profit (+¥29.0 billion) and ¥170.5 billion net income, with ROIC 6.2% and ROE 9.4%. Second-half assumptions are now JCC crude at $100/bbl and ¥155/$.
Two stacked sections (H1 actual, full-year forecast), each with a navy label tab, bullet commentary on the left and a two-block comparison table on the right; small assumptions table bottom left.
Because LNG supply is diversified and mostly bought under long-term contracts, the Middle East situation has had only a limited direct effect on supply. Osaka Gas holds no long-term contracts with countries whose cargoes must pass through the Strait of Hormuz, and its main suppliers are Australia, Papua New Guinea, Russia and the US. On earnings, domestic time-lag losses continue, but underlying profit benefits from competitively priced long-term LNG and higher power market prices. Sales volumes show no major impact, and Australian upstream earnings gain from higher oil prices.
Two headline bullets; left half shows a dark Asia-Pacific supply map and a pie chart of long-term versus spot procurement; right half lists earnings impacts by domestic and overseas energy.
Section divider introducing the review of Medium-Term Management Plan 2026 (FY3/25–FY3/27).
White divider slide with blue section title at left-center, logo top right and branded triangle footer band.
Ordinary profit excluding time lag is expected to grow from ¥198.0 billion in FY3/24 to ¥226.0 billion in FY3/27, an increase of ¥28.0 billion (+14.1%). Over the three years, Domestic Energy rises ¥6.2 billion (+9.8%) on gas price optimization and Himeji power sales. Overseas Energy rises ¥24.8 billion (+31.2%) on hedged US upstream production, a more stable Freeport LNG and US power value-up. Life & Business Solutions (LBS) rises ¥9.4 billion (+30.5%) on urban-development asset rotation. ROIC is forecast at 6.2% against a 5.0% target, and ROE at 9.4% against an 8.0% target.
Stacked bar chart by segment over four fiscal years with a pink growth arrow; right column lists three-year achievements by segment; ROIC/ROE forecast vs target boxes at the bottom.
Cumulative investment for FY3/25–FY3/27 is forecast at ¥886.4 billion against an original plan of ¥830.0 billion, up from ¥686.0 billion in FY3/22–FY3/24. Overseas growth investment is ¥333.5 billion versus a ¥225.0 billion plan, LBS is ¥184.5 billion versus ¥150.0 billion, Domestic is ¥137.7 billion and quality-improvement investment is ¥230.5 billion. Key projects include the Himeji natural gas power station (unit 1 from January 2026, unit 2 from May 2026), US upstream, Indian city gas and renewables, central-city property development, and the Amagasaki–Kumiyama high-pressure trunk line.
Three stacked bars (prior plan cumulative, current plan, current forecast) with segment colors; right side lists major investments by segment with colored accent bars.
Osaka Gas pays a progressive dividend that it does not cut in principle, uses a dividend-on-equity (DOE) ratio raised from 3.0% to 3.5%, and adds flexible buybacks. The annual dividend rises from ¥82.5 per share in FY3/24 to ¥130 planned for FY3/27, the seventh straight increase since FY3/20. Total returns grew from ¥20.7 billion in FY3/20 to ¥116.4 billion in FY3/26, which included a ¥70.0 billion buyback, and the FY3/27 buyback limit is ¥80.0 billion. Buybacks over the plan period total ¥190.0 billion.
Policy and achievement boxes on the left; combo chart on the right with stacked bars (dividends + buybacks) and a red DPS line, with milestone callouts for progressive dividend/DOE introduction and the DOE increase.
Operating cash flow over the plan is now expected at ¥911.0 billion, ¥91.0 billion above the ¥820.0 billion plan, helped by domestic power, US shale gas and urban development. Asset rotation includes the sale of stakes in US thermal power plants. On the cash-out side, growth investment rises to ¥656.0 billion (+¥96.0 billion) and quality investment is ¥231.0 billion. Shareholder returns are strengthened through the DOE increase and ¥190.0 billion of buybacks.
Side-by-side cash-in/cash-out block diagrams for plan versus forecast, with callout boxes explaining operating CF upside, asset rotation, growth investment and returns.
Section divider for the preview of the next medium-term management plan.
White divider slide with blue heading and branded footer.
The next plan covers four years, FY2027–FY2030 (FY3/28–FY3/31). It aims to grow profit through organic growth in each segment while investing in growth drivers for the 2030s and in resilience. Targets for the early 2030s are ROIC of about 6% and ROE of about 10%, compared with FY3/27 forecasts of 5.3%/6.2% for ROIC and 8.0%/9.4% for ROE (reported/excluding time lag). Segment ROICs are 2.3% for Domestic Energy (power growth, solutions, energy cybersecurity), 10.5% for Overseas Energy (stable US/Australia earnings, high growth in India) and 6.1% for LBS (urban development, information, materials).
Timeline ribbon from FY3/27 through the four-year plan to the early 2030s with ROIC/ROE targets; segment cards on the left and a blue chevron flow (organic growth → 2030s growth drivers → reinvestment in DX/AI) on the right.
Gas sales volume fell from 8.6 billion m³ in FY3/18 to 6.6 billion m³ in FY3/26 and is now leveling off, forecast at 6.7 billion m³. Gas supply contracts are about 5.14 million. Power sales grew from 8.9 TWh in FY3/17 to 17.2 TWh in FY3/26 and are forecast at 20.9 TWh in FY3/27, with 2.0 million power contracts. Customer accounts rose from 7.62 million to 10.89 million and are forecast at 10.98 million, against a FY3/31 goal of 11.5 million, and include more than 1.2 million accounts outside Kansai. The company plans to meet data-center and AI-driven power demand with its own generation and to cross-sell nationwide.
Three bar-chart panels (gas, power, customer accounts) with trend lines and pink forecast/target bars, each with a colored takeaway box below.
This slide maps the Daigas energy value chain: about 12.4 million tonnes of LNG handled, about 3.25 GW of domestic thermal capacity and 1.5 GW of renewables (equity share), about 64,100 km of gas pipelines, about 6.6 billion m³ of gas and 17.2 TWh of power sold, and about 10.89 million customer accounts. Growth initiatives cover three areas. To expand the business base, the company is growing LNG procurement, power trading and power sales. To lift earnings power, it is pushing renewable PPAs, solution services (Smile Selection, D-Lineup) beyond Kansai and more tariff menus. For productivity, it relies on the efficient Himeji plant and AI-native ways of working.
Left half: vertical value-chain stack (procurement, generation, supply, retail) with icons and capacity figures; right half: three initiative rows with checkmark bullets.
The financial strategy is to grow investments that keep a positive ROIC–WACC spread and to lift ROIC and ROE through cash generation and equity control, with an ROIC target of 6% in the early 2030s. Cash allocation favors strategic investment to strengthen the value chain and a progressive dividend based on DOE. A flexible capital allocation frame adds strategic investment or equity control to reach the ROE target.
Left: conceptual chart of capital efficiency versus invested capital showing value creation above WACC; right: two policy boxes joined by a plus sign and a gray flexible-allocation band.
Section divider for the first-half results.
White divider slide with blue heading.
Net sales rose ¥66.1 billion to ¥1,025.3 billion (10,253 億円) on higher power volumes. Ordinary profit fell ¥22.7 billion to ¥82.7 billion because of time-lag losses, but rose ¥22.2 billion to ¥108.5 billion excluding time lag. Net income attributable to owners was ¥66.6 billion, or ¥85.0 billion excluding time lag. EBITDA was ¥153.2 billion reported and ¥179.1 billion excluding time lag (+¥29.2 billion). EBITDA is defined as operating profit plus equity-method income plus depreciation and amortization.
Two headline bullets above a results table split into 'including time lag' and 'excluding time lag' blocks; the ordinary profit row is outlined with a P.17 link tab.
Reported ordinary profit fell from ¥105.4 billion to ¥82.7 billion. Time lag cost ¥45.0 billion (gas −¥35.1 billion, power −¥9.9 billion). Domestic Energy otherwise added ¥2.6 billion: gas margin +¥12.3 billion, power −¥11.2 billion, other +¥1.6 billion. Overseas Energy added ¥15.4 billion (US +¥10.0 billion, Australia +¥5.2 billion), LBS ¥3.6 billion and other items ¥0.5 billion. Excluding time lag, ordinary profit rose from ¥86.2 billion to ¥108.5 billion. Drivers were the JLC-relative competitiveness of long-term LNG, US and Australian upstream gains and the reversal of last year's US renewables valuation loss.
Two side-by-side waterfall charts (with and without time lag) with segment labels beneath and red/blue total arrows at the bottom.
Domestic Energy segment profit swung from ¥40.0 billion to −¥2.2 billion. Its time lag moved from +¥19.1 billion to −¥25.8 billion, with gas from +¥15.1 billion to −¥19.9 billion and power from +¥4.0 billion to −¥5.8 billion. The gas margin excluding time lag rose to ¥120.8 billion. Power profit fell to ¥1.4 billion on Himeji fixed costs and thinner trading margins, partly offset by higher market prices. Overseas Energy rose to ¥60.5 billion: US ¥51.7 billion, Australia ¥11.8 billion. LBS rose to ¥20.2 billion: urban development ¥14.1 billion on rental property sales, materials ¥4.4 billion on overseas activated carbon. Non-operating income rose ¥4.3 billion from the sale of a US thermal plant stake.
Dense variance table by segment and line item with current, prior and change columns plus a drivers column; segment bands color-coded blue, green, pink and gray.
Section divider for the full-year outlook.
White divider slide with blue heading.
The forecast was revised for Middle East-driven market moves and recent trends. Net sales are now ¥2,254.0 billion, up ¥84.0 billion because the fuel cost adjustment raises gas unit prices. Reported ordinary profit stays at ¥190.0 billion and net income at ¥145.0 billion. Excluding time lag, ordinary profit rises ¥29.0 billion to ¥226.0 billion, net income ¥20.6 billion to ¥170.5 billion and EBITDA to ¥373.0 billion. ROIC excluding time lag is 6.2% (+0.7pt) and ROE 9.4% (+1.2pt). October–March assumptions are JCC $100/bbl (+$20) and ¥155/$ (¥5 stronger yen).
Bullets above a key-metrics table (with/without time lag, revised vs previous forecast) with the ordinary profit row outlined; an assumptions table below and ROIC/EBITDA definitions at right.
Including time lag, ordinary profit stays at ¥190.0 billion. A further ¥29.0 billion time-lag loss (gas −¥23.0 billion, power −¥6.0 billion) is offset by the gas business margin (+¥13.5 billion), US Freeport LNG (+¥5.5 billion) and Australian upstream (+¥10.0 billion). Excluding time lag, the forecast rises from ¥197.0 billion to ¥226.0 billion.
Two waterfall charts side by side with segment label boxes for Domestic and Overseas Energy.
Domestic Energy is cut to ¥34.0 billion from ¥49.5 billion. The full-year time lag deepens to −¥36.0 billion (gas −¥24.0 billion, power −¥12.0 billion) because crude prices have risen and stay high, while the gas margin excluding time lag rises to ¥269.1 billion. Overseas Energy is raised to ¥104.5 billion: US ¥85.4 billion (+¥5.5 billion from Freeport LNG) and Australia ¥25.2 billion (+¥10.0 billion on oil prices). LBS is unchanged at ¥40.5 billion (urban development ¥22.8 billion, information ¥8.2 billion, materials ¥8.8 billion).
Segment variance table with revised/previous/change columns; changed rows outlined in red boxes; drivers column at right.
FY3/27 net sales are forecast at ¥2,254.0 billion, up ¥223.6 billion. Reported ordinary profit is expected to fall ¥14.5 billion to ¥190.0 billion because of time lag, but to rise ¥30.6 billion to ¥226.0 billion excluding it. Net income is ¥145.0 billion reported and ¥170.5 billion excluding time lag (+¥24.4 billion). Reported ROIC is 5.3% (6.2% excluding time lag) and ROE 8.0% (9.4%). The adjusted equity ratio is 54.3%, the adjusted D/E ratio 0.57, and the dividend rises to ¥130 from ¥120.
Bullet summary above a with/without time-lag comparison table including equity ratio, D/E and DPS rows; footnotes with definitions.
Reported ordinary profit is expected to fall from ¥204.5 billion to ¥190.0 billion. Time lag costs ¥45.1 billion (gas −¥30.2 billion, power −¥14.9 billion), partly offset by Domestic Energy (+¥7.1 billion: gas margin +¥18.0 billion, power −¥14.0 billion, other +¥3.1 billion), Overseas Energy (+¥16.1 billion: US +¥4.8 billion, Australia +¥10.7 billion), LBS (+¥3.0 billion) and other items (+¥4.2 billion). Excluding time lag, ordinary profit rises from ¥195.3 billion to ¥226.0 billion.
Two waterfall charts (with and without time lag) with segment labels and total arrows.
Domestic Energy is forecast at ¥34.0 billion versus ¥71.9 billion. Its time lag swings from +¥9.1 billion to −¥36.0 billion, the gas margin excluding time lag rises to ¥269.1 billion on LNG competitiveness and volume, and power profit falls to ¥12.5 billion from ¥26.5 billion. Overseas Energy rises to ¥104.5 billion: the US reaches ¥85.4 billion as last year's renewables valuation loss reverses, offset by lower US thermal power profit, and Australia reaches ¥25.2 billion. LBS rises to ¥40.5 billion, mainly from materials (+¥3.2 billion, overseas activated carbon). Non-operating income includes the US thermal plant stake sale.
Variance table by segment with forecast, prior actual, change and driver columns.
H1 growth investment was ¥92.0 billion (Domestic ¥19.2 billion, Overseas ¥37.7 billion, LBS ¥34.9 billion), against ¥101.3 billion a year earlier. The full-year plan is ¥243.0 billion: ¥52.0 billion for power plants (gas-fired and renewables), ¥116.0 billion for US upstream (Sabine) and ¥75.0 billion for urban development. Financial soundness stays within MTP 2026 thresholds (equity ratio of at least 45%, D/E of at most 0.8). The adjusted equity ratio is 54.8% at H1 and 54.3% forecast for year-end, and the adjusted D/E is 0.54 and 0.57.
Left: stacked bar chart of growth investment by segment with labeled callouts; right: financial soundness indicator table.
H1 domestic gas sales were 2,947 million m³ (residential 554, commercial and other 2,393), with a full-year forecast of 6,692 million m³ and 5.17 million gas customers. H1 power sales rose to 8,977 million kWh (retail 3,656, wholesale 5,322), with a full-year forecast of 20,932 million kWh and 1.97 million low-voltage customers. US shale gas production rose to 2.13 million tonnes from 1.76 million, with a full-year forecast of 4.0 million tonnes. India city gas sales, from a minority stake, rose to 367 million m³ from 257 million, with a full-year forecast of 820 million m³.
Four quadrants: two navy-headed panels with stacked bars and data tables (gas, power) on top; two green-headed simple bar charts (US shale, India) below; footnotes at right.
Section divider for supplementary materials.
White divider slide with blue heading.
A 1°C rise in air and water temperature cuts residential gas volume by about 7%. For changes from October 1, 2026, each +$1/bbl in JCC crude lowers consolidated ordinary profit by ¥1.15 billion including time lag and by ¥0.21 billion excluding it: Overseas Energy gains while Domestic Energy loses. A ¥1 weaker yen per dollar lowers ordinary profit by ¥1.0 billion including time lag but raises it by ¥0.24 billion excluding time lag. The assumptions are JCC $100/bbl and ¥155/$.
Three labeled blocks: temperature sensitivity row, crude/FX sensitivity table by segment, and an assumptions table.
The fuel cost adjustment system passes changes in raw-material costs, driven by FX and crude prices, through to gas tariffs, which limits the long-term earnings impact. Each month the three-month average fuel price, based on LNG/LPG trade statistics, is compared with a base price and reflected in tariffs three months later. Pass-through can therefore lag by up to five months, creating time-lag losses within a fiscal year when prices rise and time-lag gains when they fall. In the model case, costs follow JCC by about three months and tariffs follow by about two more months.
Explanation bullets with a month-grid table on the right; lower half pairs a bullet explanation with a stepped line diagram of cost versus tariff showing red loss and blue gain areas.
Monthly JCC in FY3/27 ran at about $100–117/bbl, against about $66–79 a year earlier. The yen was about ¥156–163/$, against ¥145–159. Quarterly time lag: FY3/25 +¥4.2 billion; FY3/26 +¥9.1 billion (gas +¥6.2 billion, power +¥2.9 billion); FY3/27 Q1 −¥7.7 billion and Q2 −¥18.1 billion, for an H1 total of −¥25.8 billion (gas −¥19.9 billion, power −¥5.8 billion). The full-year forecast is −¥36.0 billion. A stylized chart shows gas revenue lagging cost across the three fiscal years.
Two line charts (JCC and FX) with assumption callouts on top; quarterly time-lag table in the middle; illustrative revenue vs cost curve chart at the bottom.
Total assets were ¥3,520.6 billion at H1, up from ¥3,321.4 billion at FY3/26 year-end. Current assets were ¥977.9 billion, fixed assets ¥2,542.7 billion and net assets ¥1,887.8 billion. Interest-bearing debt rose ¥181.2 billion to ¥1,122.0 billion. The equity ratio was 52.3% (adjusted 54.8%) and D/E 0.61 (adjusted 0.54). Accumulated other comprehensive income rose to ¥487.9 billion, including ¥252.5 billion of foreign currency translation adjustments and ¥94.6 billion of deferred hedge gains.
Three side-by-side balance sheet block diagrams with arrows between periods; ratio tables beneath; boxed reference table of accumulated other comprehensive income at right.
Section divider for the appendix of key figures and variances.
White divider slide with blue heading.
H1 net sales were ¥1,025.3 billion (+6.9%). Operating profit fell 32.8% to ¥60.2 billion, ordinary profit fell 21.6% to ¥82.7 billion (excluding time lag +25.8% to ¥108.5 billion) and net income fell 29.8% to ¥66.6 billion. Operating cash flow was ¥123.0 billion and free cash flow ¥11.0 billion. For the full year, the company forecasts net sales of ¥2,254.0 billion (+11.0%), operating profit of ¥150.0 billion, ordinary profit of ¥190.0 billion and net income of ¥145.0 billion. It also expects total assets of ¥3,484.9 billion, interest-bearing debt of ¥1,150.0 billion, operating CF of ¥287.0 billion, investment of ¥320.0 billion and free cash flow of −¥33.0 billion.
Wide two-part table: H1 actual vs prior on the left, full-year actual/previous/revised forecast on the right, grouped into P/L, B/S, cash flow and time-lag sections.
H1 ROE was 3.7% (4.7% excluding time lag) and ROIC 2.3% (3.0%). For the full year, the company forecasts ROE of 8.0%/9.4%, ROIC of 5.3%/6.2%, NOPAT of ¥150.4 billion and invested capital of ¥2,944.2 billion. It also forecasts DOE of 3.6% and a payout ratio of 33.9%. EPS is forecast at ¥383.02, BPS at ¥4,819.26 and DPS at ¥130 (H1 dividend ¥65). The group has 22,330 employees, 148 consolidated subsidiaries and 47 equity-method affiliates.
Two-part indicator table (H1 and full year) with ratio rows, per-share data and headcount; definitions in footnotes.
H1 investment was ¥116.8 billion: quality-improvement ¥24.7 billion and growth ¥92.0 billion, of which ¥19.2 billion went to Domestic, ¥37.7 billion to Overseas and ¥34.9 billion to LBS. The full-year plan is ¥320.0 billion, including ¥243.0 billion of growth investment and ¥260.0 billion of capex. JCC averaged $108.1/bbl in H1 against $73.7 a year earlier, with a full-year forecast of $104.2. The yen averaged ¥159.5/$, with a full-year forecast of ¥157.2. Monthly JCC was $101.9–117.2 from April to September 2026.
Investment table (H1 and full year), assumptions table, and a monthly crude/FX grid for both fiscal years.
H1 segment sales were ¥815.1 billion for Domestic Energy (+5.1%), ¥80.3 billion for Overseas Energy (+15.6%) and ¥165.9 billion for LBS (+13.3%). H1 segment profit was ¥76.9 billion: Domestic −¥2.2 billion, Overseas ¥60.5 billion, LBS ¥20.2 billion. Full-year segment profit is forecast at ¥182.0 billion: Domestic ¥34.0 billion, Overseas ¥104.5 billion, LBS ¥40.5 billion, with equity-method income of ¥32.0 billion. Forecast segment ROIC is 2.3% for Domestic (down from 4.6%), 10.5% for Overseas (up from 8.0%) and 6.1% for LBS.
Three stacked table blocks (sales/ordinary profit, segment profit, ROIC) with H1 and full-year columns.
Domestic Energy segment profit was −¥2.2 billion in H1, or ¥23.5 billion excluding time lag (+12.9%). Power profit was −¥4.4 billion, or ¥1.4 billion excluding time lag. The full-year forecast is ¥34.0 billion, or ¥70.0 billion excluding time lag. Subsidiary H1 sales: Osaka Gas ¥723.5 billion, Osaka Gas Network ¥96.2 billion, Osaka Gas Marketing ¥30.3 billion, Daigas Energy ¥36.1 billion and Osaka Gas International Transport ¥19.4 billion. Their segment profits were Osaka Gas −¥3.2 billion, Network −¥7.0 billion, Marketing ¥3.9 billion, Daigas Energy ¥3.4 billion and International Transport −¥0.1 billion.
Blue-headed table in three blocks: segment profit, sales by subsidiary, segment profit by subsidiary.
H1 domestic gas volume was 2,947 million m³ (−2.9%). Residential volume rose 2.4% to 554 million m³ on customer count. Commercial and other volume fell 4.0% to 2,393 million m³: demand development added 22 million m³, while weather took away 31 million m³ and individual factors 73 million m³. The full-year gas forecast is 6,692 million m³ (+2.0%) with 5.14 million supply contracts. H1 power volume rose 10.3% to 8,977 million kWh, with retail down 5.7% to 3,656 and wholesale up 24.8% to 5,322. The full-year power forecast is 20,932 million kWh (+21.4%), with low-voltage customers reaching 2.0 million.
Wide volume table with prior and current Q1/Q2/full-year columns and change columns broken down by driver.
Customer accounts reached 10.973 million at H1 (+1.8%), split into 5.554 million gas, 2.566 million power and 2.853 million other, with a full-year forecast of 10.98 million. On a non-consolidated basis, H1 gas sales were ¥315.7 billion, raw-material costs ¥214.8 billion and gas gross margin ¥100.8 billion, or ¥120.8 billion excluding time lag. Full-year gas gross margin is forecast at ¥245.1 billion, or ¥269.1 billion excluding time lag. The average H1 temperature was 24.4°C, 0.7°C cooler than a year earlier, and the slide includes Osaka monthly temperatures.
Four blue-headed tables: customer accounts, gas business gross margin, average temperature, and Osaka monthly temperatures.
Overseas Energy segment profit was ¥60.5 billion in H1 (+34.1%; operating profit ¥41.6 billion, equity-method ¥18.9 billion) and is forecast at ¥104.5 billion for the full year. US H1 profit was ¥51.7 billion, including ¥8.9 billion from US thermal power, and is forecast at ¥85.4 billion. Australia was ¥11.8 billion (+79.6%), with ¥25.2 billion forecast. LBS segment profit was ¥20.2 billion (+22.0%), with ¥40.5 billion forecast. Urban development earned ¥14.1 billion on ¥48.2 billion of sales, information ¥1.9 billion on ¥48.4 billion and materials ¥4.4 billion on ¥71.7 billion.
Green-headed Overseas Energy table above a pink-headed LBS table, each with sales and segment profit blocks for H1 and full year.
Section divider introducing business-by-business strategy pages.
White divider slide with blue heading.
Osaka Gas presents its strength as a portfolio that treats the whole value chain as one and combines areas to earn stable profit. At the core, Domestic Energy covers LNG procurement and trading, gas manufacturing, generation, renewables, the network and retail/wholesale. Overseas Energy (high ROIC and a natural hedge for domestic earnings) covers US shale gas, Freeport LNG, US power, Australian upstream, and Indian city gas and renewables. LBS covers materials, information and urban development, drawing on the domestic brand and know-how.
Concentric ellipse diagram: blue domestic core, green overseas ring above, pink LBS ring below, with an upstream-to-downstream arrow and outward growth arrows.
In the residential market, switching among existing customers is declining but competition continues when people move. New entrants hold about 21.7% of Kansai residential gas volume, flat at around 20%. In the commercial and industrial market, demand for fuel switching, energy saving and labor saving is rising, supported by Japan's 7th Strategic Energy Plan and a 2024 subsidy. Initiatives include cross-selling and nationwide expansion. Offerings include household services (Sumikata support, Smile-Roof solar), gas equipment (ENE-FARM, cogeneration), D-Lineup B2B solutions, renewable power and off-site PPAs, with a push into the Tokyo area.
Upper half: market environment with a line chart of new-entrant share and policy notes; lower half: layered matrix of energy, gas equipment and services against in-area/out-of-area expansion with yellow arrows.
Himeji natural gas power station units 1 and 2 began operation in 2026, with up to 64% efficiency (+7pt versus the Senboku units), which lowers generation costs and improves resilience to market volatility. Equity generation capacity including renewables reached 4.79 GW at September 2026, up from 3.04 GW in FY3/24. Power profit excluding time lag was ¥17.5 billion in FY3/24, ¥39.8 billion in FY3/25 and ¥26.5 billion in FY3/26. It is expected to dip in FY3/27 on market rule changes and Himeji fixed costs before rising toward the FY3/31 target as Himeji contributes.
Initiative bullets on top; two charts below: stacked capacity bars (thermal vs renewables) and a profit bar chart with an explanatory callout and target bar.
Rising power demand from data centers and growing LNG exports are expected to keep lifting US gas demand and production through 2050, according to EIA's Annual Energy Outlook 2026. Henry Hub futures (CME, as of September 30, 2026) are expected to stay mostly between the upper-$3 and lower-$4/MMBtu range through 2035, with seasonal swings.
Two side-by-side market charts with gray headers: demand vs production line chart and Henry Hub futures line chart with a shaded band.
In 2019 Osaka Gas became the first Japanese company to buy 100% of a US shale gas developer, Sabine, which operates in East Texas and North Louisiana with nearby pipelines and LNG export and petrochemical demand. The company hedges 70–80% of annual sales volume at the start of each year and raises output when prices are high. Production rose from 1.7 million tonnes per year (LNG equivalent) in FY3/20 to 3.9 million in FY3/26, with 4.0 million forecast for FY3/27. Acreage grew from about 1,000 km² to about 2,100 km² in 2025, and the company aims to keep about ten years of drilling inventory.
Left: bullets plus a map of the acreage and advantages list; right: hedging strategy bullets, a bar-and-line chart of production vs Henry Hub price, and acreage growth circles.
AI data centers are lifting PJM power demand, and PJM capacity prices jumped from $49 to $269 and then about $325–333/MW-day, clearing at the cap. US thermal power profit rose from ¥1.7 billion in FY3/21 to ¥18.9 billion in FY3/26, with ¥15.1 billion forecast for FY3/27. Osaka Gas is concentrating on competitive plants. It now holds three plants totaling 1,227 MW: Fairview (PJM, 525 MW), Three Rivers (PJM, 313 MW) and Towantic (ISO-NE, 389 MW). It has sold Whitewater, the Michigan/Lakewood/Clean/Shore group and St. Charles/Saranac.
Upper half: two market charts (PJM demand and capacity price); lower half: initiative bullets, a profit bar chart and a power plant list table.
India aims to raise natural gas from 6% to 15% of primary energy by 2030. Gas demand is projected to grow from 68.3 billion m³ in 2024 to 180.7 billion m³ in 2040, with city gas up about 2.6 times to 79.0 billion m³, led by transport (CNG). Osaka Gas entered in 2021 through Osaka Gas Singapore with JOIN, taking a stake in a holding company led by I Squared Capital, as the first Japanese company in Indian city gas. It invested more in 2024 through a consortium with Sumitomo Corporation, JOIN and Konoike Transport. It is the only city-gas operator among the investors, and it supports the THINK GAS brand.
Market environment row with a policy box and two bar charts; lower half covers entry history text and a THINK GAS business diagram.
Think Gas holds exclusive rights in 19 areas covering about 320,000 km², roughly 10% of India's land and about 90% of Japan's area. Its sales volume grew from 150 million m³ in FY3/24 to 570 million m³ in FY3/26 and is forecast at 820 million m³. The target is 3.5 billion m³ in the early 2030s, about half of Osaka Gas's domestic volume, with about ¥10.0 billion of equity-share ordinary profit. Transport takes about 70% of volume, and CNG stations grew from 192 in 2021 to 531 in 2025. In renewables, Osaka Gas has partnered with Clean Max since 2025 and targets 400 MW of assets by FY3/29.
Bullets with an India map of licensed areas; bar chart of sales volume vs target; CNG panel with station count circles and photo; renewables section with a solar/wind photo.
LBS is a stable earnings source independent of energy prices that applies energy-business know-how to spread risk. Its profit rose to ¥37.4 billion in FY3/26 and is forecast at ¥40.5 billion in FY3/27. Urban development covers condominiums and rental housing, offices and logistics, operations and sales to private REITs. Materials draws on coal-chemistry know-how for fine materials, carbon fiber, activated carbon, silica-alumina materials and preservatives. Information solutions provides IT services, expanded through M&A in finance and manufacturing systems.
Stacked bar chart of LBS profit by business on the left; three colored business label boxes with bullets on the right.
Japan's population is projected to fall to about 85% of its 2020 level by 2045. The focus areas, Osaka's three central wards and Tokyo's central five, Joto three and Jonan three wards, are expected to grow to about 105–113. Single and couple-only households in Osaka City and Tokyo's 23 wards, the target customers, are expected to stay high or keep rising (IPSS and local government data).
Large population line chart on the left; two household projection bar-and-line charts stacked on the right.
The group develops condominiums and rental housing end to end in Kansai and central Tokyo, with about 250 properties and 17,000 units supplied to date. These properties contribute about 5.8 million m³ per year of gas sales and use products such as Kanta-kun dryers and ENE-FARM. Sales to a private REIT are planned to grow from about ¥20 billion of assets (FY3/24) to about ¥50 billion (FY3/27) and ¥100 billion (FY3/31). Examples include Grand Green Osaka (3,000 kW cogeneration, 5,000 RT district heating and cooling, ENE-FARM in 1,040 condo units) and the MFLP/OGUD Osaka Nishijima logistics facility (2024) with D-solar panels.
Left column: housing business bullets with building photos and a private REIT asset bar chart; right column: two rounded case-study cards with aerial photos.
The core activated carbon business is adding capacity to meet growing purification demand and aims to grow in regeneration services and ion-exchange resins, while also looking at carbon-neutral uses of advanced carbon materials such as biogas. Materials segment profit rose from about ¥4.0 billion in FY3/15 after the Jacobi acquisition to about ¥8.8 billion forecast for FY3/27. The business draws on coal by-products from gas manufacturing and on acquisitions from Takeda (preservatives, activated carbon), Jacobi, Mizusawa Industrial Chemicals and Chuo Silika. Products include lens resins, wood coatings (Xyladecor), molded insulation, activated carbon and anti-blocking additives.
Initiative bullets with a red-headed bar chart at right; lower section lists business lines with product photos.
Japanese corporate IT investment is rising with legacy modernization and AI. The top reasons for higher IT budgets are system renewal (60.3%), yen weakness and vendor price increases (45.6%), cloud services (44.9%), AI (43.7%) and digitalization (39.7%). The group runs about 600 internal systems, and information-business sales split about 40% internal and 60% external. At OGIS-RI, about 1,600 external clients are 42% manufacturing, 24% finance, 14% public/utilities/energy, 6% transport and 14% other (FY2023). The plan is to use AI for productivity and to specialize in strong industries.
Market charts on top (IT investment bar-and-line, IT budget reasons bars); initiative bullets below with a 4:6 internal/external split graphic and a donut chart of client mix.
This slide lists links to the Daigas Group IR site (daigasgroup.com/ir) and related documents: the FY2026 business plan (March 2026), Fact Book 2026 (October 2026), Integrated Report 2026 (July 2026), Energy Transition 2050 (February 2025, with video explainers) and Medium-Term Management Plan 2026 (March 2024).
Two-column table of document names with publication dates and hyperlinked navigation paths.
Closing slide with the centered Daigas Group logo.
Centered logo with a multicolor triangle mosaic bottom left and a navy band along the bottom.
このスライドと基礎となるプレゼンテーションコンテンツに関する一般的な質問。
It is the Daigas Group (Osaka Gas Co., Ltd., TSE: 9532) presentation of interim results for the first half of the fiscal year ending March 2027, released October 29, 2026. Its 57 slides cover the results summary, Medium-Term Management Plan progress, the direction of the 2027–2030 plan, Q2 results, the revised full-year forecast, supplementary data and business-by-business initiatives.
Yes. The original is a Japanese-language earnings presentation (決算説明会資料), titled 'Daigasグループ 2027年3月期 第2四半期決算 プレゼンテーション資料'. It was disclosed on TDnet, the Tokyo Stock Exchange's timely disclosure system. This page gives an English page-by-page summary, and the downloadable PDF is the original Japanese file.
Osaka Gas's fiscal year runs from April to March. The year from April 2026 to March 2027 is labeled FY2026 here and '27.3期' (FY3/27) in the deck. H1 means April–September 2026.
H1 net sales were ¥1,025.3 billion (10,253 億円). Ordinary profit was ¥82.7 billion, down ¥22.7 billion because of time-lag losses, but ¥108.5 billion excluding time lag (+¥22.2 billion). Net income attributable to owners was ¥66.6 billion. The full-year forecast is ¥190.0 billion ordinary profit and ¥145.0 billion net income. Excluding time lag, it is ¥226.0 billion and ¥170.5 billion, with ROIC 6.2% and ROE 9.4%.
Under Japan's fuel cost adjustment system, changes in LNG costs are passed through to gas tariffs with a delay of up to about five months. When crude prices rise, as in 2026, costs rise before tariffs do and the company books temporary time-lag losses. When prices fall, it books gains. Osaka Gas shows every key metric both including and excluding this effect.
The dividend is progressive (not cut in principle) with a DOE target of 3.5%. The FY3/27 annual dividend is planned at ¥130 per share, the seventh straight increase since FY3/20, and up to ¥80.0 billion of buybacks is authorized. Buybacks over the current plan total ¥190.0 billion.
The next plan covers FY2027–FY2030. It targets ROIC of about 6% and ROE of about 10% in the early 2030s through organic growth in Domestic Energy, Overseas Energy (US, Australia, India) and LBS. It also invests in growth drivers for the 2030s, in resilience and in DX/AI.
Yes. The page offers the original PDF and an editable PPTX converted from it. The layouts include waterfall bridges, with/without adjustment tables, KPI dashboards, value-chain diagrams and case-study cards, which can be reused as references for an earnings presentation. The slide text in the PPTX is in Japanese.
Original Japanese-language presentation disclosed on TDnet on October 29, 2026.
Official IR site with earnings releases, fact book, integrated report and medium-term plan.

Create Your Own Slides
Turn your ideas into professional presentations in seconds with 2slides AI.
プロフェッショナルなデザインを参照し、スタイルを選択し、完璧なテキストレンダリングでスライドを生成。Nano Banana搭載—今すぐプレゼンテーションの作成を始めましょう。
© 2026 2slides。全著作権所有。


