
NXP Semiconductors Q2 2026 Earnings Presentation
クイックナビゲーション
タグ
スライドを共有
NXP Semiconductors Q2 2026 Earnings Presentation
レイアウト、主要コンテンツ、視覚要素を含む各スライドページの詳細ビュー。
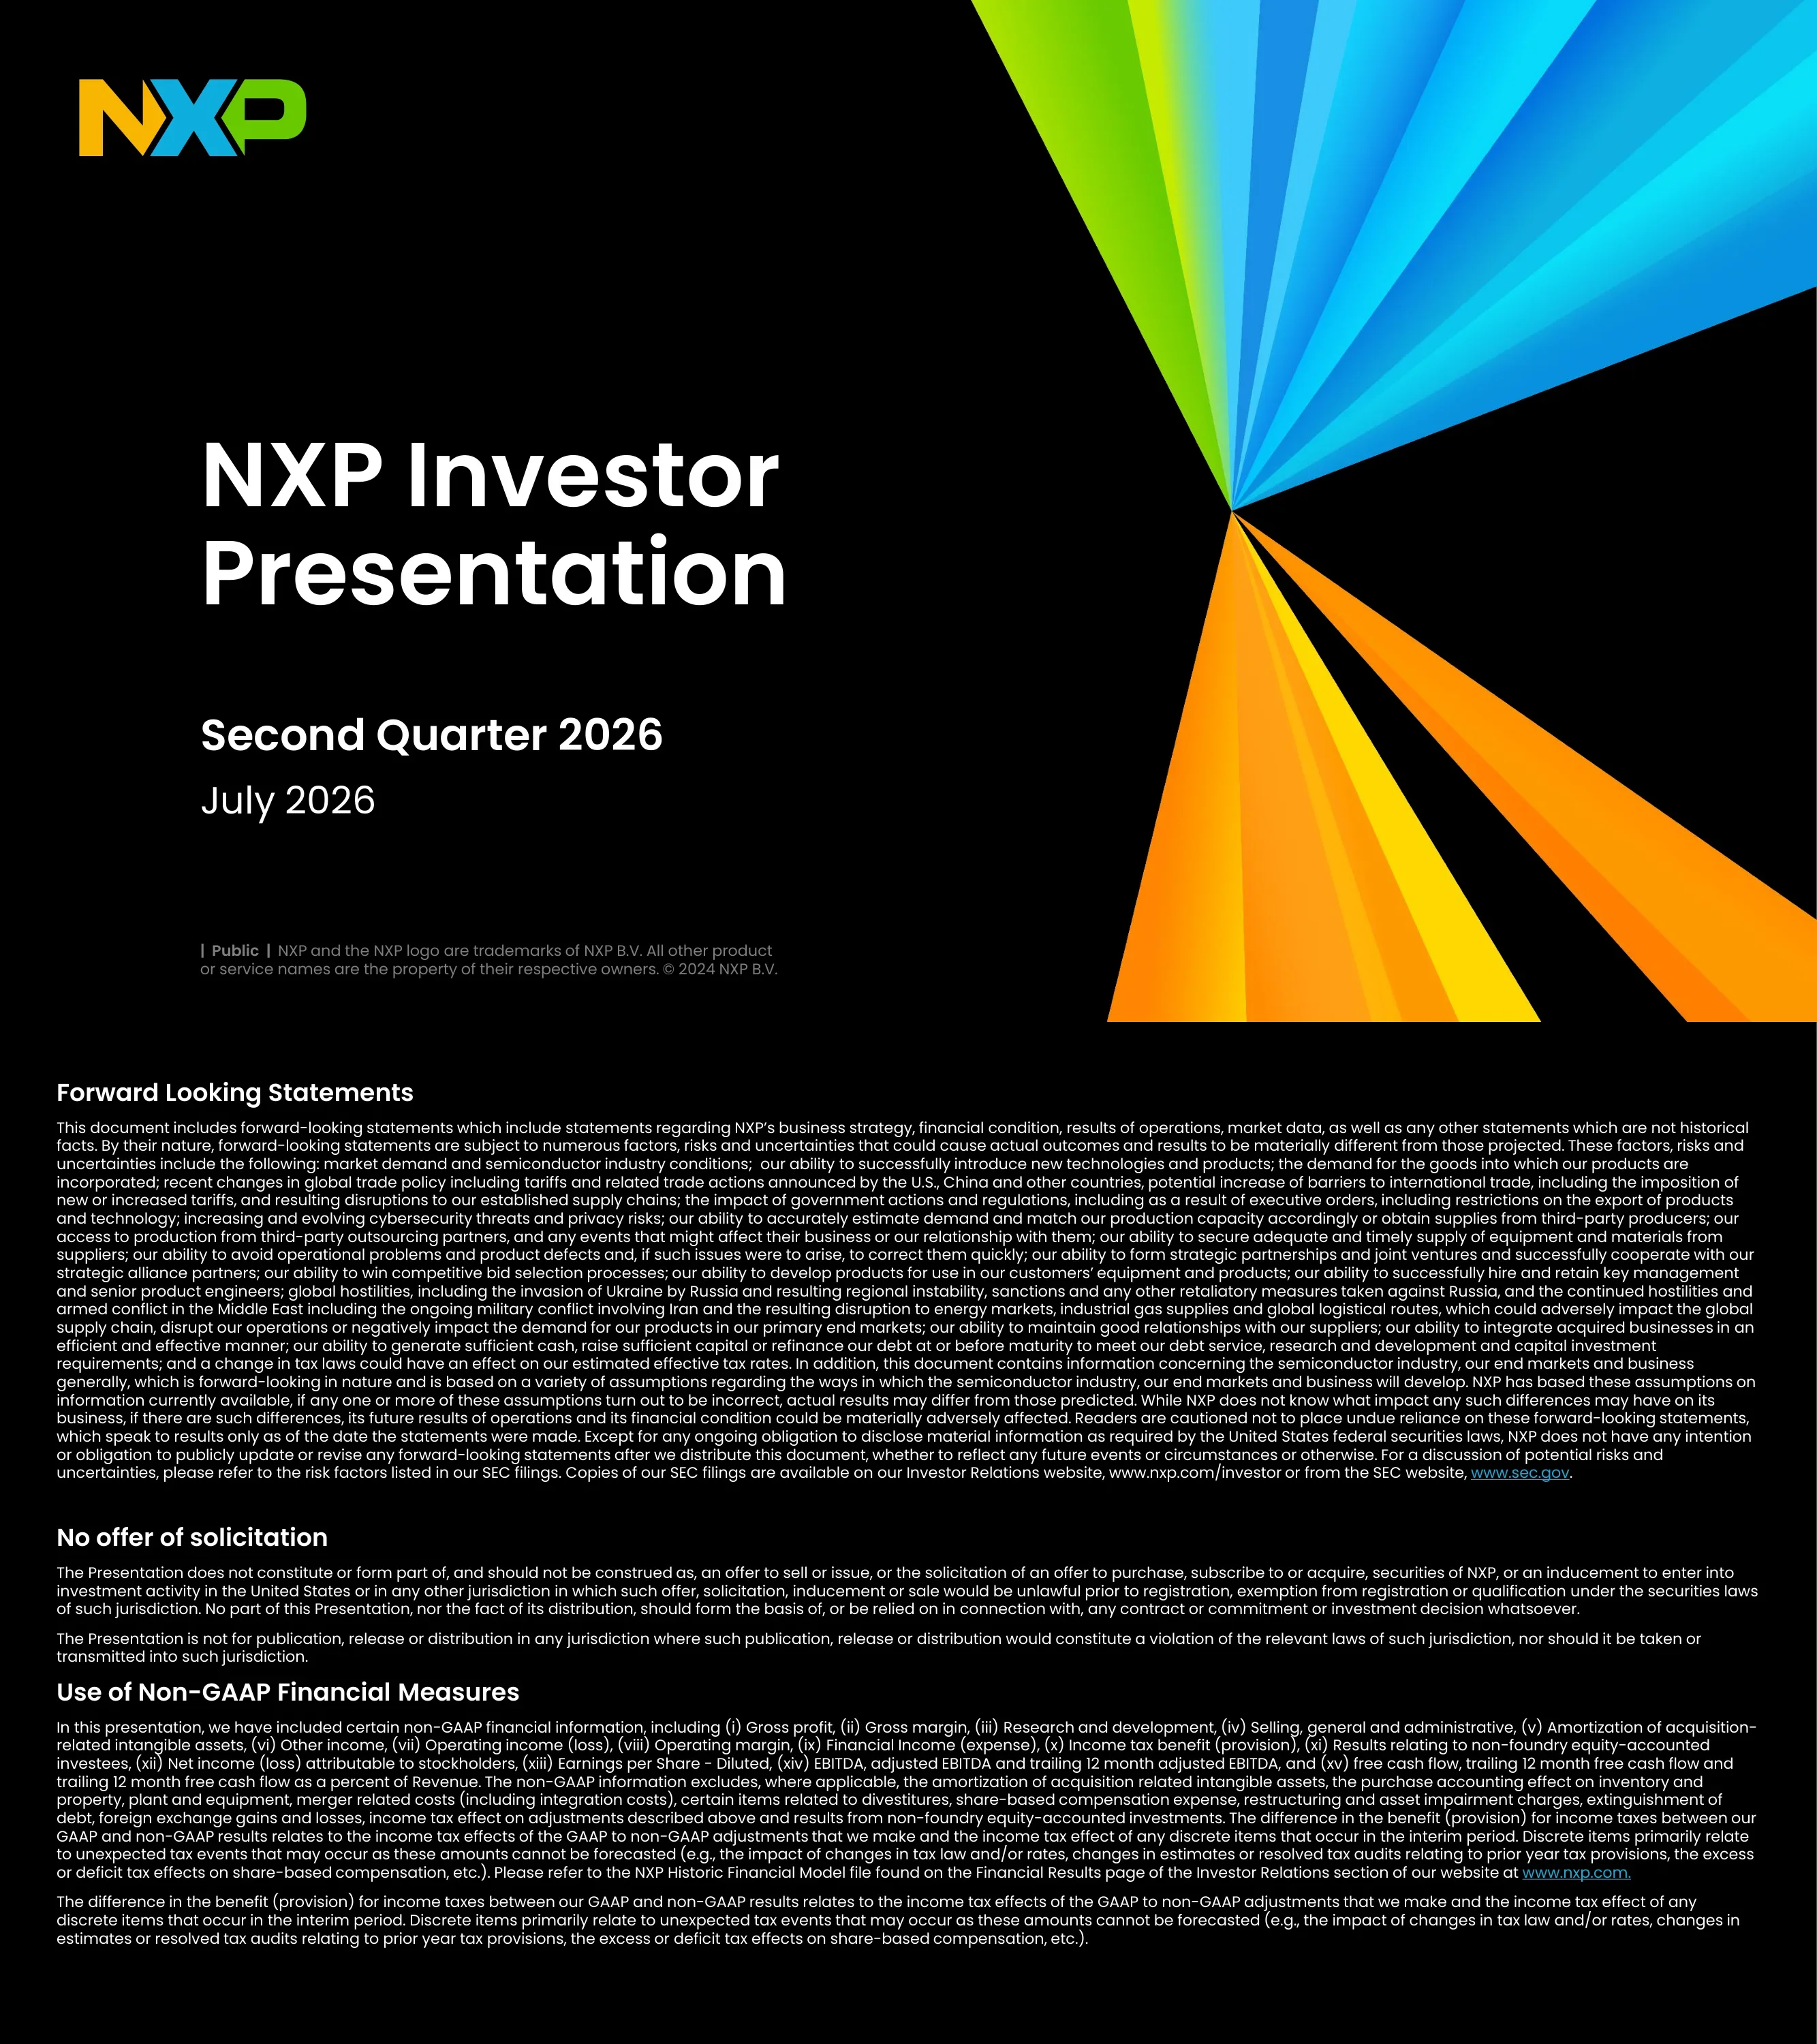
Cover slide titled 'NXP Investor Presentation', subtitled 'Second Quarter 2026, July 2026', with a Public classification and trademark notice.
Full-bleed black background. The tri-color NXP logo sits top left and a large white title is left-aligned in the middle. On the right, a burst of green, blue and orange-yellow light rays radiates from a single point.
Legal disclaimers. They list risk factors including tariffs and trade policy, export restrictions, supply chain, cybersecurity and conflicts in Ukraine and the Middle East, state that the deck is not an offer of securities, and define the non-GAAP measures used, such as adjusted EBITDA and free cash flow.
Text-only slide on black: three bold white section headings, each followed by dense full-width paragraphs of small white body text.
Sets out the value-creation formula: High Single Digit Organic Revenue Growth (S32 SDV, intelligent systems at the edge) + Gross Margin Expansion Above 60% (hybrid manufacturing, mix/NPI) + 100% of Excess FCF to Our Owners, adding up to 'Doubling non-GAAP EPS by 2030+'.
Three equal columns, each with a large royal-blue circle holding a white line icon (chip with rising bars, rocket, dollar bar chart). White '+' signs sit between the circles, and a full-width rounded blue banner at the bottom holds the EPS goal.
Covers 2010-2025. Revenue grew from $4.4B to a $13.3B peak in 2023 and was $12.3B in 2025. Non-GAAP operating margin rose from 16.0% to a 36.3% peak in 2022 (33.1% in 2025), and the year-end share price rose from $21 to $217. Milestones include the IPO, the Freescale merger, the Sound Solutions, RF Power and Standard Products divestitures, the QCOM deal exit, the Marvell connectivity assets and the 2025 TT Tech, Aviva Links and Kinara acquisitions.
Combo chart: blue revenue columns with margin percentages above them and a bright green share-price line overlaid. Yellow map-pin markers flag the milestones. Two arrows across the top split the period into 'Refined strategic focus & financial discipline' and 'Intelligent edge systems'.
The semiconductor TAM has grown in waves from 2000 toward a projected $2 trillion by 2030E: Analog (laptops, desktops, mobiles, game consoles), On-demand (smartphones, tablets, data-center servers) and Anticipate & Automate (cloud AI and intelligent edge systems: smart connected devices, factories, buildings and cars).
Annual bar chart whose colors move from pale cyan to deep blue across the eras. A tall glowing blue arrow points up to '$2 Trillion' at 2030E, with a column of white line icons (brain, car, robot arm, building, smart home) beside it. Era labels float above the bars and application lists sit below the axis.
Global semiconductor market by vertical grows from $775B in 2024 to ~$1,600B in 2030E, a 13% CAGR. Compute & AI goes from 350 to 810; Automotive from 75 to 145 (13% CAGR); Industrial from 45 to 85 (11%). Of the ~$825B growth, Compute & AI contributes 460 (55%), Wireless 150 (18%), Automotive 70 (9%), Wired 70 (9%), Industrial 40 (5%) and Consumer 35 (4%).
Two stacked columns (2024 and 2030E) joined by a stacked area band labeled with CAGRs. Segments are grey, except Automotive in royal blue and Industrial in cyan. On the right, a single stacked 'growth contribution' column with a 100% bracket and a color-coded legend (McKinsey November 2025 source).
Matches four industry challenges (ecosystem shifts, increasing complexity, software-defined edge, resilience & sustainability) to NXP's response: complete portfolio (sensing, AI-enabled processing, actuation, connectivity), deep competence (security and functional-safety leader), resilient & sustainable (hybrid manufacturing, carbon neutral by 2035) and simplifying (scalable system solutions, pre-integrated software and hardware).
Left: four stacked blue-outlined rounded boxes. Center: a circular-arrows icon over a blue glow funnel. Right: a 2x2 grid of navy cards with an NXP logo roundel at the center.
Maps the Sense-Think-Connect-Act capability stack (plus safe & secure and scalable system solutions) onto two focus markets. Automotive covers SW-defined vehicle, ADAS, electrification and high-RMS core franchises; Industrial & IoT covers factory automation, building & home, healthcare, and power & energy.
Left panel: a vertical stack of navy cards with icons. Right: two rows, each led by a solid color tile (royal-blue Automotive, cyan Industrial & IoT) followed by four outlined sub-market cards with line icons.
R&D investment matrix of relative market share against future market growth, for estimated cumulative 2025-2030 R&D: Invest to Sustain Leadership ~15%; Invest in High Growth Franchises ~40% (Auto SDV, radar, connectivity); Invest to Build New Franchises ~40% (intelligent edge, AI NPU, electrification, S/W middleware, ASA SERDES); De-prioritize ~5%. The right side shows product leadership combined with system leadership.
Left: a 2x2 quadrant matrix in shades of blue, with axis labels and a 'Core' four-way arrow. Right: a large blue circle split by an S-curve into 'Product Leadership' and 'System Leadership', ringed by circular arrows. A glow funnel connects the two sides.
2025 revenue by headquarter region: Asia Pacific ex-China $3.6B (29%), Americas $3.4B (27%), EMEA $3.3B (27%), China $2.0B (17%). By channel: Distribution $7.1B (57%), Direct $5.2B (43%). Hybrid manufacturing: front-end sourcing is 63% external and 37% internal; back-end sourcing is 87% internal and 13% external.
2x2 grid of four donut charts in blue and cyan tones, each with a bold heading and outside data labels.
2025 revenue by end market: Automotive 58%, Industrial & IoT 19%, Mobile 13%, Comm Infra 11%. Revenue by business type goes from $11.1B (2021) to $12.6B (2024) to ~$16.0B (2027E), a 6-10% CAGR. The accelerated-growth share rises from 18% to ~27% to ~38% (15-25% CAGR), while core businesses grow ~3%.
Left: a large segmented donut/pie with an NXP logo center and a curved cyan 'Strategic focus' arrow. Right: three stacked columns (blue core, cyan accelerated) with dotted leader lines to CAGR labels.
Vehicle complexity is rising: time-to-market falls from 3-5 to 1-2 years, lines of code rise from 100M to 500M, in-car data from 50GB to 10TB and ECU power from 30-60W to 50-200W. Unit CAGRs for 2024E-2027E: LV production 2% (89M to 94M), SDVs 48% (13M to 42M), ADAS L1-L3 8% (46M to 58M), xEVs 20% (33M to 56M). NXP revenue CAGR targets: Auto 8-12%, S32 SDV 20-30%, Radar 15-20%, Electrification 15-20%, Connectivity 10-20%.
A top band of four navy KPI boxes inside a grey frame, then four unit-CAGR label boxes, four pairs of stacked columns split into China (cyan) and ROW (blue), and outlined NXP revenue-CAGR boxes at the bottom.
Automotive revenue goes from $5.5B (2021) to $7.2B (2024) to ~$9.5B (2027E), an 8-12% CAGR. The core share falls from 73% to 61% to ~48% (~3% CAGR), while accelerated drivers (S32 SDV, radar, electrification, connectivity) grow 15-25%. Key assumptions: low single digit SAAR growth, low single digit pricing erosion, mid-to-high single digit content growth, GDP > 2.5% and PMI > 50, and channel inventory at 11 weeks.
Left column: six blue-outlined assumption cards. Right: three stacked columns in four blue shades plus core, with bracketed CAGR callouts and a legend.
Megatrends driving an upgrade cycle (productivity, energy efficiency, resilience, all augmented by AI). The Industrial & IoT SAM grows from $36.1B (2024E) to $44.9B (2027E), a 7% CAGR. Within it, focus segments grow at a 10% CAGR: factory automation 7.3 to 9.4, home & building 5.5 to 6.9, power & energy 4.6 to 6.8 and healthcare 2.5 to 3.2 ($B).
Left: a hierarchy diagram with three solid blue tiles on top, an 'Everything augmented by AI' bar and arrows down to three outlined cards with icons. Right: two stacked columns in blue shades over a grey base, with CAGR arrows and a segment legend.
Industrial & IoT revenue goes from $2.4B (2021) to $2.3B (2024) to ~$3.1B (2027E), an 8-12% CAGR. The core share falls from 78% to 73% to ~61% (~4% CAGR), while accelerated drivers (processing, connectivity, analog & security) grow 20-30%. Assumptions: SAM 7% CAGR, GDP > 2.5% and PMI > 50, manufacturing regionalization, channel inventory at 11 weeks.
The same template as page 13: four outlined assumption cards on the left, three stacked blue columns on the right with dotted leaders to CAGR labels, and a legend below.
2024 to 2027E outlook by end market. Automotive: $7.2B to ~$9.5B (8-12% CAGR; accelerated ~20%, core ~3%). Industrial & IoT: $2.3B to ~$3.1B (8-12%; ~25% and ~4%). Mobile: $1.5B to ~$1.6B (0-4%). Comm. Infrastructure: flat at $1.7B (0%).
2x2 small multiples, each a pair of bars (2024 vs 2027E) split into royal-blue core and cyan accelerated growth, with a shared legend at the bottom.
Wafer volume (300mm equivalents) grows from ~1.5M (2024) to ~1.9M (2027E) to ~2.3M (2030E), with the ≤28nm share rising from 0.1 to 0.4. In the front-end mix chart, the segment labeled internal goes from 38% to 35% to 20% and the external segment from 62% to 65% to 80% (2024, 2027E, 2030E). The back-end mix moves from 86% internal / 14% external to 80% / 20%. Supporting points: 300mm fab investment, 200mm fab consolidation, internal A&T expansion, JV partnerships and advanced node transition.
Three stacked-bar charts (wafer volume by node, front-end mix, back-end mix) over a faint world-map outline, above three white-outlined text cards with line icons.
The top 20 end customers are less than 45% of 2025 revenue. NXP has more than 25,000 customers and no 10% customers; the top-20 list is dominated by automotive customers, with some mobile, industrial and comm-infra customers.
A descending blue bar chart of 20 unnamed customers, each topped by a white icon for its end market (car, phone, robot arm, antenna). A centered three-line headline sits above and an icon legend below.
Changes from 2020 to 2025. Revenue: $8.6B to $12.3B (7% 5-yr CAGR). Non-GAAP gross profit: $4.4B to $7.0B (10% CAGR; margin 51.1% to 56.8%). Non-GAAP operating profit: $2.2B to $4.1B (13% CAGR; margin 25.9% to 33.1%). Non-GAAP FCF: $2.1B to $2.4B (3% CAGR; margin 24% to 20%).
2x2 grid of six-year blue bar charts with values inside the bars and margin percentages floating above.
2020-2025 by end market. Automotive: $3.8B to $7.1B (up 13% 5-yr CAGR; peak $7.5B in 2023). Industrial & IoT: $1.8B to $2.3B (up 4%). Mobile: $1.2B to $1.6B (up 5%). Communication Infrastructure & Other: $1.7B to $1.3B (down 5%).
2x2 grid of blue bar charts on a shared scale, which makes the size of automotive visually obvious.
Q2 2025 to Q2 2026. Revenue: $2,926M to $3,496M (10% Q-Q, 19% Y-Y). Non-GAAP gross profit: $1,652M to $2,028M (margin 56.5% to 58.0%). Non-GAAP operating profit: $935M to $1,228M (margin 32.0% to 35.1%). Non-GAAP FCF: $696M to $791M (22.6% FCF margin in Q2 2026).
2x2 grid of five-quarter blue bar charts with values inside the bars, margin percentages above and a small Q-Q/Y-Y growth callout over the latest revenue bar.
Q2 2026 by end market. Automotive: $1,938M (9% Q-Q, 12% Y-Y). Industrial & IoT: $755M (20% Q-Q, 38% Y-Y). Mobile: $351M (-10% Q-Q, 6% Y-Y). Communication Infrastructure & Other: $452M (19% Q-Q, 41% Y-Y).
2x2 grid of five-quarter blue bar charts with $M labels inside the bars and Q-Q/Y-Y callouts above each latest bar.
The policy is to return all excess non-GAAP FCF, targeting a 25% dividend payout of CFO. From 2016 to 2025, cumulative capital return was $22.7B (95% of non-GAAP FCF, 4% 10-year CAGR), including $17.4B of repurchases (77%, a 27% reduction in diluted share count) and $5.3B of dividends (23%). Annual returns range from $0.3B (2017) to $5.1B (2018); 2025 was $1.9B.
Left: stacked columns (dark-blue repurchases, cyan dividends) with a dot series above showing cumulative return as a % of FCF (67% to 95%). Right: a bulleted text panel with bold subheadings.
Debt maturity ladder from 2027 to 2051 with 16 tranches of senior unsecured notes and EIB loans. Book-value debt is $10,976M, cash and short-term deposits $3,222M and net debt $7,754M. TTM adjusted EBITDA is $5,106M, average cost of debt 3.88%, gross leverage 2.1x, net leverage 1.5x and EBITDA-to-net-interest coverage 15.0x.
A stacked column maturity ladder in light-blue and teal shades with $M labels and a three-row tranche legend, above a white-bordered leverage summary table in the lower left.
Q2 2025 to Q2 2026: DSO 33, 31, 29, 34, 33; DPO 60, 58, 60, 59, 60; DIO 158, 161, 154, 165, 156; cash conversion cycle 131, 134, 123, 140, 129 days. Formulas are shown (e.g. CCC = DIO + DSO - DPO).
2x2 grid of five-quarter blue bar charts with in-bar values and formula definitions centered below.
Compares Investor Day 2021 targets, 2024 actuals and Investor Day 2024 targets. Growth: +8-12%, 4.5% and +6-10% (3-yr CAGR). Non-GAAP gross margin: 55-58%, 58.1% and 57-63%. Operating margin: 32-36%, 34.6% and 34-40%. R&D ~16%, SG&A ~7%, EAETR 17-18%, equity-accounted investees ~($200M) for 2025-27.
Three-column comparison table: dark-grey cells for 2021 and 2024A, bright-blue cells for Investor Day 2024. Gold outlines highlight the headline growth, gross margin and operating margin targets, and sub-metrics are in italics.
Compares Investor Day 2021, 2024A and Investor Day 2024 targets. Non-GAAP FCF: 25%, 19.5% and >25% of revenue. Net capex: 6-8%, 6.6% and <5%. DIO: ~95, 151 and ~110. VSMC capacity access fee: N/A, $275M and $800M. ESMC/VSMC equity investments: N/A, $220M and ~$1.7B. Dividend ~25% of CFO, buyback under 2.0x net leverage, capital return 100% of FCF.
The same three-column table design as page 26, with gold-outlined highlight cells for FCF, net capex, equity investments and capital return.
Q3 2026 revenue guidance is $3,650-3,850M (mid $3,750M, 7% Q-Q, 18% Y-Y). Non-GAAP gross margin 58.0-59.0%, non-GAAP operating margin 36.0-37.6% and non-GAAP diluted EPS $3.89-4.32 (mid $4.11). GAAP diluted EPS is $3.21-3.64 on 254.0M shares.
A plain white-on-black numeric table with GAAP Low/Mid/High, a Reconciliation column and Non-GAAP Low/Mid/High, followed by six numbered footnotes and a small-print disclaimer.
Strategy, guiding principles and goals for Innovation, Environmental, Social and Governance. Environmental goals include carbon neutral by 2035, a 55% Scope 1 & 2 reduction by 2030, a 35% Scope 3 reduction by 2033, and by 2027 50% renewable electricity, 60% water recycled and 90% waste recycled.
A 4x4 white-bordered grid: a row-header column with large line icons (lightbulb, globe-in-hand, people, handshake) and three text columns headed Strategy, Guiding principles and Goals.
Compared with 2024, Scope 1 emissions fell 19%, Scope 2 8% and Scope 3 11%. Other progress: renewable energy up to 47%, PFC-abatement equipment at 4 sites, ISO14001/ISO45001 recertification, limited assurance for Scope 1 and 2, 96% of team members completed sustainability training, 93% feel NXP is committed to ethical practices, an inaugural Climate Transition Plan, and 100% certified conflict-free 3TG smelters.
Left: three columns with blue headers above flat cyan illustrations (factory, power plant and pylons, city with traffic) and bold decrease figures. Right: a 3x3 'Additional Progress' grid of outlined text cells.
2020-2025 ratings. MSCI: BB to AA to AAA (2022-2025). Sustainalytics risk score: 19.4 to 16.0 (Low Risk; Medium Risk 21.6 in 2022). CDP: Climate D/Water D improving to Climate B/Water B in 2025. ISS ESG: C+ Prime to B- Prime.
A left column of four white-outlined boxes with the MSCI, Sustainalytics, CDP and ISS ESG logos, next to four rows of six blue bars whose heights encode each year's rating, with labels above.
Annual income statement for 2020-2025. 2025 revenue was $12,269M, gross profit $6,716M, R&D $2,360M, operating income $3,047M, net income attributable to stockholders $2,021M and diluted EPS $7.95 (versus $9.73 in 2024 and $10.70 in 2023).
A full-width grid table with a blue year-header row, bold totals and white gridlines on black.
2025 GAAP gross profit of $6,716M reconciles to non-GAAP $6,966M (margin 54.7% vs 56.8%). GAAP operating income of $3,047M reconciles to non-GAAP $4,064M (margin 24.8% vs 33.1%). Six years of adjustments are shown.
A compact grid table in the top half of the slide with a blue year header, bold GAAP and non-GAAP rows and indented adjustment rows. The lower half is empty.
2025 operating cash flow was $2,820M, investing -$2,357M and financing -$494M, with year-end cash of $3,267M. Net capex was $395M and non-GAAP FCF $2,425M (20% of revenue), against 24%, 21%, 22%, 20% and 17% in 2020-2024.
Two stacked grid tables, the cash flow summary and the FCF derivation, with a blue year header and bold key rows.
Builds from net income to non-GAAP EBITDA ($3,809M in 2025), then adds reconciling items such as $462M stock-based compensation and $261M restructuring to reach non-GAAP adjusted EBITDA of $4,727M (from $2,792M in 2020, peak $5,469M in 2022).
A full-height grid table with a blue year header, bold milestone rows (net income, EBITDA, adjusted EBITDA) and a footnote row about other incidental items.
Q2 2026 revenue was $3,496M, gross profit $2,002M, operating income $1,071M, net income attributable to stockholders $767M and GAAP diluted EPS $3.02. Q1 2026 included $621M of other income, which lifted its operating income to $1,505M and EPS to $4.43.
Five-quarter grid table with a blue quarter header row and bold revenue, gross profit and operating income rows.
In Q2 2026, non-GAAP gross profit was $2,028M, non-GAAP operating income $1,228M and non-GAAP net income $918M. Non-GAAP diluted EPS was $3.61 (vs $2.72 in Q2 2025), after $(0.59) of per-share adjustments including $(36)M PPA and $(105)M share-based compensation.
Two side-by-side reconciliation tables with blue quarter headers: the left covers gross profit to taxes and NCI, the right covers equity investees, net income, EPS and an adjustment breakdown.
Q2 2026 operating cash flow was $860M, investing -$237M, financing -$1,109M and ending cash $3,222M. Net capex was $69M and non-GAAP FCF $791M. Trailing 12-month FCF was $2,807M (21% of revenue).
Two stacked five-quarter grid tables with a blue header and bold key rows, including the TTM FCF lines.
Q2 2026 net income of $782M leads to non-GAAP EBITDA of $1,252M and non-GAAP adjusted EBITDA of $1,369M. Trailing 12-month adjusted EBITDA rose from $4,745M in Q2 2025 to $5,106M. Q1 2026 other incidental items were $(605)M.
A five-quarter bridge table with a blue header, section-label rows and bold EBITDA totals.
Repeats page 3 as a closing summary: high single digit organic revenue growth + gross margin expansion above 60% + 100% of excess FCF to owners = doubling non-GAAP EPS by 2030+.
Identical to page 3: three blue circular icon badges joined by plus signs, above a full-width rounded blue banner.
Closing brand slide with the NXP logo, a nxp.com pill button and the trademark notice.
Black background with a large tri-color NXP logo on the left, a rounded dark-grey URL pill, and a multicolor light-ray burst (green, blue, orange, yellow) on the right half.
このスライドと基礎となるプレゼンテーションコンテンツに関する一般的な質問。
The 41-slide deck covers NXP's value-creation framework, a history slide for 2010-2025, market sizing for the semiconductor industry and NXP's end markets, growth outlooks for automotive and Industrial & IoT, hybrid manufacturing plans, annual and quarterly results, Q3 2026 guidance, capital return, debt and working capital, sustainability progress and ratings, and a 13-page appendix of GAAP/non-GAAP tables.
The slides report Q2 2026 revenue of $3,496M (up 10% Q-Q and 19% Y-Y), non-GAAP gross margin of 58.0%, non-GAAP operating margin of 35.1%, GAAP diluted EPS of $3.02, non-GAAP diluted EPS of $3.61 and non-GAAP free cash flow of $791M. Automotive revenue was $1,938M and Industrial & IoT $755M.
It guides Q3 2026 revenue to $3,650-3,850M (midpoint $3,750M, up 7% Q-Q and 18% Y-Y), non-GAAP gross margin of 58.0-59.0%, non-GAAP operating margin of 36.0-37.6% and non-GAAP diluted EPS of $3.89-4.32. These are company projections, not recommendations.
It runs from cover and disclaimers to strategy and market slides, then segment outlooks, financial performance, capital allocation and guidance, then ESG, the appendix tables and a recap. Reusable patterns include the three-part equation slide, 2x2 small-multiple bar charts, stacked business-mix columns with CAGR callouts, donut KPI grids, a debt maturity ladder, an investment matrix and three-column target tables.
It is dark-mode throughout: black backgrounds, white geometric sans-serif headlines, and charts in royal blue and cyan. Cards have blue rounded outlines, icons are thin white lines, key target cells are outlined in gold, and every slide carries a small '| NXP | Public' footer. The cover and closing slides use the tri-color NXP logo and a multicolor light-ray burst.
The deck highlights high single digit organic revenue growth, gross margin expansion above 60%, returning 100% of excess free cash flow, and doubling non-GAAP EPS by 2030+. The Investor Day 2024 model targets 6-10% revenue CAGR, 57-63% non-GAAP gross margin, 34-40% non-GAAP operating margin and non-GAAP FCF above 25% of revenue.
Yes. The original PDF is available, along with an editable PPTX version. The PPTX was machine-converted from the PDF, so some layouts, charts and fonts may need touching up after you open it.
It was published by NXP Semiconductors on its investor relations financial information page (investors.nxp.com), dated July 2026 for the second quarter of 2026. Figures reflect NXP's reported results and internal estimates as shown on the slides.
Official source of the Q2 2026 investor presentation (July 2026) this gallery page is based on.

Create Your Own Slides
Turn your ideas into professional presentations in seconds with 2slides AI.
プロフェッショナルなデザインを参照し、スタイルを選択し、完璧なテキストレンダリングでスライドを生成。Nano Banana搭載—今すぐプレゼンテーションの作成を始めましょう。
Your AI Agent for slides. Save time, shine faster with intelligent presentation creation.




© 2026 2slides. All rights reserved.