
収録コレクション: 投資家向けプレゼン資料の実例 · オーストラリア企業のIR資料 実例集
Macquarie Group's 1H27 result presentation to investors and analysts (half year ended 30 September 2026), lodged with the ASX (ASX: MQG) and dated 6 November 2026. All amounts are in Australian dollars ($A / A$m), as written in the deck. The 66-page deck reports a profit attributable to shareholders of $A2,478m, up 50% on 1H26, on net operating income of $A9,568m, with an annualised ROE of 13.8% and an interim dividend of $A3.25 (35% franked), then walks through Operating Group results, capital, funding, liquidity, outlook and detailed appendices.
このスライドの表紙をスタイルの参考にして、ご自身の内容からスライドを作成します。 下のページから好きな1枚を選び、そのレイアウトを参考にすることもできます。
クイックナビゲーション
タグ
スライドを共有
Macquarie Group's 1H27 result presentation to investors and analysts (half year ended 30 September 2026), lodged with the ASX (ASX: MQG) and dated 6 November 2026. All amounts are in Australian dollars ($A / A$m), as written in the deck. The 66-page deck reports a profit attributable to shareholders of $A2,478m, up 50% on 1H26, on net operating income of $A9,568m, with an annualised ROE of 13.8% and an interim dividend of $A3.25 (35% franked), then walks through Operating Group results, capital, funding, liquidity, outlook and detailed appendices.
レイアウト、主要コンテンツ、視覚要素を含む各スライドページの詳細ビュー。
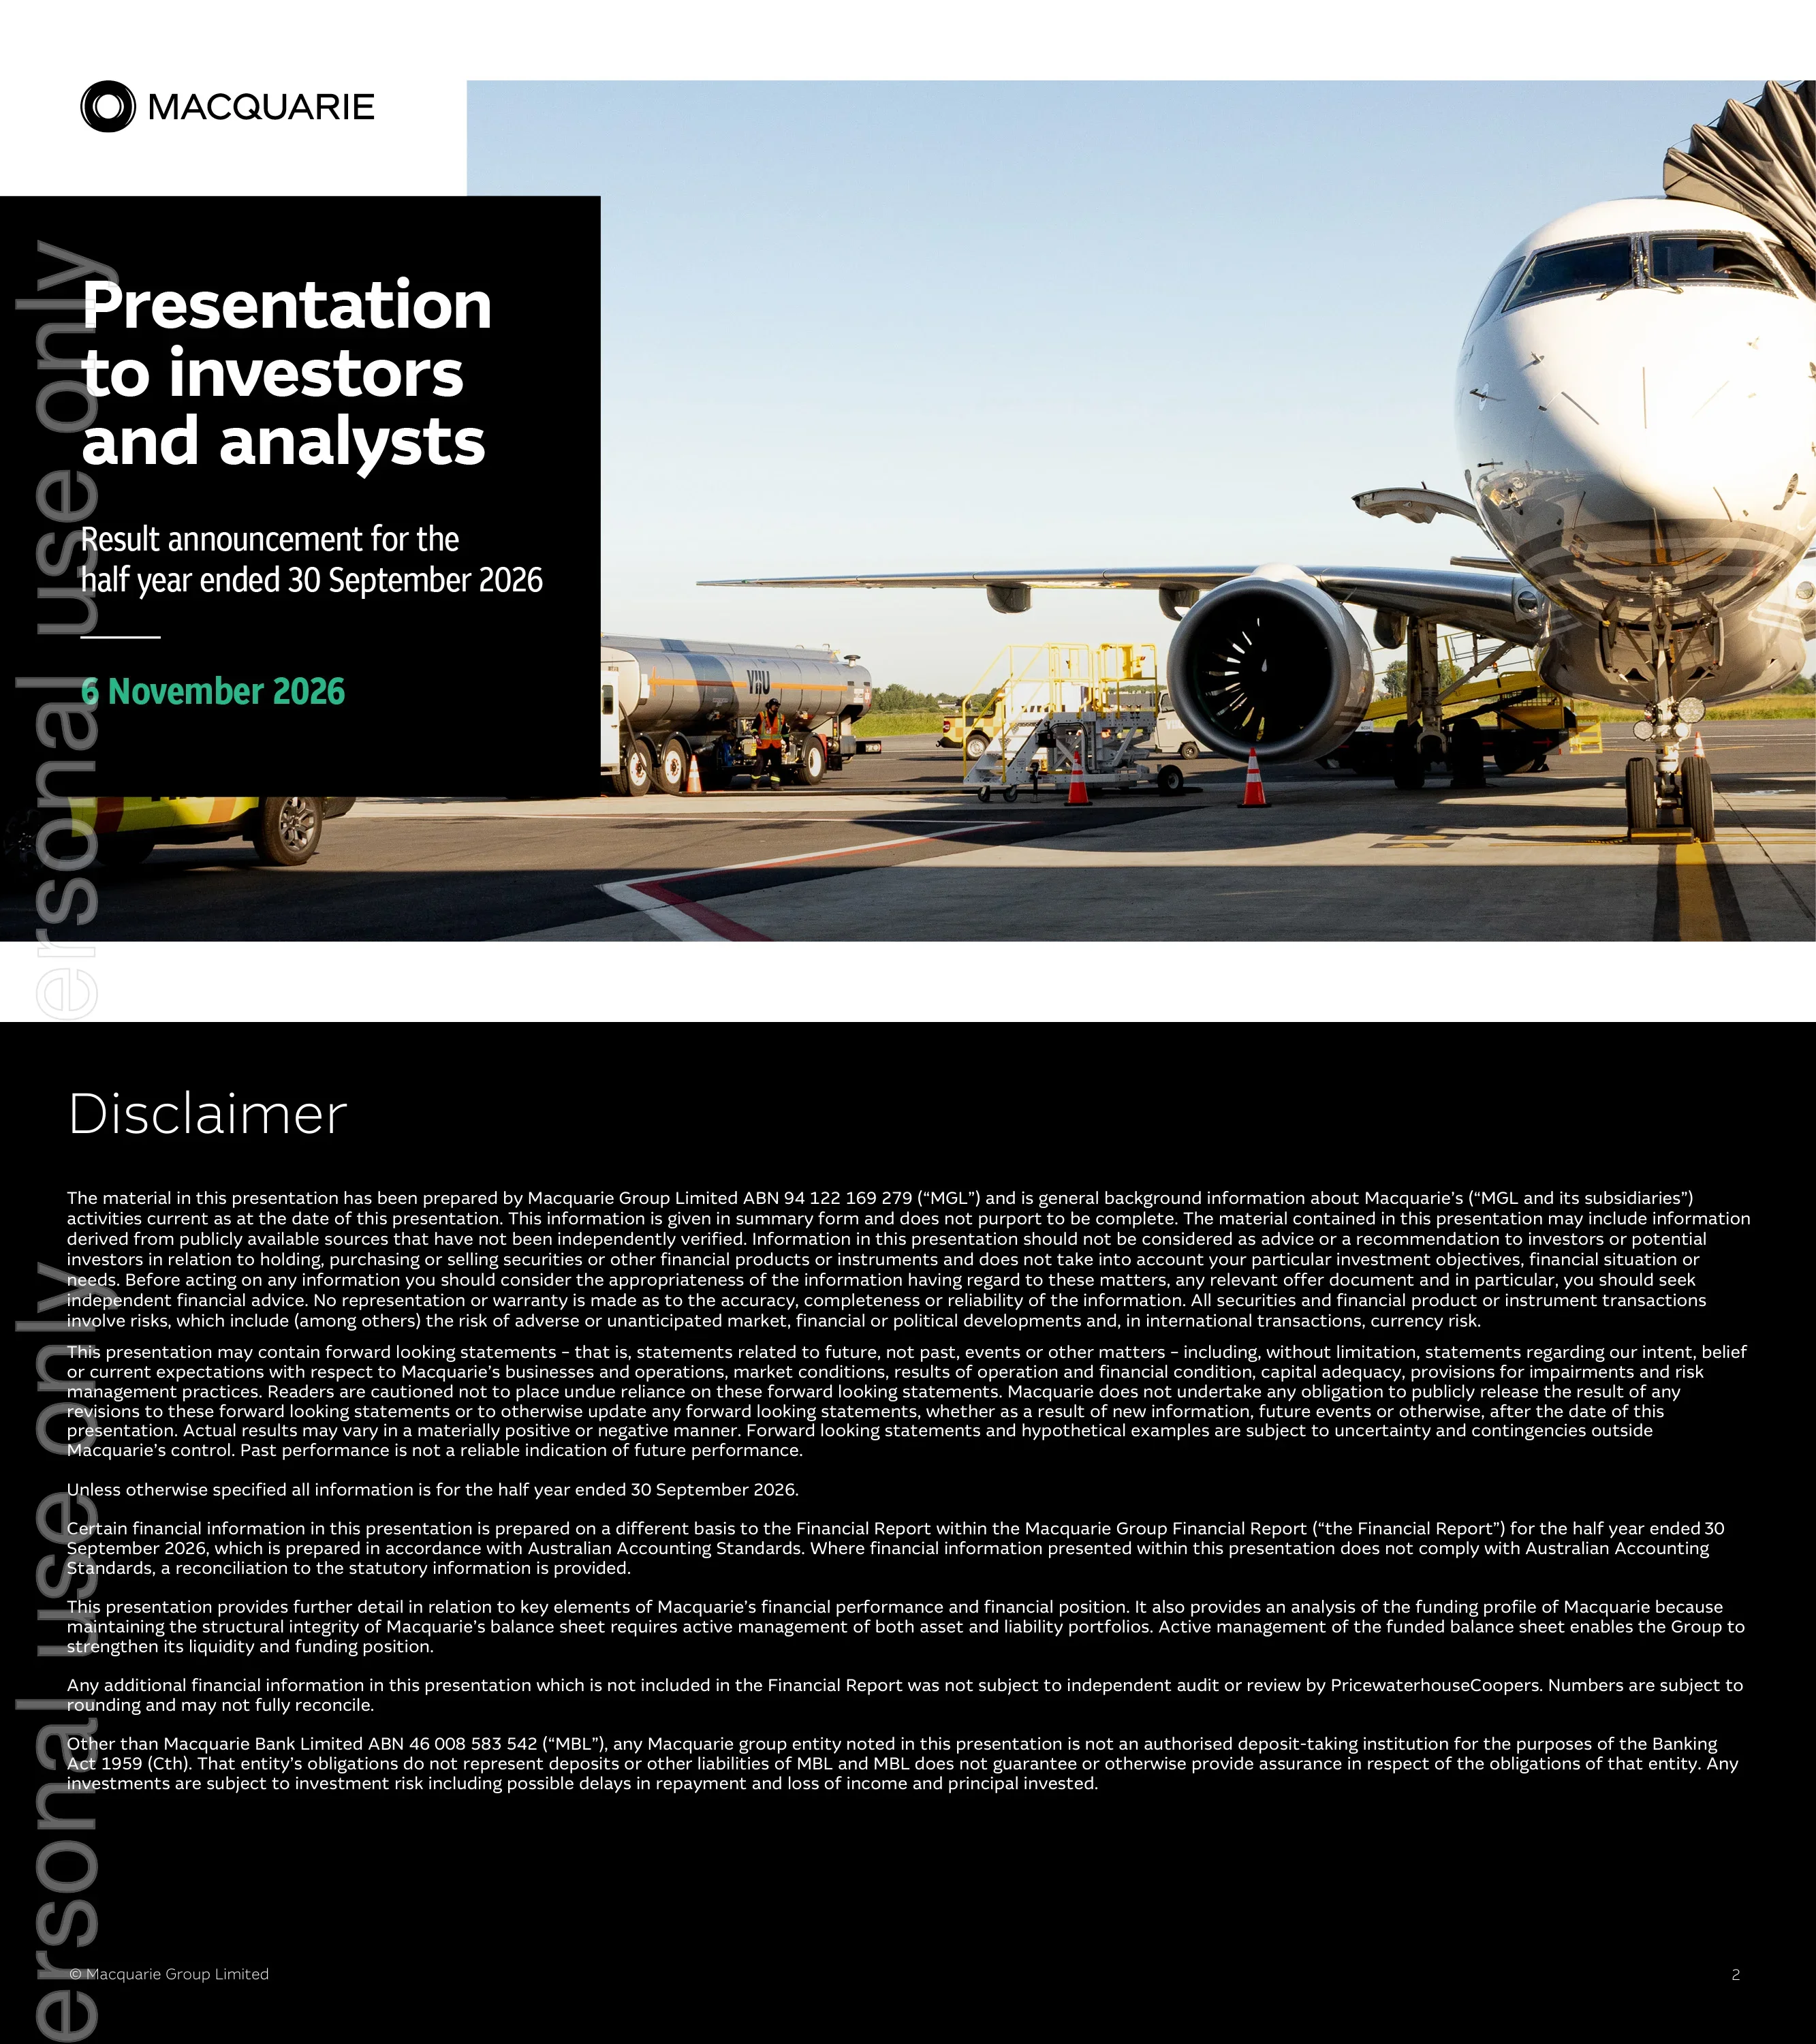
Macquarie Group's presentation to investors and analysts for the result announcement for the half year ended 30 September 2026, dated 6 November 2026.
Black text panel over a full-bleed aircraft-on-apron photo with the MACQUARIE logo.
Standard legal notice stating the deck was prepared by Macquarie Group Limited (ABN 94 122 169 279), is not advice, contains forward-looking statements, covers the half year ended 30 September 2026, reconciles non-AAS information, and that Macquarie Bank Limited (ABN 46 008 583 542) is the only ADI.
Full-page black background with dense white text paragraphs.
Five sections: 01 Introduction, 02 Overview of Result, 03 Result Analysis and Financial Management, 04 Outlook and 05 Appendices.
Pale mint panel with numbered agenda list beside an aircraft photo.
Divider for the Introduction section, presented by Sam Dobson, Head of Investor Relations.
Large 01 in a black box on a pale mint panel with a full-bleed industrial worker photo.
Divider for the Overview of Result section, presented by Shemara Wikramanayake, MD and CEO.
Large 02 in a black box on a mint panel beside a couple-with-phone photo.
Income mix of about 51% annuity-style, 20% and 29% markets-facing, with four Operating Groups: BFS (deposits $A236.2b, loan portfolio $A217.8b, funds on platform $A161.3b), MAM ($A742.9b AUM), CGM and MacCap, supported by Central Service Groups RMG, LGG, FPE and COG.
Blue-to-green gradient bar above four group columns, with a Central Service Groups row below.
Profit of $A2,478m, up 50% on 1H26 and down 22% on 2H26, on net operating income of $A9,568m, operating profit before tax of $A3,251m, ETR 22.5%, annualised ROE 13.8%, ROTE 14.8%, basic EPS $A6.52 and DPS $A3.25.
Financial table with 1H27, 2H26 and 1H26 columns and arrow columns showing percentage change.
Operating Group net profit contribution of $A4,662m, up 23% on 1H26: MAM $A1,509m, MacCap $A278m, BFS $A841m and CGM $A2,034m, each with drivers noted.
Gradient bar header with Non-Banking Group and Banking Group columns and up or down arrow indicators.
Total staff of 19,361 with 50% outside Australia: Americas 21% of income ($A1,915m), EMEA 30% ($A2,651m), Asia 10% ($A873m) and Australia including NZ 39% ($A3,414m), with staff, AUM and people employed by region.
Four donut charts in columns with regional metric blocks and office city lists.
MAM operating income $A2,361m, net profit contribution $A1,509m (up 28% on 1H26) and AUM $A742.9b, with $A15.3b raised, $A17.6b invested, $A19.1b returned, $A21.3b to deploy and notable funds and transactions.
Black left KPI panel with large numbers and a right-hand business performance and transactions panel.
BFS operating income $A1,873m and net profit contribution $A841m, with home loans $A198.2b (up 9%), business banking $A19.2b, funds on platform $A161.3b, deposits $A236.2b (up 10%) and about 2.4 million clients.
Black KPI panel with home loan portfolio summary and three columns for Personal Banking, Business Banking and Wealth Management.
CGM operating income $A3,857m and net profit contribution $A2,034m (up 83% on 1H26), split Asset Finance 18% (portfolio $A8.3b), Commodities 49% and Financial Markets 33%.
Black KPI panel with three product columns and award and ranking callouts.
MacCap operating income $A1,019m and net profit contribution $A278m (down 61% on 1H26), with Private Credit $A28.0b, Equity $A5.6b, brokerage up 20% and advisory and principal deal highlights.
Black KPI panel with highlights column and advisory and principal transaction lists.
Term liabilities exceed term assets, with total deposits of $A244.2b (up 10% from March 2026), term funding raised of $A16.3b, and deposits 53% of funding at 30 September 2026.
Two stacked bar charts comparing 31 March 2026 and 30 September 2026 funding sources against funded assets, with KPI tiles.
APRA Basel III Level 2 CET1 of 12.9% (harmonised 17.7%) and a capital surplus bridge from $A9.3b at March 2026 to $A9.6b at September 2026 after dividend (1.0), 1H27 profit +2.5, business capital requirements (0.5) and other (0.7).
Waterfall chart in $Ab with CET1 callouts at the side.
Business capital requirements rose $A0.7b excluding FX in 1H27, with the bridge going from $A33.4b at September 2025 to $A33.3b at March 2026 and $A33.8b at September 2026 by group.
Waterfall chart with a black key-drivers panel by group.
Bank Group Level 2 ratios at September 2026: CET1 12.9% APRA and 17.7% harmonised, leverage 4.4% and 4.9%, LCR 187% and NSFR 116%.
Four bar charts each with a dashed APRA minimum line.
1H27 ordinary dividend of $A3.25 per share (35% franked), up from $A2.80 in 1H26 and down from $A4.20 in 2H26, with record date 12 November 2026, payment 17 December 2026, DRP at a 1.5% discount and a 50% payout ratio under the 50-70% policy.
Colour-block tile layout with dividend, dates and payout metrics.
Divider for the Result Analysis and Financial Management section, presented by Frank Kwok, CFO.
Large 03 in a black box on a mint panel beside a shipyard aerial photo.
Three-period income statement with net interest and trading income $A5,698m, fee and commission income $A2,784m (down 29%), net operating income $A9,568m and total operating expenses $A6,317m, with commentary on each driver.
Dense P&L table on the left with commentary bullets on the right.
MAM net profit contribution rose from $A1,175m in 1H26 to $A1,509m in 1H27, with base fees (31), performance fees (467), investment-related income +1,040, opex (67) and divested business (141).
Waterfall chart with a black key-drivers panel.
MAM AUM moved from $A722.1b at 31 March 2026 to $A742.9b at 30 September 2026 through inflows 79.5, outflows (71.8), valuation +16.9 and FX (3.8), split by Real Assets, Real Estate, Credit and Insurance, and Solutions.
Stacked waterfall chart in $Ab with category legend.
BFS net profit contribution rose from $A793m to $A841m, driven by Personal Banking +154, Business Banking +40, Wealth +12, offset by credit (81), expenses (49) and other (28); average home loan volumes were up 26% and deposits up 27%.
Waterfall chart with a black key-drivers panel.
Clustered bars at 31 March 2024, 2025, 2026 and 30 September 2026: home loans 119.3, 141.7, 181.3 and 198.2; BFS deposits 142.7, 172.4, 215.3 and 236.2; funds on platform 149.5, 157.0, 159.2 and 161.3; business banking loans 15.8, 16.7, 18.1 and 19.2 ($Ab).
Four clustered bar charts in a grid with data labels.
CGM net profit contribution rose from $A1,113m to $A2,034m, led by risk management +139, lending and financing +91, inventory management and trading +190 (Commodities $A420m), Financial Markets +169, investment and other +277 and other opex +55.
Waterfall chart with a black key-drivers panel.
CGM operating income by product from 1H25 to 1H27, client numbers from March 2023 to September 2026 for Commodities and Financial Markets, and regulatory capital by risk type; charts show shape only without data labels.
Three charts: stacked bar, client number bars and a capital by risk type stack.
MacCap net profit contribution fell from $A711m to $A278m, with investment-related income excluding private credit (270), private credit (74), fee and commission (103) and opex +14.
Waterfall chart with a black key-drivers panel.
MacCap capital moved from $A6.2b to $A6.5b (+0.7 investments, (0.3) realisations, (0.1) other), with private credit exposure by sector led by Software 26%, B2B 15% and Financial and Insurance 14%.
Stacked waterfall on the left and a sector donut chart on the right.
Compliance spend was down 4% on 1H26 at $A622m for 1H27 (FY26 $A1,293m) and technology spend was down 4% at $A1,170m for 1H27 (FY26 $A2,417m), with FY23 to FY26 trends.
Two bar charts side by side with percentage change callouts.
Term funding at 30 September 2026 by currency (AUD 46%, USD 36%, EUR 11%, GBP 4%), tenor (over 5 years 50%) and type (bonds 32%, equity 29%, Tier 2 10%), with a 4.1 year weighted average maturity.
Row of donut charts above term issuance and maturity profile bar charts.
Total deposits grew from $A67.1b at March 2020 to $A221.5b at March 2026 and $A244.2b at September 2026, with about 2.3m of about 2.4m BFS clients being depositors, and mix by type (savings 49%) and counterparty (households 50%).
Growth bar chart beside composition donuts by type and counterparty.
Total loan assets of $A272.7b (March 2026: $A253.5b) by group: BFS $A219.4b (home loans $A200.0b), CGM $A25.8b, MacCap $A25.7b and MAM $A1.8b.
Table by Operating Group with comparative columns.
Equity investments of $A11.6b (March 2026: $A13.0b) split MAM $A4.9b, MacCap $A5.4b and Corporate, BFS and CGM $A1.3b.
Table by group with comparative columns.
Update on Australia (APRA remediation plan for MBL, an August 2026 breach on capital treatment of MGL structural interest-rate-risk hedging with a $A100m governance overlay, and ASIC AFSL conditions) and Germany (cum-ex industry investigation).
Text-only slide with two region headings and bullet lists.
Bank Group CET1 bridge from harmonised 17.5% at March 2026, less super-equivalence (4.7%) to APRA 12.8%, then +0.8% profit, (0.7%) dividend, (0.1%) business capital and +0.1% other to APRA 12.9% at September 2026, and +4.8% to harmonised 17.7%.
Waterfall chart in percentage points with an APRA minimum line.
Average LCR of 187% for the September 2026 quarter, with MBL HQLA of 49.1, 55.3 and 63.9 against net cash outflows of 28.4, 32.0 and 34.2 (LCR 173%, 173%, 187%), and an HQLA mix of 14% central bank, 55% Australian government and semi-government bonds and 31% non-AUD.
Paired bar charts with an LCR line and an HQLA composition donut.
DRP for 2H26 priced at $A233.12 per share, 1H27 DRP at a 1.5% discount, MEREP purchases of $A734m of shares at $A238.80, and BCN2 resale on 21 December 2026 with proposed exchange for MQG shares after the APRA hybrid phase-out effective 1 January 2027.
Text slide with headed bullet blocks.
Divider for the Outlook section, presented by Greg Ward, MD and CEO designate.
Large 04 in a black box on a mint panel beside a worker-by-shipping-containers photo.
Group-by-group factors: MAM base fees broadly in line excluding divested business, MacCap transaction and investment income down, BFS growth with lower margins, CGM net operating income slightly up excluding OnStream, and Corporate compensation ratio and FY27 ETR in line with history.
Gradient bar header above a factors table by group.
Further factors covering market conditions, period-end reviews, FX and geography, and tax and regulatory matters, under a cautious stance with a conservative approach to capital, funding and liquidity.
Factor list on one side and a half-page street photo of a man with a phone.
Macquarie is well-positioned for superior medium-term performance, citing deep expertise, patient adjacent growth, platform investment, a conservative balance sheet, risk culture and its people.
Bullet list of strengths beside a photo of a trader at a desk.
Medium-term bullets for each of MAM, MacCap, BFS and CGM.
Gradient bar header above four group columns of bullets.
Repeat of the cover, presentation to investors and analysts dated 6 November 2026, closing the main presentation before the appendices.
Black text panel over an aircraft-on-apron photo, identical to page 1.
Divider introducing the detailed result commentary appendix.
Large section number in a black box on a mint panel beside a woman-on-balcony photo.
MAM base fees $A907m (down 38%), performance fees $A289m (down 62%), net investment and other $A1,167m, net operating income $A2,361m, opex $A(792)m and net profit contribution $A1,509m, with AUM $A742.9b, fee-paying AUM $A530.0b and headcount 1,831.
Detailed result table with comparison columns and an operating statistics block.
BFS net interest and trading income $A1,635m (up 12%), fees $A337m, credit impairment (77), net operating income $A1,873m, opex (1,032) and net profit contribution $A841m, with loan portfolio $A217.8b, deposits $A236.2b, expense to income 50% and headcount 4,325.
Detailed result table with comparison columns and an operating statistics block.
CGM Commodities $A1,800m (up 30%), FX, rates and credit $A733m, Equities $A323m, Asset Finance $A149m, net operating income $A3,857m, opex (1,824) and net profit contribution $A2,034m, with headcount 2,751.
Detailed result table with comparison columns and an operating statistics block.
MacCap net interest and trading income $A427m, fees $A747m, net investment losses (112), net operating income $A1,019m, opex (760) and net profit contribution $A278m, with private credit $A28.0b, equity $A5.6b and headcount 1,496.
Detailed result table with comparison columns and an operating statistics block.
Corporate net interest and trading income $A816m (up 90%), net operating income $A458m, opex (1,909), tax (730) and a net loss contribution of $A(2,184)m, with headcount 8,958.
Detailed result table with comparison columns and headcount.
Divider introducing the funding appendix.
Large section number in a black box on a mint panel beside a mobile crane photo.
Organisation diagram showing Macquarie Group Limited (non-bank group funded by commercial paper, senior bonds, unsecured loans and equity) above Macquarie Bank Limited (BFS and CGM) and the Non-Bank Group (MAM, MacCap and parts of CGM), with MBL funding sources listed.
Top-down org diagram with boxes and a funding sources list.
Total assets of $A578.3b less derivative revaluation (39.8), segregated funds (11.0), other (14.9) and self-funded trading (52.7) give net funded assets of $A459.9b (March 2026: $A432.6b; September 2025: $A401.3b).
Reconciliation table with three period columns.
Funding sources and funded assets totalling $A459.9b, including deposits $A244.2b, bonds $A55.9b and equity $A37.3b, with deposits 53% of funding and a 4.1 year weighted average maturity.
Sources and assets table with a maturity profile bar chart.
Bank Group funding table totalling $A389.8b with a weighted average maturity of 3.8 years and a maturity profile chart.
Funding table with a maturity profile bar chart.
Non-Bank Group funding table totalling $A70.1b with a weighted average maturity of 4.4 years and a maturity profile chart.
Funding table with a maturity profile bar chart.
Plain-language explanations of the four reconciling items: derivative revaluation, segregated funds, other, and self-funded trading assets.
Four text columns, one per reconciling item.
Divider introducing the capital appendix.
Large section number in a black box on a mint panel beside a waterfront apartment building photo.
Capital at 10.5% of $A33.8b (MAM 3.9, BFS 8.4, CGM 11.9, MacCap 6.5, Corporate 3.1) plus a $A9.6b surplus gives supply of $A43.4b; ROE is 25% for annuity-style groups (20-year average 21%) and 14% for markets-facing groups (17%), with group ROE 13.8% and ROTE 14.8%.
Capital by group table with an ROE comparison panel.
Eligible capital of $A43,423m (Bank Gross Tier 1 27,478 plus non-bank 15,945) less capital requirement of $A33,789m (bank 20,945 on RWA of 166,304; non-bank 12,844) leaves a surplus of $A9,634m.
Reconciliation table from eligible capital to surplus.
Bank Group capital requirement of $A20,945m built from credit RWA 136,585, market 7,636, operational 20,181 and IRRBB 1,902.
Table by risk type with RWA and capital columns.
Explanation of the Non-Bank Group ECAM framework with a Basel III versus ECAM comparison for credit, equity, market and operational risk.
Explanatory text beside a comparison table.
Non-Bank Group capital requirement of $A12,844m comprising credit 3,881, equity 6,320, market 261, operational 653 and other 1,729.
Table by risk type with a total row.
Divider introducing the glossary.
Large section number in a black box on a mint panel beside a turbine engineers photo.
Two-column acronym table from $A/AUD through IRRBB, including definitions of 1H (half year ended 30 September), 2H (half year ended 31 March) and FY (full year ended 31 March).
Two-column acronym and definition table.
Continuation of the acronym table from IT through YTD.
Two-column acronym and definition table.
Final cover page identical to the opening cover, presentation to investors and analysts for the half year ended 30 September 2026.
Black text panel over an aircraft-on-apron photo, identical to page 1.
このスライドと基礎となるプレゼンテーションコンテンツに関する一般的な質問。
Macquarie's financial year runs from 1 April to 31 March, so FY27 is 1 April 2026 to 31 March 2027. 1H27 is the first half of that year, the half year ended 30 September 2026 (April to September 2026). 2H26 is the half year ended 31 March 2026 and 1H26 is the half year ended 30 September 2025.
It is Macquarie Group Limited's presentation to investors and analysts for the result announcement for the half year ended 30 September 2026, lodged with the ASX (ASX: MQG) and dated 6 November 2026 on the cover. All amounts are in Australian dollars, written as $A, $Am and $Ab.
Profit attributable to shareholders was $A2,478m, up 50% on 1H26, on net operating income of $A9,568m, with an annualised ROE of 13.8% and basic EPS of $A6.52. The interim dividend is $A3.25 per share, 35% franked, and CET1 is 12.9% on the APRA basis (17.7% harmonised) with a $A9.6b capital surplus.
The deck covers the Group result, the four Operating Groups (Macquarie Asset Management, Banking and Financial Services, Commodities and Global Markets, Macquarie Capital), the dividend, income statement drivers, profit bridges, capital, funding and liquidity, regulatory updates and the outlook. The appendices add detailed segment results, funding structure and funded balance sheet tables, Basel III capital tables and a glossary.
Yes. The deck is a strong pattern library for waterfall bridges, black KPI panels with large headline numbers, annuity-style to markets-facing gradient bars, donut composition charts, outlook factor tables and funded balance sheet and capital reconciliation tables. Replace the figures and wording with your own data and keep the structure.
The deck is available as a PDF for reading and as an editable PPTX so you can adapt the layouts, tables and charts to your own material.
No. It is provided for reference and education about how a listed financial group presents results. Macquarie's own disclaimer (page 2) states the content is not advice and includes forward-looking statements. Refer to Macquarie Group's official ASX announcements and consult a licensed adviser before making investment decisions.

Create Your Own Slides
Turn your ideas into professional presentations in seconds with 2slides AI.
プロフェッショナルなデザインを参照し、スタイルを選択し、完璧なテキストレンダリングでスライドを生成。Nano Banana搭載—今すぐプレゼンテーションの作成を始めましょう。
© 2026 2slides。全著作権所有。


