
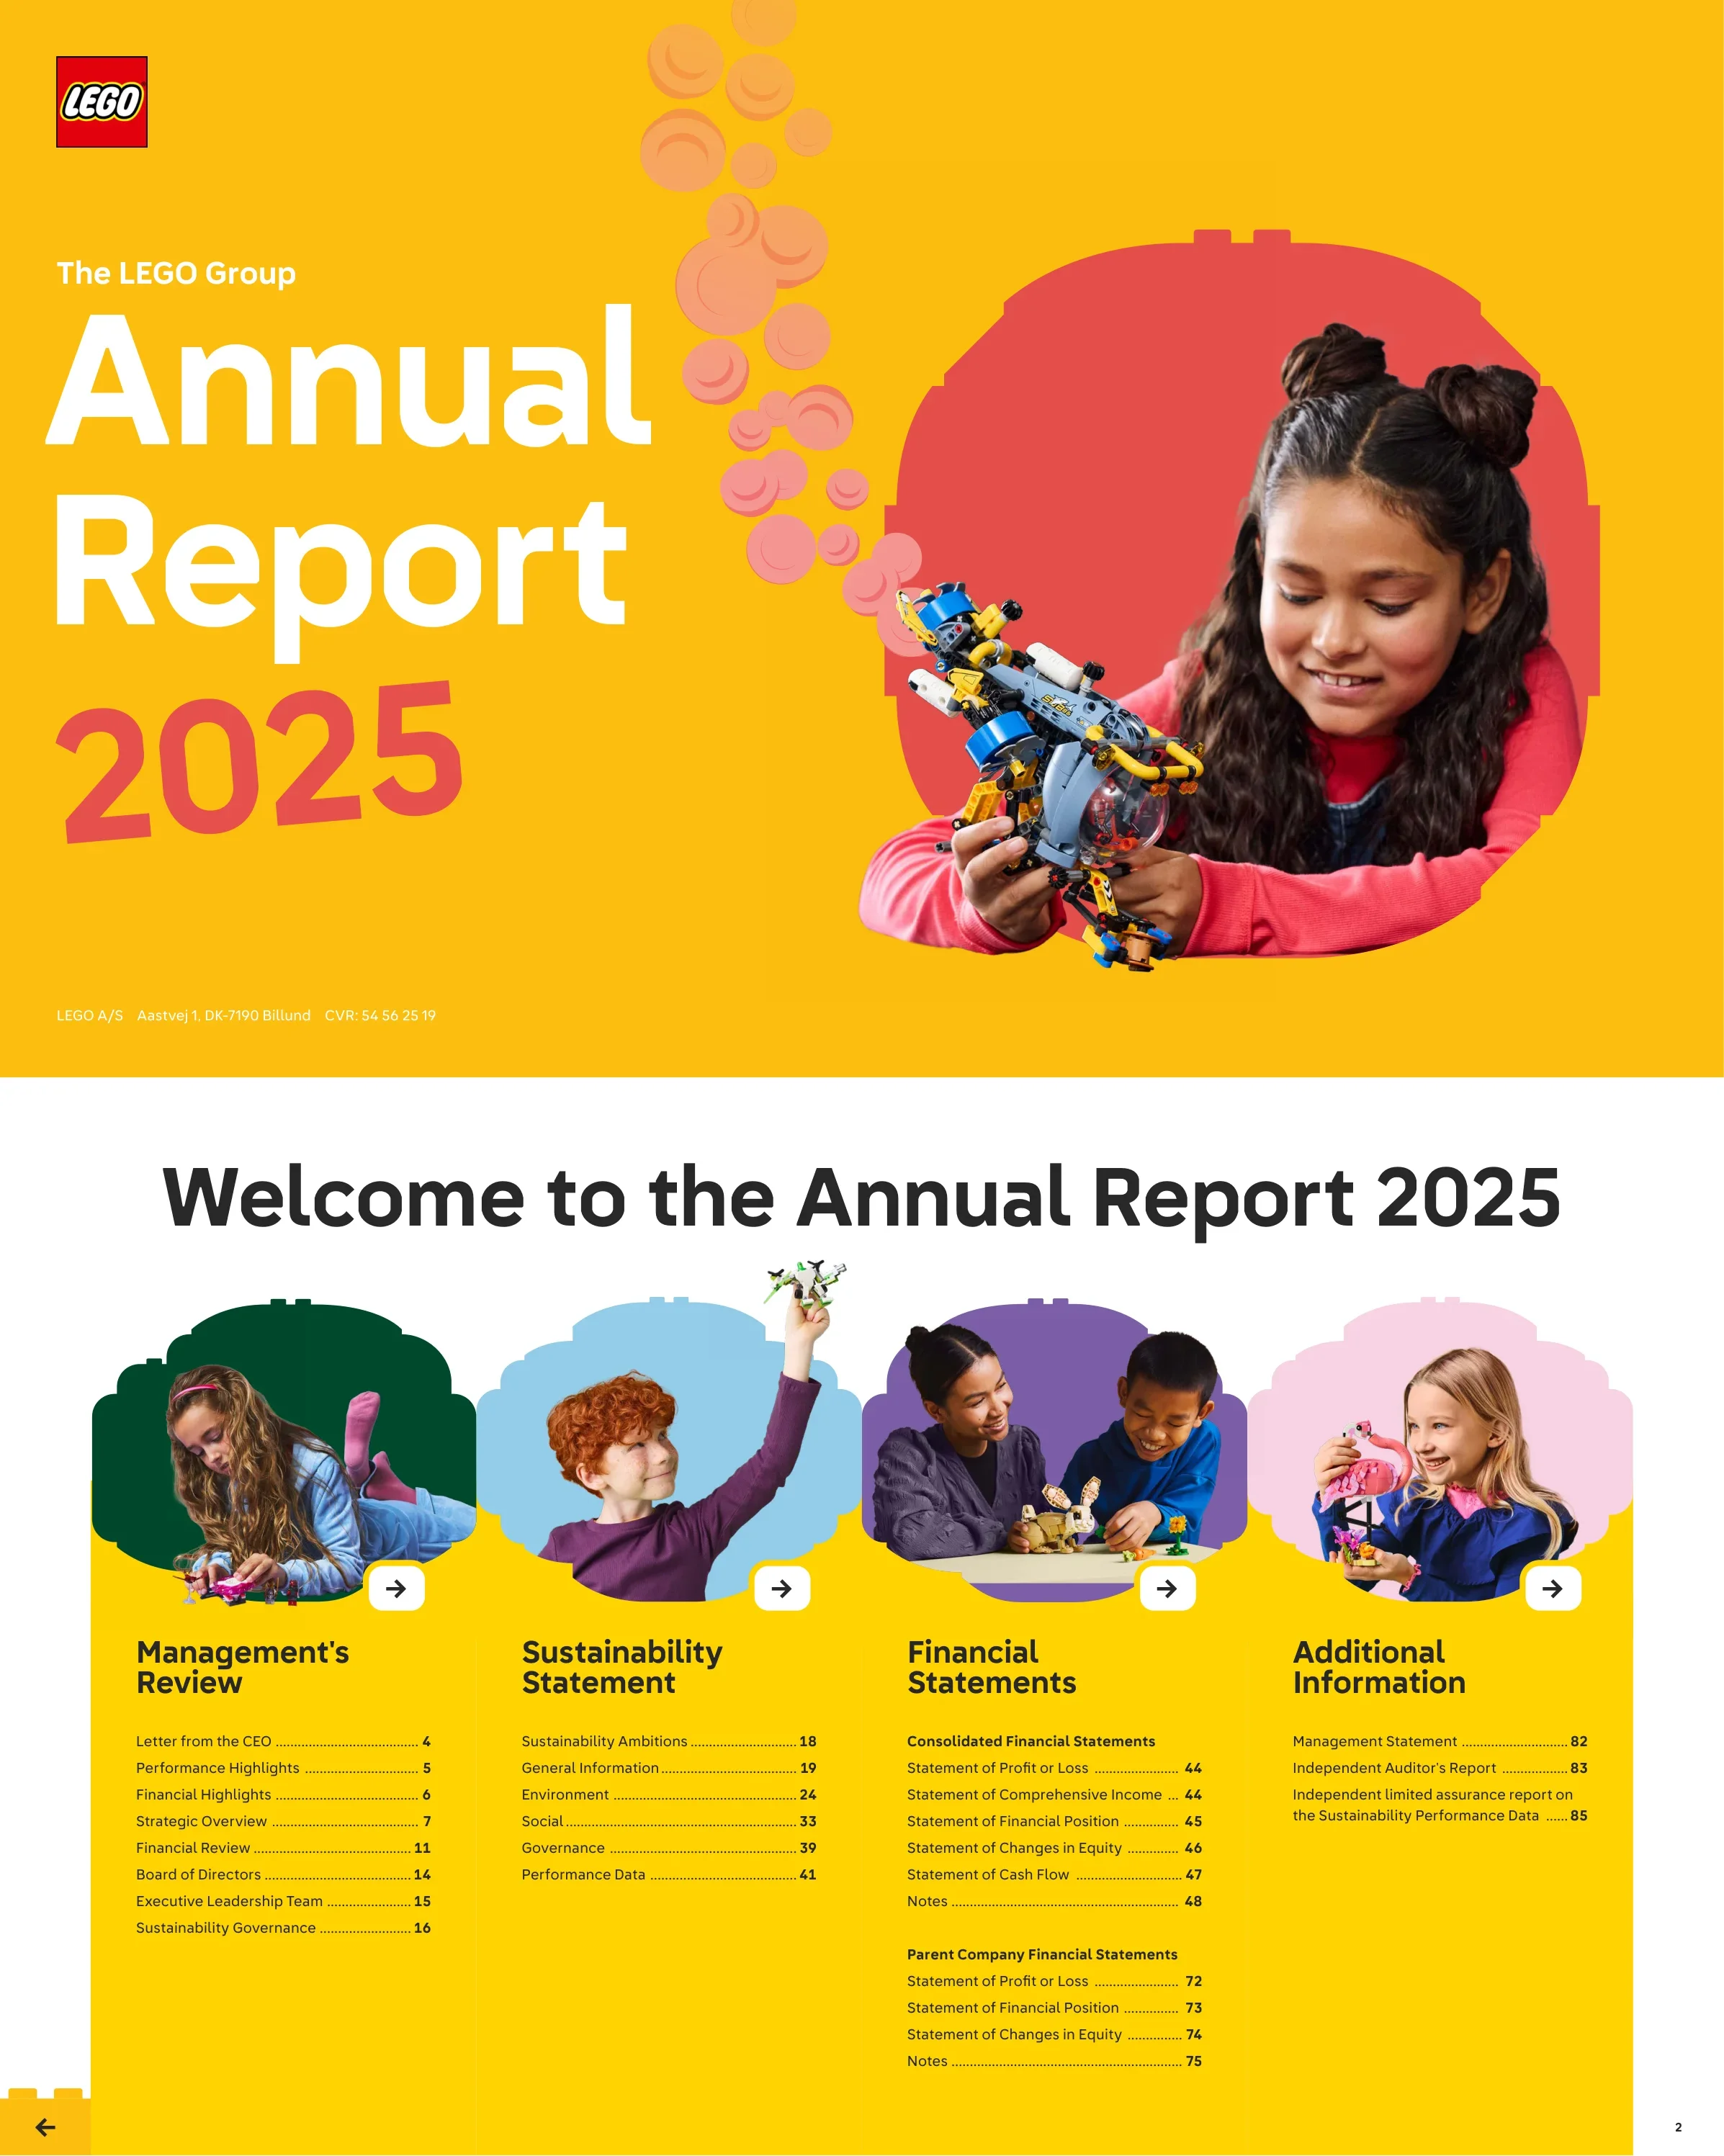
The LEGO Group Annual Report 2025 - Comprehensive corporate annual report covering management review, sustainability statement, financial statements, and additional information
クイックナビゲーション
タグ
スライドを共有
The LEGO Group Annual Report 2025 - Comprehensive corporate annual report covering management review, sustainability statement, financial statements, and additional information
レイアウト、主要コンテンツ、視覚要素を含む各スライドページの詳細ビュー。
Title cover with LEGO logo, bold Annual Report 2025 text, and photography of a girl building a LEGO Technic model
Split layout with yellow background, large serif/sans typography left, circular photo frame with child right
Interactive table of contents with four main sections: Management Review, Sustainability Statement, Financial Statements, Additional Information
Four-column layout with photos, navigation arrows, and detailed page listings per section
Section opener for Management Review with subsection listing
Full-page green background with large pink typography, child photo in LEGO brick frame, navigation list
CEO Niels B Christiansen letter highlighting record results, double-digit growth, sustainability investments, and portfolio innovation
Three-column text layout with CEO headshot photo, signature, and green callout quote box
Financial KPIs (Revenue DKK 83.5B +12%, Operating Profit DKK 22.0B +18%, FCF DKK 10.8B), sustainability metrics, and strategic initiatives
Dense dashboard with bar charts, KPI cards, photo highlights, and three strategic initiative columns
Five-year financial summary table (2021-2025) with P&L, balance sheet, cash flow, employees, and financial ratios
Dual data tables with purple column headers and LEGO brick decorations
Six strategic pillars: Innovating play & brand, Expanding global footprint, Creating memorable brand retail experiences, Advancing digital ambitions, Investing in inclusive workplaces, Building a more sustainable future
Six equal columns with green card frames, photos of employees/facilities, and descriptions
70th anniversary of LEGO System in Play, 868 products (record), Formula 1 partnership, Merlin acquisition, 30 years of LEGO Games
Multi-column editorial with F1 race photography, product portfolio bar chart, Botanicals image, and LEGO minifigure
Six factories globally, Vietnam factory opening, 1,112 stores worldwide, 25th anniversary of online shop, Hungary +30% capacity
Four-quadrant layout with factory photos, store count callout (1,112), Paris store opening photo
Digital transformation programs, ERP modernization, new Americas HQ in Boston, London Hub relocation, 130+ nationalities, record employee satisfaction
Split page with digital initiatives left and workplace highlights right, with photos of offices and employees
Revenue DKK 83.5B (+12%), consumer sales +16%, operating profit DKK 22.0B (+18%), operating margin 26.4%, market share gains
Split with consumer sales growth bar chart left and revenue/operating profit KPI cards with green star decorations right
Free cash flow, People Promise, Partner Promise, enterprise risks, macroeconomic uncertainty, cyber security, compliance risks, capital investments
Dense three-column text with investment bar chart and callout for DKK 9.2B capital spend
Total Tax Contribution DKK 17.8B, taxes borne DKK 7.2B, taxes collected DKK 10.6B by category; gender balance 38/62; 2026 outlook
Split with stacked tax bar charts left and tax category breakdown with colored legend right
Eight board members with photos and bios: Thomas Kirk Kristiansen (Chair), Soren Thorup Sorensen, Ebi Atawodi, Fiona Dawson, Alessandro Nasi, Jan Thorsgaard Nielsen, Ilkka Paananen, Anne Sweeney
Grid of eight dark green cards with circular headshots, names, titles, and detailed biographical text
Seven ELT members: Niels B Christiansen (CEO), Jesper Andersen (CFO), Atul Bhardwaj (CDTO), Colette Burke (CCO), Julia Goldin (CPMO), Carsten Rasmussen (COO), Loren I Shuster (CPO)
Grid of seven pink/salmon cards with circular headshots and detailed role descriptions
Governance framework: Board of Directors, Audit Committee, ELT, Corporate Compliance Board, Sustainability ELT Sponsor Group with roles and chairs
Organizational chart with green gradient cards connected by arrows, LEGO flower decoration
Section opener listing six sustainability subsections
Light blue background with large orange serif typography, boy with LEGO drone photo, star decorations
Three pillars: Children (learning through play), Environment (renewable materials), People (inclusive workplaces); since 1932 mission
Three equal photo columns with blue-tinted description areas below
ESRS-aligned sustainability reporting, CSRD compliance roadmap, ESG topic icons (Environment/Social/Governance), scope and measurement basis
Split with LEGO scientist minifigure illustration left and dense reporting methodology text right
DMA methodology, ESRS 1 framework, impact and financial materiality assessment, stakeholder engagement, data sources
Split with LEGO minifigure dialogue illustration left and methodology text right
Materiality matrix with 16 material topics across Environment, Social, and Governance; DMA conclusion
Split with materiality scatter plot left and topic listing table right
LEGO System in Play value chain: Upstream (raw materials), Own Operations (moulding), Downstream (consumers), Circularity (rebuilding/reuse)
Four-column flow diagram with blue gradient cards showing upstream to downstream to circular
Detailed value chain illustration with impacts, risks, and opportunities across Environment, Social, and Governance categories
Illustrated value chain infographic left with IRO assessment table right
GHG emissions data (Scope 1-3), science-based 37% reduction target by 2032, net zero by 2050, updated methodology
Data-rich page with GHG emissions table, solar panel photo, and methodology text
Scope 1&2 emissions bar chart, 322.7K tonnes GHG reductions via mass balance, carbon compensation programs
Split with bar chart left, large green reduction statistic center, and compensation text right
GHG intensity declining, 622.2 GWh energy consumption, solar energy growth, water supplied 707.8K m3, Hungary water savings
Multi-chart layout with stacked emissions bars, energy table, intensity line chart, and water consumption bars
Climate adaptation policies, water stress analysis, Mexico wastewater reuse, Hungary nanofiltration, total water consumption 382.8K m3
Split with water data charts right and policy text left, energy consumption table bottom
52% renewable/recycled materials, mass balance increase from 12% to 52%, paper-based packaging transition, 56% packing lines converted
Split with sustainable materials stacked bar chart left and circularity text with factory photo right
Total waste 37,009 tonnes, waste to landfill 71 tonnes, zero waste to landfill achieved at some sites, waste volume and landfill bar charts
Data tables for hazardous and non-hazardous waste with bar charts and donut visualizations right
Detailed methodology for GHG calculations, energy reporting, Scope 1-3 measurement approaches, water and waste KPI definitions
Dense three-column text with methodology descriptions and calculation formulas
Downstream transportation, franchising emissions, carbon credits methodology, mass balance reporting, recyclable content definitions
Dense three-column text continuation with additional calculation methodologies
Water supplied, water consumption, and water stress area definitions and measurement methodologies
Two-column text with water KPI definitions
33,801 employees, motivation score 83, employee turnover 12.7%, zero fatalities, lost time injury rate 0.8, safety programs
Multi-KPI layout with motivation bar chart, safety metrics, and large statistical callouts right
Gender split 54/45/0.4%, age distribution, 42.8% female top management, benefits programs, LEGO U learning platform, inclusion networks
Split with gender/age tables and pie charts left and inclusive workplace narrative right
20% higher-risk supplier non-conformities, EHRDD due diligence, 11.7M children impacted, International Day of Play, Build the Change
Three-part layout: sourcing metrics left, children programs center, social impact right
Zero product recalls since 2009, data privacy policies, 3.6M parent engagement, 22% employee volunteering, 11.7M children impacted via SR initiatives
Multi-metric layout with bar charts for children impacted, parent engagement, and volunteering percentage
Detailed definitions for workforce metrics, safety KPIs, responsible sourcing measurement, children impact counting methodology
Dense three-column accounting methodology text
Children impacted counting assumptions, parent engagement methodology, product recalls definition, volunteering measurement
Three-column text with community event photo
Speaking up mechanisms, whistleblower protections, advocacy and political activity, ethics code, IP rights, zero political contributions, zero convictions
Multi-section layout with governance topics, zero political contributions callout, and zero convictions badge
Political contributions and convictions/fines definitions and measurement methodology
Single-column text with policy definitions
Comprehensive sustainability KPI table with targets for 2026/2025 and results for 2025/2024/2023 covering emissions, energy, water, materials, waste
Full-page data table with blue ESG icons and column headers for targets vs results
Social KPIs (motivation, headcount, safety, diversity, children impacted) and governance KPIs (convictions, political contributions)
Continuation of performance data table with social and governance metrics
Section opener for consolidated and parent company financial statements
Purple background with large white serif typography, parent-child LEGO photo, navigation listing
Revenue DKK 83,530M, gross profit DKK 56,609M, operating profit DKK 22,034M, net profit DKK 16,710M; comprehensive income DKK 16,564M
Dual purple-accented financial tables side by side
Total assets DKK 79,360M, total equity DKK 49,335M, total liabilities DKK 30,025M at 31 December 2025
Dual balance sheet tables (assets left, equity & liabilities right) with purple headers
Equity movements for 2025 and 2024 including net profit, comprehensive income, and DKK 9,000M dividend
Equity reconciliation table with accounting policies sidebar
Operating cash flow DKK 19,931M, free cash flow DKK 10,783M, net cash flow DKK 215M; adjusted FCF DKK 9,649M
Cash flow statement with operating, investing, financing sections and FCF reconciliation
Index of notes organized by: Basis of preparation, Operating Profit, Operating assets and liabilities, Capital structure, Other disclosures
Purple castle-themed illustration with three-column notes index
IFRS basis, functional currency DKK, consolidation practice, foreign currency translation, financial highlights definitions
Three-column text with financial ratio definitions sidebar
IFRS 18 adoption impact, significant accounting estimates and judgements, key estimation areas
Two-note layout with standards update left and estimates right, LEGO figure decoration
Revenue by type (sale of goods DKK 82,638M, licence DKK 749M) and by region (Americas DKK 38,429M, EMEA DKK 34,719M, Asia Pacific DKK 9,490M)
Revenue breakdown tables with accounting policies for revenue recognition
Total expenses DKK 61,496M broken down by raw materials, employees, depreciation, licence costs, marketing, distribution
Expense classification tables with accounting policy descriptions
Employee costs DKK 17,111M, 29,112 average FTE, 33,801 headcount; income tax DKK 4,977M, effective rate 22.9%
Dual tables with employee cost breakdown and tax reconciliation
Deferred tax movements, IAS 12 Pillar Two impact assessment, deferred tax assets and liabilities breakdown
Deferred tax reconciliation tables with OECD Pillar Two policy note
PPE carrying value DKK 37,470M across land/buildings, plant/machinery, fixtures, and construction in progress
Detailed PPE movement table (cost and depreciation) with accounting policies
Prior year PPE comparative data with depreciation policies and useful life estimates
Comparative PPE movement table with depreciation schedule callout
Inventories DKK 6,349M, trade receivables net DKK 11,602M, loss allowance DKK 474M
Dual tables with inventory and receivables breakdowns and accounting policies
Credit risk aging analysis for 2025 and 2024 with weighted average loss rates by aging bucket
Detailed credit risk tables with gross carrying, loss allowance, and net carrying amounts
Other debt DKK 10,700M, deferred income DKK 1,800M (loyalty programme, gift cards, government land)
Dual tables with debt composition and deferred income breakdown
Financial income DKK 182M, financial expenses DKK 529M; share capital DKK 20M (A/B/C shares), DKK 9,000M dividend paid
Dual financial tables with share capital structure and dividend information
Right-of-use assets DKK 8,032M for 2025, DKK 6,385M for 2024 across rental premises and other assets
Side-by-side lease asset movement tables for 2025 and 2024
Lease liabilities DKK 8,070M, maturity profile, P&L impact DKK 1,977M, lease accounting policies
Lease liability table, maturity schedule, and P&L impact table with policies
Lease modification policies, financial risk overview (credit, commodity, currency, interest, liquidity all Low)
Split with lease policies left and financial risk assessment with risk table right
Power purchase agreements in Vietnam (42,000 MWh solar), contract terms and accounting classification
PPA contract table with duration and type details
Currency exposure analysis across DKK/AUD, CAD, CNY, CZK, EUR, GBP, HUF, MXN, SGD, USD with sensitivity
Large currency exposure and sensitivity table
Hedging activities (AUD, CAD, GBP, USD), forward contract amounts DKK 9,716M, virtual PPA accounting
Detailed hedging table with fair value and cash flow amounts, accounting policies
Audit fees DKK 32M, ELT remuneration DKK 282M (7 members), salary/incentive breakdown
Dual tables for auditor fees and executive remuneration
Contingent liabilities DKK 11,410M; related party transactions with LEGO Holding, KIRKBI, LEGO Foundation, Motion JVco
Contingent liability table and related party transaction tables
KIRKBI A/S, KIRKBI Invest, Motion JVco, LEGO Foundation transactions and loan agreements
Detailed related party transaction and loan tables
Merlin Discovery Centre acquisition (29 centres, GBP 215M / DKK 1,830M), preliminary purchase price allocation, world map of attractions
Acquisition details with world map showing Discovery Centre locations
Complete subsidiary listing organized by Manufacturing, Sales & Distribution, and Other entities across 30+ countries
Three-column entity listing with LEGO A/S org chart header
Parent company revenue DKK 628M, net profit DKK 16,710M (driven by DKK 16,518M subsidiary profits)
Split with purple Parent Company section title left and P&L table right
Parent total assets DKK 49,530M, equity DKK 48,949M, primarily investments in subsidiaries DKK 48,260M
Dual balance sheet tables with blue headers
Equity movements including DKK 14,407M equity method reserve increase and DKK 8,000M proposed dividend
Equity reconciliation table for 2025 and 2024
Index for parent company notes covering preparation, P&L, financial position, and other disclosures
Blue castle-themed illustration with two-column notes index
Parent company accounting policies, employee costs DKK 157M for 5 average employees, executive remuneration DKK 80M
Dual note layout with basis of preparation and employee tables
Parent financial income DKK 111M, financial expenses DKK 62M, income tax DKK 110M
Three financial tables stacked vertically
Minimal parent PPE DKK 4M, investments in subsidiaries DKK 48,260M with DKK 3,074M additions in 2025
PPE movement table and investment in subsidiaries reconciliation
Deferred tax DKK 59M, share capital 205 shares (19 A-shares, 150 B-shares, 36 C-shares), ownership by LEGO Holding A/S
Dual tables for deferred tax and share capital details
Parent guarantees DKK 4,621M, related party transactions, proposed dividend DKK 8,000M
Three notes with contingent liabilities, related party, and profit distribution tables
Section opener for management statement, auditor report, and sustainability assurance
Pink background with large red serif typography, girl with LEGO flamingo photo
Board adoption of annual report dated Billund 4 March 2026, signed by CEO and full Board of Directors
Statement text left with Board of Directors grid right on red/green themed background
PricewaterhouseCoopers unqualified opinion on consolidated and parent company financial statements for FY2025
Formal audit report text with opinion, basis for opinion, and management responsibility sections
Auditor responsibilities, going concern assessment, audit procedures, PwC signatures (Mads Melgaard, Kim Tromholt)
Continuation of audit report with responsibilities and PwC signoff
PwC limited assurance conclusion on sustainability performance data, ISAE 3000/3410 standards
Formal assurance report with conclusion, standards, and scope description
Work performed, management responsibilities, PwC independence and quality control, auditor signatures
Continuation of assurance report with PwC signoff dated Aarhus 4 March 2026
LEGO A/S corporate details (Billund, Denmark, CVR 54 56 25 19), design by eTypes, trademark notices for F1, Minecraft, Fortnite, Lucasfilm, Nintendo
Yellow background with corporate details bottom left and trademark notices right
このスライドと基礎となるプレゼンテーションコンテンツに関する一般的な質問。
This is a comprehensive 87-page corporate annual report from The LEGO Group covering four major sections: Management Review (CEO letter, strategy, financials, leadership), Sustainability Statement (aligned with European ESRS standards covering environment, social, and governance), full IFRS Financial Statements (consolidated and parent company), and Additional Information (management statement, PwC auditor reports, and sustainability assurance).
The report uses LEGO's distinctive brand design system with four color-coded sections: green/yellow for Management Review, orange/blue for Sustainability, purple for Financial Statements, and pink/red for Additional Information. Each section features LEGO brick-shaped photo frames, minifigure illustrations, playful star and brick decorations, and a mix of bold serif headlines with clean sans-serif body text. The design masterfully balances child-friendly brand imagery with institutional-grade corporate disclosure.
The LEGO Group achieved record results in 2025: Revenue of DKK 83.5 billion (+12% growth), Operating Profit of DKK 22.0 billion (+18%), Net Profit of DKK 16.7 billion (+21%), Free Cash Flow of DKK 10.8 billion, and an Operating Margin of 26.4%. The company significantly outperformed the toy industry which grew only 7% vs a slight decline the prior year. Total assets reached DKK 79.4 billion with equity of DKK 49.3 billion.
The sustainability section spans approximately 25 pages and is aligned with the European Sustainability Reporting Standards (ESRS) as a step toward CSRD compliance. It covers a full Double Materiality Assessment, value chain mapping, Scope 1-3 GHG emissions with science-based targets (37% reduction by 2032, net zero by 2050), energy and water consumption, resource stewardship (52% renewable/recycled materials), social metrics (33,801 employees, zero fatalities), and governance disclosures. All sustainability data is independently assured by PricewaterhouseCoopers.
This report serves as excellent inspiration for annual report design and structure. The four-section architecture (management review, sustainability, financials, additional information), color-coding system, data visualization approaches, and ESG reporting framework are universally applicable. The design system shows how to maintain strong brand identity while meeting rigorous corporate disclosure requirements.
The report employs diverse chart types: vertical bar charts for multi-year trends, stacked bar charts for composition analysis (materials, emissions), line charts for intensity metrics, pie/donut charts for demographics (gender, age), scatter plots for materiality assessment, flow diagrams for value chain, organizational charts for governance, and world maps for global operations. Each section uses its designated color palette consistently across all visualizations.
The LEGO Group had 33,801 employees at year-end 2025 (up 8% from 31,282 in 2024) with an average of 29,112 full-time employees. The report highlights a record motivation and satisfaction score of 83, zero workplace fatalities, 130+ nationalities represented, 42.8% female top management, and significant investments in new workplaces including a new Americas HQ in Boston, office expansions in Arizona and London, and new campuses under construction in Billund, Denmark.
LEGO outlines six strategic pillars: 1) Innovating play and brand (868 record products, F1 partnership, Merlin acquisition), 2) Expanding global footprint (6 factories, 5 distribution centres, Vietnam factory opening), 3) Creating memorable retail experiences (1,112 stores in 54 markets), 4) Advancing digital ambitions (ERP transformation, platform modernization), 5) Investing in inclusive workplaces, and 6) Building a more sustainable future (52% renewable materials, paper-based packaging transition). The 2026 outlook projects single-digit revenue growth with continued strategic investment.

Create Your Own Slides
Turn your ideas into professional presentations in seconds with 2slides AI.
プロフェッショナルなデザインを参照し、スタイルを選択し、完璧なテキストレンダリングでスライドを生成。Nano Banana搭載—今すぐプレゼンテーションの作成を始めましょう。
Your AI Agent for slides. Save time, shine faster with intelligent presentation creation.




© 2026 2slides. All rights reserved.