
収録コレクション: 投資家向けプレゼン資料の実例
E.SUN Financial Q3 2026 Earnings Presentation (Financial Review of 3Q 2026) from E.SUN Financial Holding Co. (TWSE: 2884), dated Nov 2026. The 45-page English deck, filed on Taiwan's Market Observation Post System (MOPS) for the investor conference (法說會), reviews nine-month 2026 results across E.SUN FHC, E.SUN Bank, Mercuries Life (acquired Sep 1, 2026) and other subsidiaries, with most figures stated in NT$ (New Taiwan dollars), printed in the deck as TWD.
このスライドの表紙をスタイルの参考にして、ご自身の内容からスライドを作成します。 下のページから好きな1枚を選び、そのレイアウトを参考にすることもできます。
クイックナビゲーション
タグ
スライドを共有
E.SUN Financial Q3 2026 Earnings Presentation (Financial Review of 3Q 2026) from E.SUN Financial Holding Co. (TWSE: 2884), dated Nov 2026. The 45-page English deck, filed on Taiwan's Market Observation Post System (MOPS) for the investor conference (法說會), reviews nine-month 2026 results across E.SUN FHC, E.SUN Bank, Mercuries Life (acquired Sep 1, 2026) and other subsidiaries, with most figures stated in NT$ (New Taiwan dollars), printed in the deck as TWD.
レイアウト、主要コンテンツ、視覚要素を含む各スライドページの詳細ビュー。
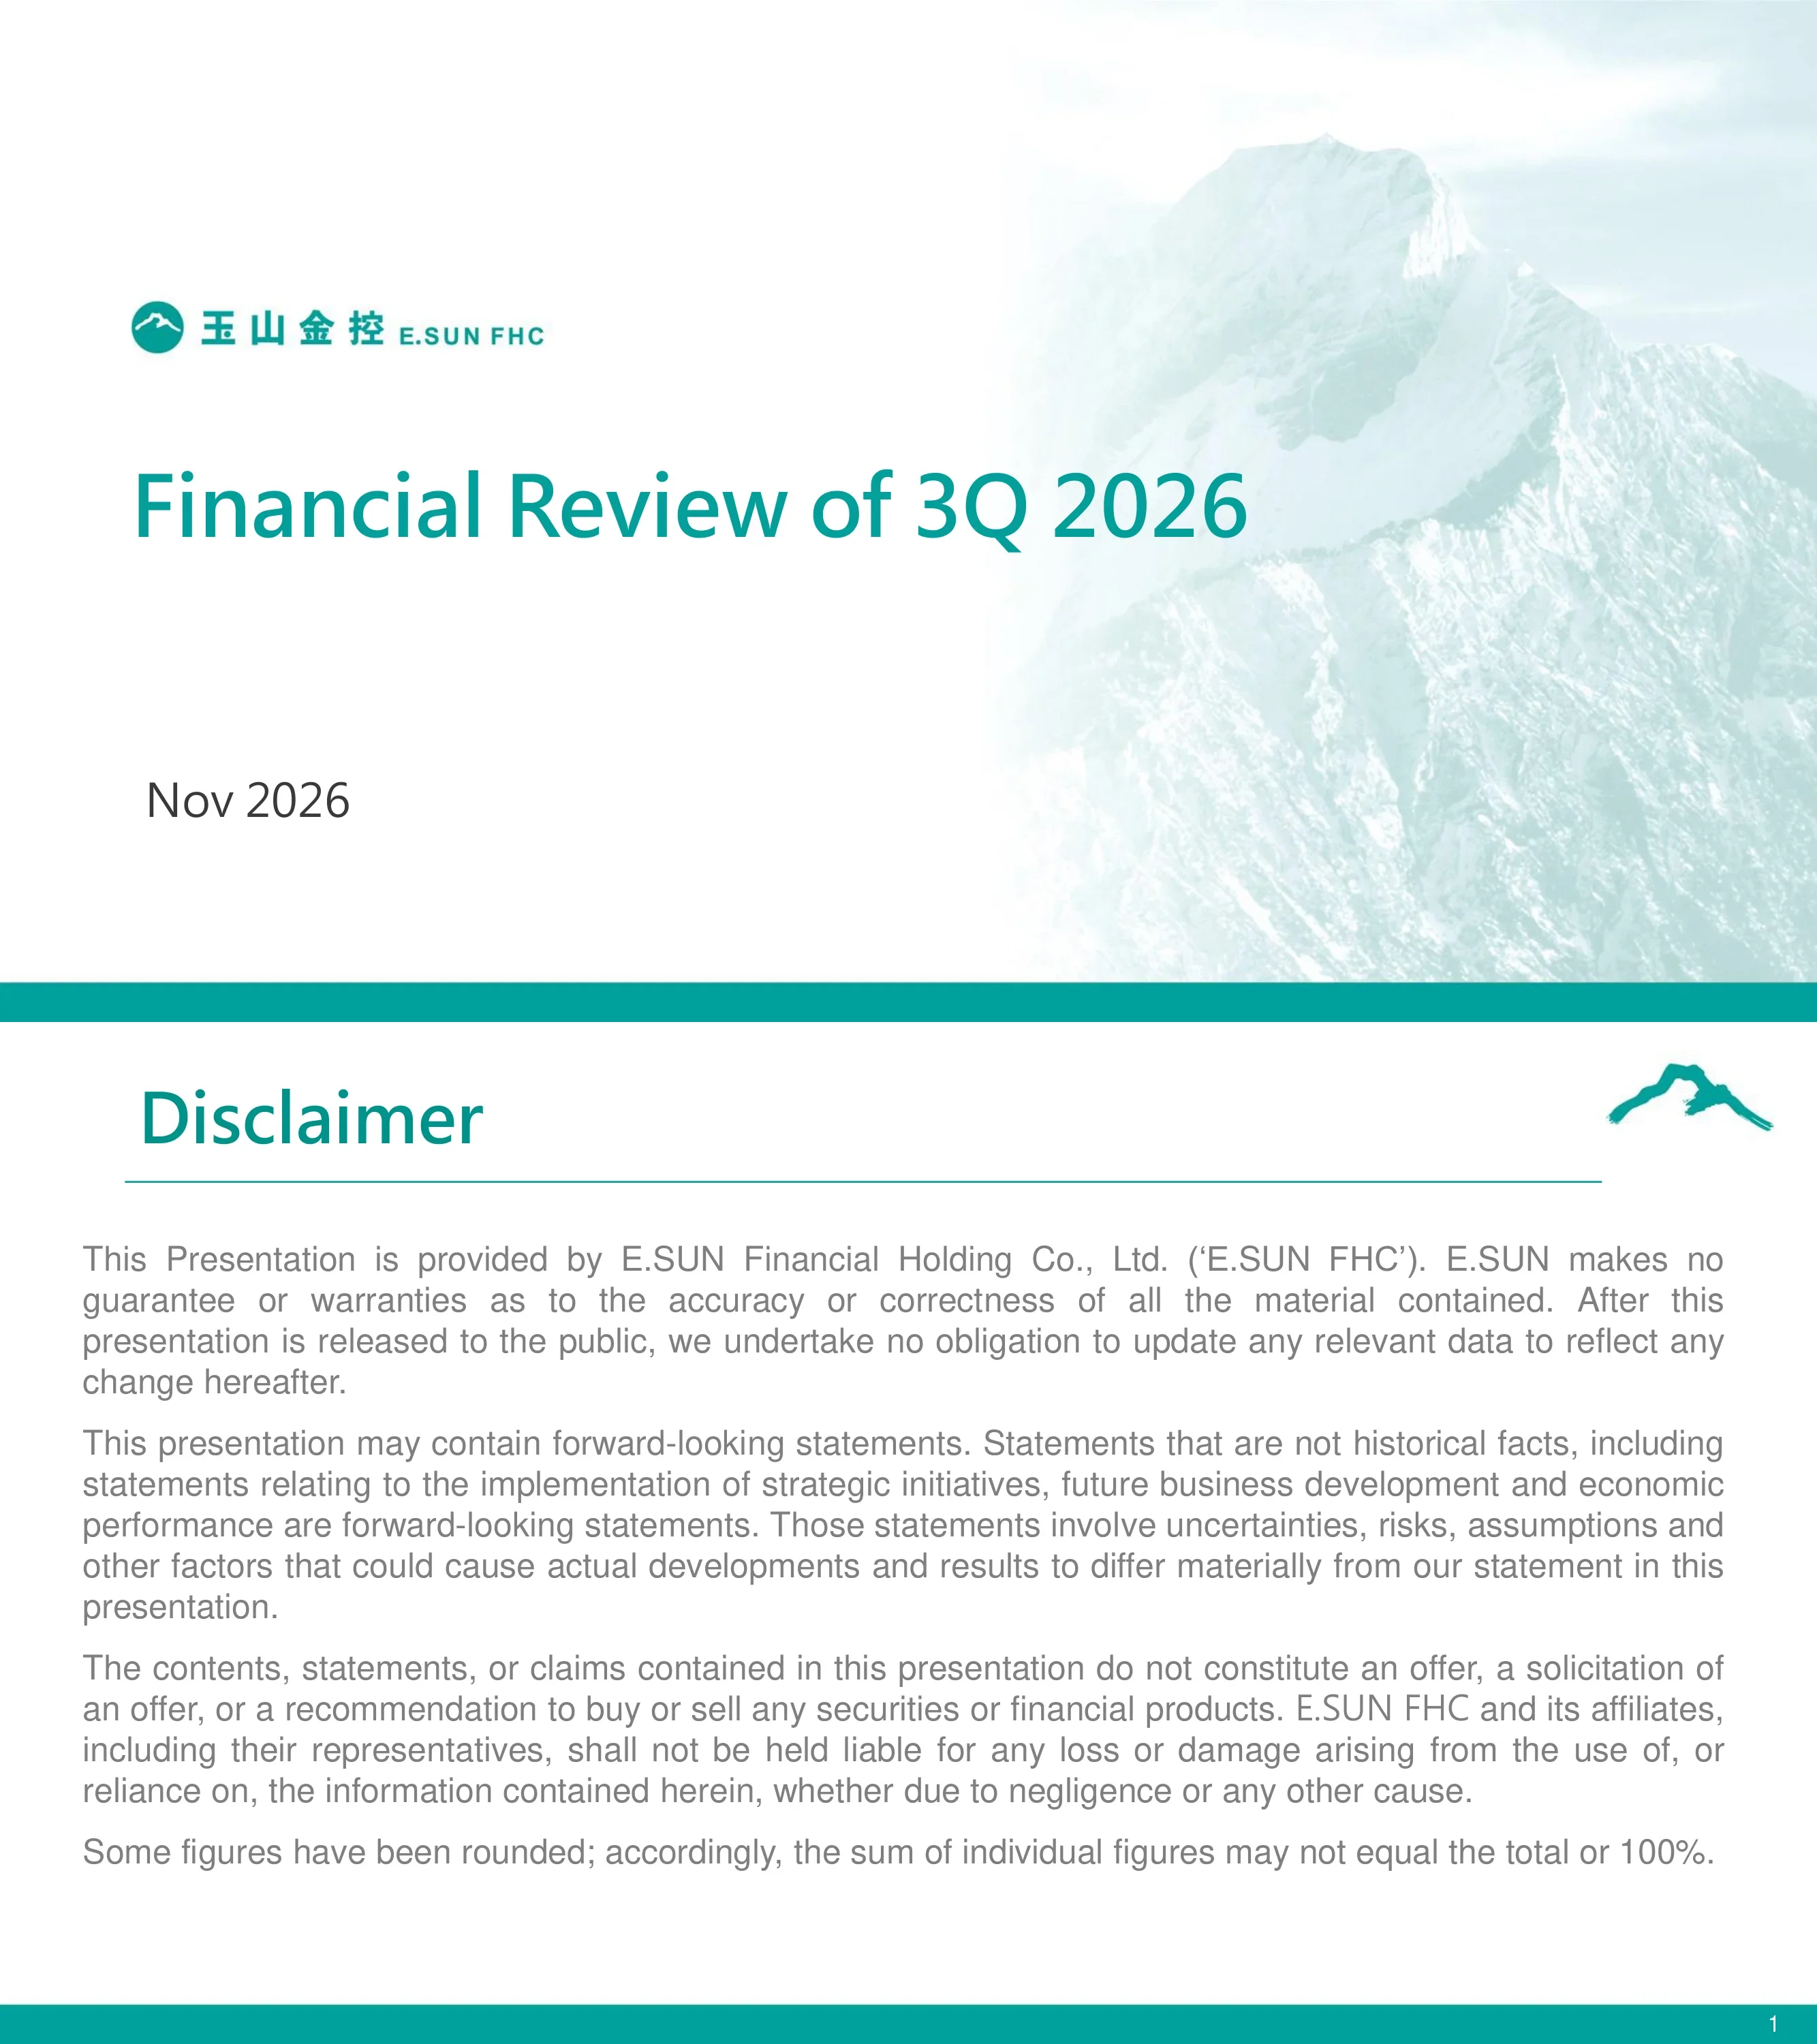
Cover slide titled 'Financial Review of 3Q 2026', dated Nov 2026, with the E.SUN FHC (玉山金控) logo.
Left-aligned logo, large teal title and date over a pale watermark photo of a snow-capped mountain on the right, with a teal footer band.
Legal disclaimer stating the presentation is provided by E.SUN Financial Holding Co., Ltd., may contain forward-looking statements, is not an offer or recommendation to buy or sell securities, and that rounded figures may not sum to totals or 100%.
Title with a rule and brush-stroke mountain logo at top, four justified grey paragraphs below.
Agenda lists five parts: 2026 3Q Results of E.SUN FHC, of E.SUN Bank, of Mercuries Life, of Other Subsidiaries, and Appendix - Financial Statements.
Right-aligned teal heading and five-line list over translucent overlapping mountain-shaped triangles.
Section divider titled 'E.SUN FHC' featuring the artwork 'Silent Winds under Mt. Jade' by Thierry Feuz (90x70cm, mixed media, 2022).
Section title on the left, framed painting with caption on the right, translucent triangle background.
Table (TWD million) comparing 2026.09 with 2025.12: FHC total assets 6,650,471 vs 4,516,533, Bank 5,036,165, Mercuries Life 1,565,078, Securities 72,919, Venture Capital 6,926, Asset Management 3,725. Book value per share TWD 19.69 vs 16.86, double leverage ratio 116.50% vs 115.02%, FHC CAR 118.58% vs 128.02%, plus channel counts (140 domestic bank branches, 35 overseas locations in 11 countries and regions, 5 life branches, 249 agency offices, 17 securities branches).
Striped three-block table (Total Assets, Key Financials, Channels) with footnotes on preliminary figures, IFRS 3 fair value adjustments and 30.16% foreign ownership.
Five bullet blocks: E.SUN FHC 9M26 net revenue TWD 81.8bn (+20.8%) and net profit TWD 32.6bn (+24.3%), EPS TWD 1.99, ROE 13.97%, ROA 0.78%, Mercuries Life acquisition completed Sep 1. E.SUN Bank net profit TWD 28.0bn (+10.9%), loans TWD 2.98tn (+17%), NPL ratio 0.15%, coverage ratio 760.5%. Mercuries Life net income TWD 5.7bn and FYP TWD 43.1bn (+66%). E.SUN Securities net profit TWD 4bn (+128%). Awards and ESG recognition.
Five teal rounded label boxes on the left (FHC, Bank, Mercuries Life, Other Subsidiaries, Glory and Honor) each paired with bullet text on the right, separated by thin rules.
Four bar charts for 2022, 2023, 2024, 2025 and 9M26: net profit (TWD million) 15,759, 21,760, 26,128, 34,342 and 32,569; EPS 1.1, 1.41, 1.63, 2.12 and 1.99; ROE 8.06%, 10.03%, 10.68%, 13.05% and 13.97%; ROA 0.47%, 0.61%, 0.68%, 0.80% and 0.78%. 9M26 figures are preliminary.
2x2 grid of bar charts under teal headers, with the 9M26 bar highlighted in red among blue bars.
Pie chart of 9M26 contribution: Bank 81.5%, Securities 11.8%, VC 3.0%, Life 2.4%, AM 1.3%. Bar chart (TWD million) 9M25 vs 9M26: Bank 25,229 to 27,993, Securities 1,773 to 4,043, VC 193 to 1,029, AM 47 to 433, Life 825 in 9M26, FHC 26,203 to 32,569.
Pie chart on the left and clustered bar chart on the right with footnotes about the Asset Management (July 1, 2025) and Mercuries Life (Sep 1, 2026) consolidation dates.
Waterfall-style P&L (TWD million). 9M26: net revenue 81,834, operating expense (37,368), net provision (4,798), income tax (7,046), net profit 32,569. 9M25: 67,746, (32,282), (4,233), (5,008), 26,203. Growth ovals show +20.8% revenue, +15.8% expense and +24.3% net profit.
Two stacked waterfall charts (9M26 above, 9M25 below) linked by dashed lines to oval growth callouts.
Donut chart of TWD 30.6bn net fee income: Wealth Management 47.4%, Credit Card 22.9%, Brokerage and others 20.4%, Corporate Banking 7.8%, Consumer Banking 1.6%. Bar chart (TWD million) 9M25 to 9M26: Credit Card 6,372 to 7,002 (+9.9% YoY), Wealth Management 10,872 to 14,510 (+33.5% YoY), Consumer Banking 290 to 476, Corporate Banking 1,995 to 2,403, Brokerage and others 3,100 to 6,232.
Donut with center total on the left, clustered bars with YoY oval callouts on the right.
FHC CAR ratio: 128.20% (6M24), 132.66% (2024), 132.90% (6M25), 128.02% (2025), 118.58% (6M26, audited). Bank BIS ratio 6M26 14.33% (Tier 1 12.09%, Tier 2 2.24%), versus 15.42% for 2025. Bank CET1 ratio 10.97% at 6M26. Life RBC 111.09% (2023), 136.30% (2024), 166.82% (2025); TIS 110.00% at 6M26.
2x2 grid of charts: single bars, stacked Tier 1/Tier 2 bars, RBC/TIS bars in dashed boxes, and CET1 bars.
Section divider titled 'E.SUN Bank' featuring the oil painting 'The Oversight of Mt. Jade' by Huei-Dung Chen (91x72.5cm, 2022).
Section title at left, framed landscape painting with caption at right over translucent triangles.
Net revenue of TWD 72.4bn: Net Interest Income 51.8%, Net Fee Income 32.2%, Fixed Income, FX and Others 16.0%. YoY comparison (TWD million): net interest income 29,426 to 37,517 (+27.5%), net fee income 19,476 to 23,319 (+19.7%), fixed income, FX and others 15,146 to 11,548.
Donut with center total at left and clustered bar chart with YoY ovals at right.
Table (TWD billion) at 2026.09: total deposit 4,171.9 (+10.41% YTD, +17.10% YoY) and total loan 2,982.2 (+13.38% YTD, +16.99% YoY). FCY loans 652.6 (+38.35% YoY), corporate loans 1,496.4 (+19.29%), SME loans 754.3 (+15.94%), consumer loans 1,408.3 (+13.88%), mortgage 610.1, unsecured personal loans 186.3, credit card revolving balance 15.9 (-14.05%).
Dark teal header row with columns for 2026.09, YTD growth, 2025.12, YoY growth and 2025.09; indented sub-rows for categories.
Donut of TWD 2.98tn total loans: SME 25.3%, Large Corporate 24.9%, Mortgage 20.5%, Secured Personal Loan 20.5%, Unsecured Personal Loan 6.2%, Subsidiaries 2.6%. Bar chart (TWD billion) 9M25 to 9M26: Large Corporate 603.7 to 742.1, SME 650.6 to 754.3, Mortgage 570.2 to 610.1, Subsidiaries 59.3 to 78.5, Secured PL 521.2 to 611.9, Unsecured PL 145.2 to 186.3.
Donut at left, clustered bars at right; note that secured personal loans are fully collateralized by fixed assets.
SME loan balance (TWD billion) 506.0, 558.5, 604.4, 675.5 and 754.3 for 2022 to 9M26, equal to 25.3% of total loans in 9M26. FCY loan balance 376.3, 366.1, 434.4, 517.3 and 652.6, equal to 21.9% of total loans in 9M26.
Two bar-and-line combo charts side by side; bars show balances, red line shows share of total loans.
Overseas branches and subsidiaries contributed 25.7% of the Bank's net profit and overseas loan balance grew 29.8% YTD. The Bank has 35 overseas locations across 11 countries and regions, opened the Osaka Sub-Branch on Sep. 4, expects the Mumbai Branch in Q1 2027, and is preparing a Toronto Branch and a Dallas branch upgrade.
Left half is an Asia-Pacific map with pins and labelled locations; right half has two bordered headings (Financial Performance, Overseas Expansion) with bullets.
Loan to deposit ratio at 9M26: LDR 71.5%, FX LDR 44.5%, TWD LDR 86.1%. Deposit chart (TWD billion) 9M25 to 9M26: TWD demand deposits 1303.7 to 1471.6 (+12.9% YoY), TWD time deposits 1046.9 to 1234.6, FCY deposits 1212.1 to 1465.7 (+20.9% YoY).
Three-line chart (2023 to 9M26) on the left and clustered bars with YoY ovals on the right.
Net interest margin by quarter from 2Q25 to 3Q26: 1.29%, 1.31%, 1.32%, 1.32%, 1.31% and 1.28%. 3Q26 overall lending rate 3.06%, overall deposit rate 1.64% and interest spread 1.41%.
Left bar chart of NIM and right three-line chart for lending rate, deposit rate and interest spreads across six quarters.
Donut of TWD 14.5bn wealth management fees: Mutual Fund 35.3%, Bancassurance 33.4%, Bond and Others 26.6%, Custodian and Trust 4.7%. YoY (TWD million): mutual fund 3,662 to 5,126 (+40%), bancassurance 4,609 to 4,848, bond and others 2,011 to 3,862 (+92%), custodian and trust 591 to 675.
Donut at left with center total; clustered bars with two YoY callouts at right.
Four charts for 2022 to 9M26. Active cards (thousand) 4,692, 4,804, 4,965, 5,341 and 4,920, with 12.2% market share in 9M26. Card consumption 9M26 TWD 582,745 million (13.8% share). Monthly per-card spending TWD 13,160 in 9M26 versus 10,389 in 2025. Gross fee income 9M26 TWD 9,714 million.
2x2 grid: two bar-and-line combos on top and two bar charts below, with the 9M26 bar in red.
NPL (TWD million) 3,410, 3,167, 3,388, 3,792 and 4,443 for 6M24 to 9M26, with NPL ratio 0.16%, 0.14%, 0.14%, 0.15% and 0.15% and coverage ratio 775.7%, 868.9%, 835.1%, 826.4% and 760.5%. Provision 1,565, 3,976, 1,935, 6,231 and 4,961 with annualized credit cost 0.13%, 0.17%, 0.16%, 0.23% and 0.23%.
Two combo charts, left NPL bars with ratio and coverage lines, right provision bars with credit cost line.
NPL ratio for main business: Corporate 0.17%, 0.09%, 0.08%, 0.09% and 0.15%, and Mortgage and SPL 0.06%, 0.06%, 0.08%, 0.08% and 0.11% from 6M24 to 9M26. NPL comparison with market: E.SUN and market both 0.15% at 9M26 (source: Financial Statistics Abstract, FSC).
Two line charts side by side; the right chart overlays E.SUN and Market series.
Cost-income ratio falls from 57.1% (2023) to 52.1% (2024), 47.7% (2025) and 46.5% (9M26). Net revenue (TWD million) 62,475, 71,961, 86,396 and 72,384; operating expense excluding provision 35,662, 37,478, 41,245 and 33,626.
Full-width combo chart: paired blue and green bars per period with a red descending ratio line above.
Section divider titled 'Mercuries Life' featuring the acrylic painting 'Yushan Wild' by Birungi Arnold (91x72.5cm, 2022, Uganda).
Section title at left and framed wildlife landscape painting with caption at right.
Mercuries Life individual preliminary figures at Sep 30, 2026 (TWD billion): FYP 43.1 (+66% YoY), new business CSM 11.4 (+2% YoY); insurance service result 1.7, financial result 9.5, net investment income 28.5, net income 5.7, total comprehensive income 61.1; net worth 141.8, CSM balance 80.0, adjusted net worth 205.7, E/A ratio 10.5% (adjusted 15.3%).
Three-row KPI grid (Business Performance, Financial Performance, Net Worth) with teal labels and large black numbers.
Total premium (TWD billion) 110.0, 110.2, 81.7 and 97.0 for 2024, 2025, 9M25 and 9M26 (+19% YoY). FYP 32.2, 35.7, 25.9 and 43.1 (+66% YoY), with FYPE 8.0, 8.4, 6.1 and 8.2 (+34% YoY). 9M26 FYP sales channel split: tied-agents 97.3% and bancassurance 2.7%.
2x2 grid of stacked bar charts and two pies for sales channel, with YoY callout ovals.
CSM balance was 80.0 billion at the end of September 2026, up 19.0 billion from the start of the year. Waterfall: opening CSM 61.0, new business CSM 11.4, expected return on in-force 0.8, variance and others 9.9, CSM before release 83.2, CSM release -3.2, closing 80.0, with an annualized release rate of approximately 5.1%.
Two bullets above a teal header and a full-width waterfall chart with blue totals and red/green steps.
Investment yield for 9M2026 was 2.98%, with recurring return 3.48%, on total investments of TWD 1,299.9 billion. Domestic equity weight is 8.0% (return 12.54%) and overseas fixed income 63.8% (return 3.76%); domestic equity allocation rose 4.2% versus the same period last year.
Two bullets above a dense table with weights for 2022 to 9M25 and weight plus return for 9M26, and five footnotes.
Hedging cost is 543bps for 2025 (121 CS+NDF cost and 422 FX gain/loss and reserve provision) and 146bps for 9M26 (81 and 65). Balance of FX reserve TWD 36.96bn (2025) and 39.73bn (9M26). FX assets are NT$872.3bn: Open 55.41%, Currency SWAP and NDF 41.14%, FVOCI 3.45%; FX Policy 18.0% and FX risk exposure 82.0%.
Intro bullet above three panels: stacked hedging cost bars, FX reserve bars and a pie with side stacked bar.
In 9M2026 the policy cost rate dropped to 2.26% following the adoption of IFRS 17, while investment return stood at 2.98%. Cost of liability 3.43%, 3.41%, 3.41%, 3.39% and 3.42% for 2021 to 2025; investment return 3.09%, 2.15%, 2.40%, 3.37% and 0.12%.
Headline sentence above a full-width clustered bar chart of cost of liability versus investment return for six periods.
Net worth increased by 77.2 billion in nine months of 2026 to 141.8 billion, with adjusted net worth of 205.7 billion. Waterfall (TWD billion): opening 64.6, net income 5.7, change in FVOCI assets -5.5, liability valuation impact 64.3, others 12.7, net worth 141.8, CSM after tax 64, adjusted 205.7; E/A ratios 4.80%, 10.51% and 15.25%.
Bullet and teal header over a waterfall with E/A ratio rounded boxes beneath three bars.
Section divider titled 'E.SUN FHC's Other Subsidiaries' featuring the oil painting 'The Splendid Mt. Jade' by Shou-Ying Wang (80x65cm, 2022).
Two-line section title at left, framed painting with caption at right.
9M26 annualized ROE reached 41% and sub-brokerage fee income rose 112% YoY. Brokerage market share 1.78% (2025) and 1.81% (3Q26); margin loan share 2.84% and 2.68%. Net revenue (TWD million) 5,088, 5,674 and 8,099; net profit 2,177, 2,610 and 4,043 for 2024, 2025 and 9M26.
Business Highlights bullet block above three panels: market share table and two bar charts.
As of Sep. 2026 domestic fund AUM reached TWD 139bn and discretionary fund AUM TWD 166bn, up 53% YTD combined. 9M26 net profit TWD 451mn with EPS TWD 15 (+246% YoY); fifth ETF (00413A) established Nov. 3 and fund lineup expanded to seven funds.
Highlights banner with nested bullets, then an AUM clustered bar chart and a net profit bar chart (90, 158, 189, 451 in TWD million).
Nine recognitions in a 3x3 grid, including MSCI ESG Rating AAA (highest rating), Member of DJBIC since 2014 (S&P Global), Jade Award (The Asset ESG), FSC sustainable finance assessment top 25%, CG Assessment top 5% for the 11th time (TAIEX), CG6014 (CGA), CommonWealth Excellence in CSR Awards, Corporate Sustainability Awards for 12 years in a row and Taiwan Biodiversity Awards Golden Award (TCSA).
Nine centered award blocks, each with a teal qualifier, red award name, grey issuer and gold star row, on a golden bokeh background.
Closing slide reading 'Thank you' with a QR code and the text 'Contact Investor Relations' (聯絡投資人關係部門); the QR code destination is not readable from the image.
Full-bleed aerial photo of a rice field with a mountain shape, centered white title and QR code at lower right.
Balance sheet as of Sep. 30, 2026 (TWD million) across E.SUN Bank (consolidated), Mercuries Life, Securities, Venture Capital, Site and the FHC standalone and consolidated. FHC consolidated total assets 6,650,471, loans net 2,975,786, deposits 4,139,235, total liabilities 6,301,023 and total stockholders' equity 349,448 (Bank total assets 5,036,165; Mercuries Life 1,565,078).
Wide financial table with a teal header and entity columns; asset, liability and equity sections with underlined totals.
9M 2026 income statement (TWD million) by entity. FHC consolidated total net revenues 81,834, operating expenses (37,367), income before tax 39,669, tax (7,046), net income 32,623 and 32,569 attributable to owners; Bank net income 28,009, Mercuries Life 825, Securities 4,043, Venture Capital 1,029, Site 433.
Entity-column table from operating income lines to non-controlling interests with ruled subtotal rows.
Consolidated FHC balance sheet (TWD million) for Dec 23, Dec 24, Dec 25 and quarter ends Jun 25 to Sep 26. Total assets 3,638,498, 4,068,238 and 4,516,533 for the yearly columns and 6,650,471 at Sep 26; total stockholders' equity 349,448 at Sep 26.
Table with Yearly Results and Quarterly Results column groups under a teal header.
Consolidated FHC income statement (TWD million). Net income 21,748 (2023), 26,149 (2024) and 34,374 (2025), and quarterly 7,966, 9,447, 8,151, 10,068, 11,397 and 11,158 for 2Q25 to 3Q26. 3Q26 net revenues 27,991, with insurance business income of (3,075) in the quarter.
Table with yearly and quarterly column groups, operating income lines at top and net income lines at bottom.
E.SUN Bank consolidated balance sheet (TWD million): total assets 3,608,639, 4,028,935 and 4,466,652 for 2023 to 2025 and 5,036,165 at Sep 26; deposits 4,171,884 and total stockholders' equity 307,577 at Sep 26.
Yearly plus quarterly table with assets, liabilities and equity sections.
E.SUN Bank consolidated income statement (TWD million): total net revenues 62,475, 71,961 and 86,376 for 2023 to 2025; 3Q26 net revenues 24,954 (net interest income 13,192, fee income 8,274) and 3Q26 net income 9,202 versus 32,810 for 2025.
Yearly and quarterly column groups with ruled subtotals from operating income to non-controlling interests.
Mercuries Life summary (NTD million), IFRS 4 for 2023 to 2025 and IFRS 17 for 2026 Q1, H1 and Q1~Q3. 2026 Q1~Q3 net income 5,710, total comprehensive income 61,124, total assets 1,640,263, shareholders' equity 141,763 and E/A ratio 10.51%; 2025 net income was 1,178.
Two side-by-side monospaced tables (income statement and balance sheet) for IFRS 4 and IFRS 17 periods with red negatives; the rendering is slightly pixelated but legible.
Closing notice in Chinese (智慧財產權聲明) and English stating the rights in the material belong to E.SUN Financial Holding Co., Ltd. and its subsidiaries and that copying or reuse without prior written permission is prohibited.
Pale mountain brush logo centered high, with bilingual legal text at the bottom and teal footer band.
このスライドと基礎となるプレゼンテーションコンテンツに関する一般的な質問。
It is E.SUN Financial Holding Co.'s 45-page deck titled 'Financial Review of 3Q 2026', dated Nov 2026. It covers E.SUN FHC, E.SUN Bank, Mercuries Life and other subsidiaries, followed by financial statement appendices.
This is the English version of the deck filed on Taiwan's Market Observation Post System (MOPS) for the investor conference (法說會). A Chinese version also exists. The deck itself carries E.SUN's disclaimer and intellectual property notice.
Page 6 prints 9M26 net revenue of TWD 81.8bn (+20.8%) and net profit of TWD 32.6bn (+24.3%), both described as record highs, with EPS of TWD 1.99, ROE of 13.97% and ROA of 0.78%. 9M26 figures are marked preliminary.
The deck shows E.SUN Bank 9M26 net profit of TWD 28.0bn (+10.9%), total loans of TWD 2.98tn, deposits up 17.1% YoY, an NPL ratio of 0.15% and a coverage ratio of 760.5%. The NIM for 3Q26 is printed at 1.28% on the NIM and Spread slide.
E.SUN FHC completed the acquisition of Mercuries Life on Sep. 1, expanding total assets beyond TWD 6.6tn. The Mercuries Life section reports FYP of TWD 43.1bn, new business CSM of TWD 11.4bn, a CSM balance of TWD 80.0bn and net worth of TWD 141.8bn.
Yes. Seven appendix pages give the entity-level balance sheet and income statement, FHC consolidated statements by year and quarter, E.SUN Bank consolidated statements and a Mercuries Life summary. Figures are marked preliminary where applicable.
The layout is a useful structural reference: summary page, section dividers, KPI charts, waterfall and donut charts, and a statement appendix. E.SUN's content, logo and artwork remain subject to its intellectual property notice, so reuse the structure and design ideas rather than its materials.
Investors and bank or insurance analysts can use it to review E.SUN's 9M26 results, capital ratios and asset quality. Finance and investor relations teams and designers can study how a financial holding company presents multi-segment quarterly results.

Create Your Own Slides
Turn your ideas into professional presentations in seconds with 2slides AI.
プロフェッショナルなデザインを参照し、スタイルを選択し、完璧なテキストレンダリングでスライドを生成。Nano Banana搭載—今すぐプレゼンテーションの作成を始めましょう。
© 2026 2slides。全著作権所有。


