
収録コレクション: 投資家向けプレゼン資料の実例 · 決算説明資料の実例集
This is the Japanese-language earnings presentation (決算説明資料) that East Japan Railway Company (JR East, TSE 9020) published on TDnet, the Tokyo Stock Exchange's Timely Disclosure network, on October 30, 2026. It covers the first half (April to September 2026) of the fiscal year ending March 2027, which the company calls fiscal 2026 (2026年度), and is titled 2027年3月期 第2四半期決算説明資料. H1 revenue reached ¥1,585.3 billion (+8.4%) and operating profit ¥262.9 billion (+13.6%), and the full-year forecast was raised to revenue ¥3,358.0 billion and operating profit ¥450.0 billion, with the dividend lifted to ¥88 per share. The 72 pages also lay out progress on the Yūshō 2034 (勇翔2034) mid to long-term strategy, Takanawa Gateway City, fare revision effects, cost of capital and capital policy.
このスライドの表紙をスタイルの参考にして、ご自身の内容からスライドを作成します。 下のページから好きな1枚を選び、そのレイアウトを参考にすることもできます。
クイックナビゲーション
タグ
スライドを共有
This is the Japanese-language earnings presentation (決算説明資料) that East Japan Railway Company (JR East, TSE 9020) published on TDnet, the Tokyo Stock Exchange's Timely Disclosure network, on October 30, 2026. It covers the first half (April to September 2026) of the fiscal year ending March 2027, which the company calls fiscal 2026 (2026年度), and is titled 2027年3月期 第2四半期決算説明資料. H1 revenue reached ¥1,585.3 billion (+8.4%) and operating profit ¥262.9 billion (+13.6%), and the full-year forecast was raised to revenue ¥3,358.0 billion and operating profit ¥450.0 billion, with the dividend lifted to ¥88 per share. The 72 pages also lay out progress on the Yūshō 2034 (勇翔2034) mid to long-term strategy, Takanawa Gateway City, fare revision effects, cost of capital and capital policy.
レイアウト、主要コンテンツ、視覚要素を含む各スライドページの詳細ビュー。
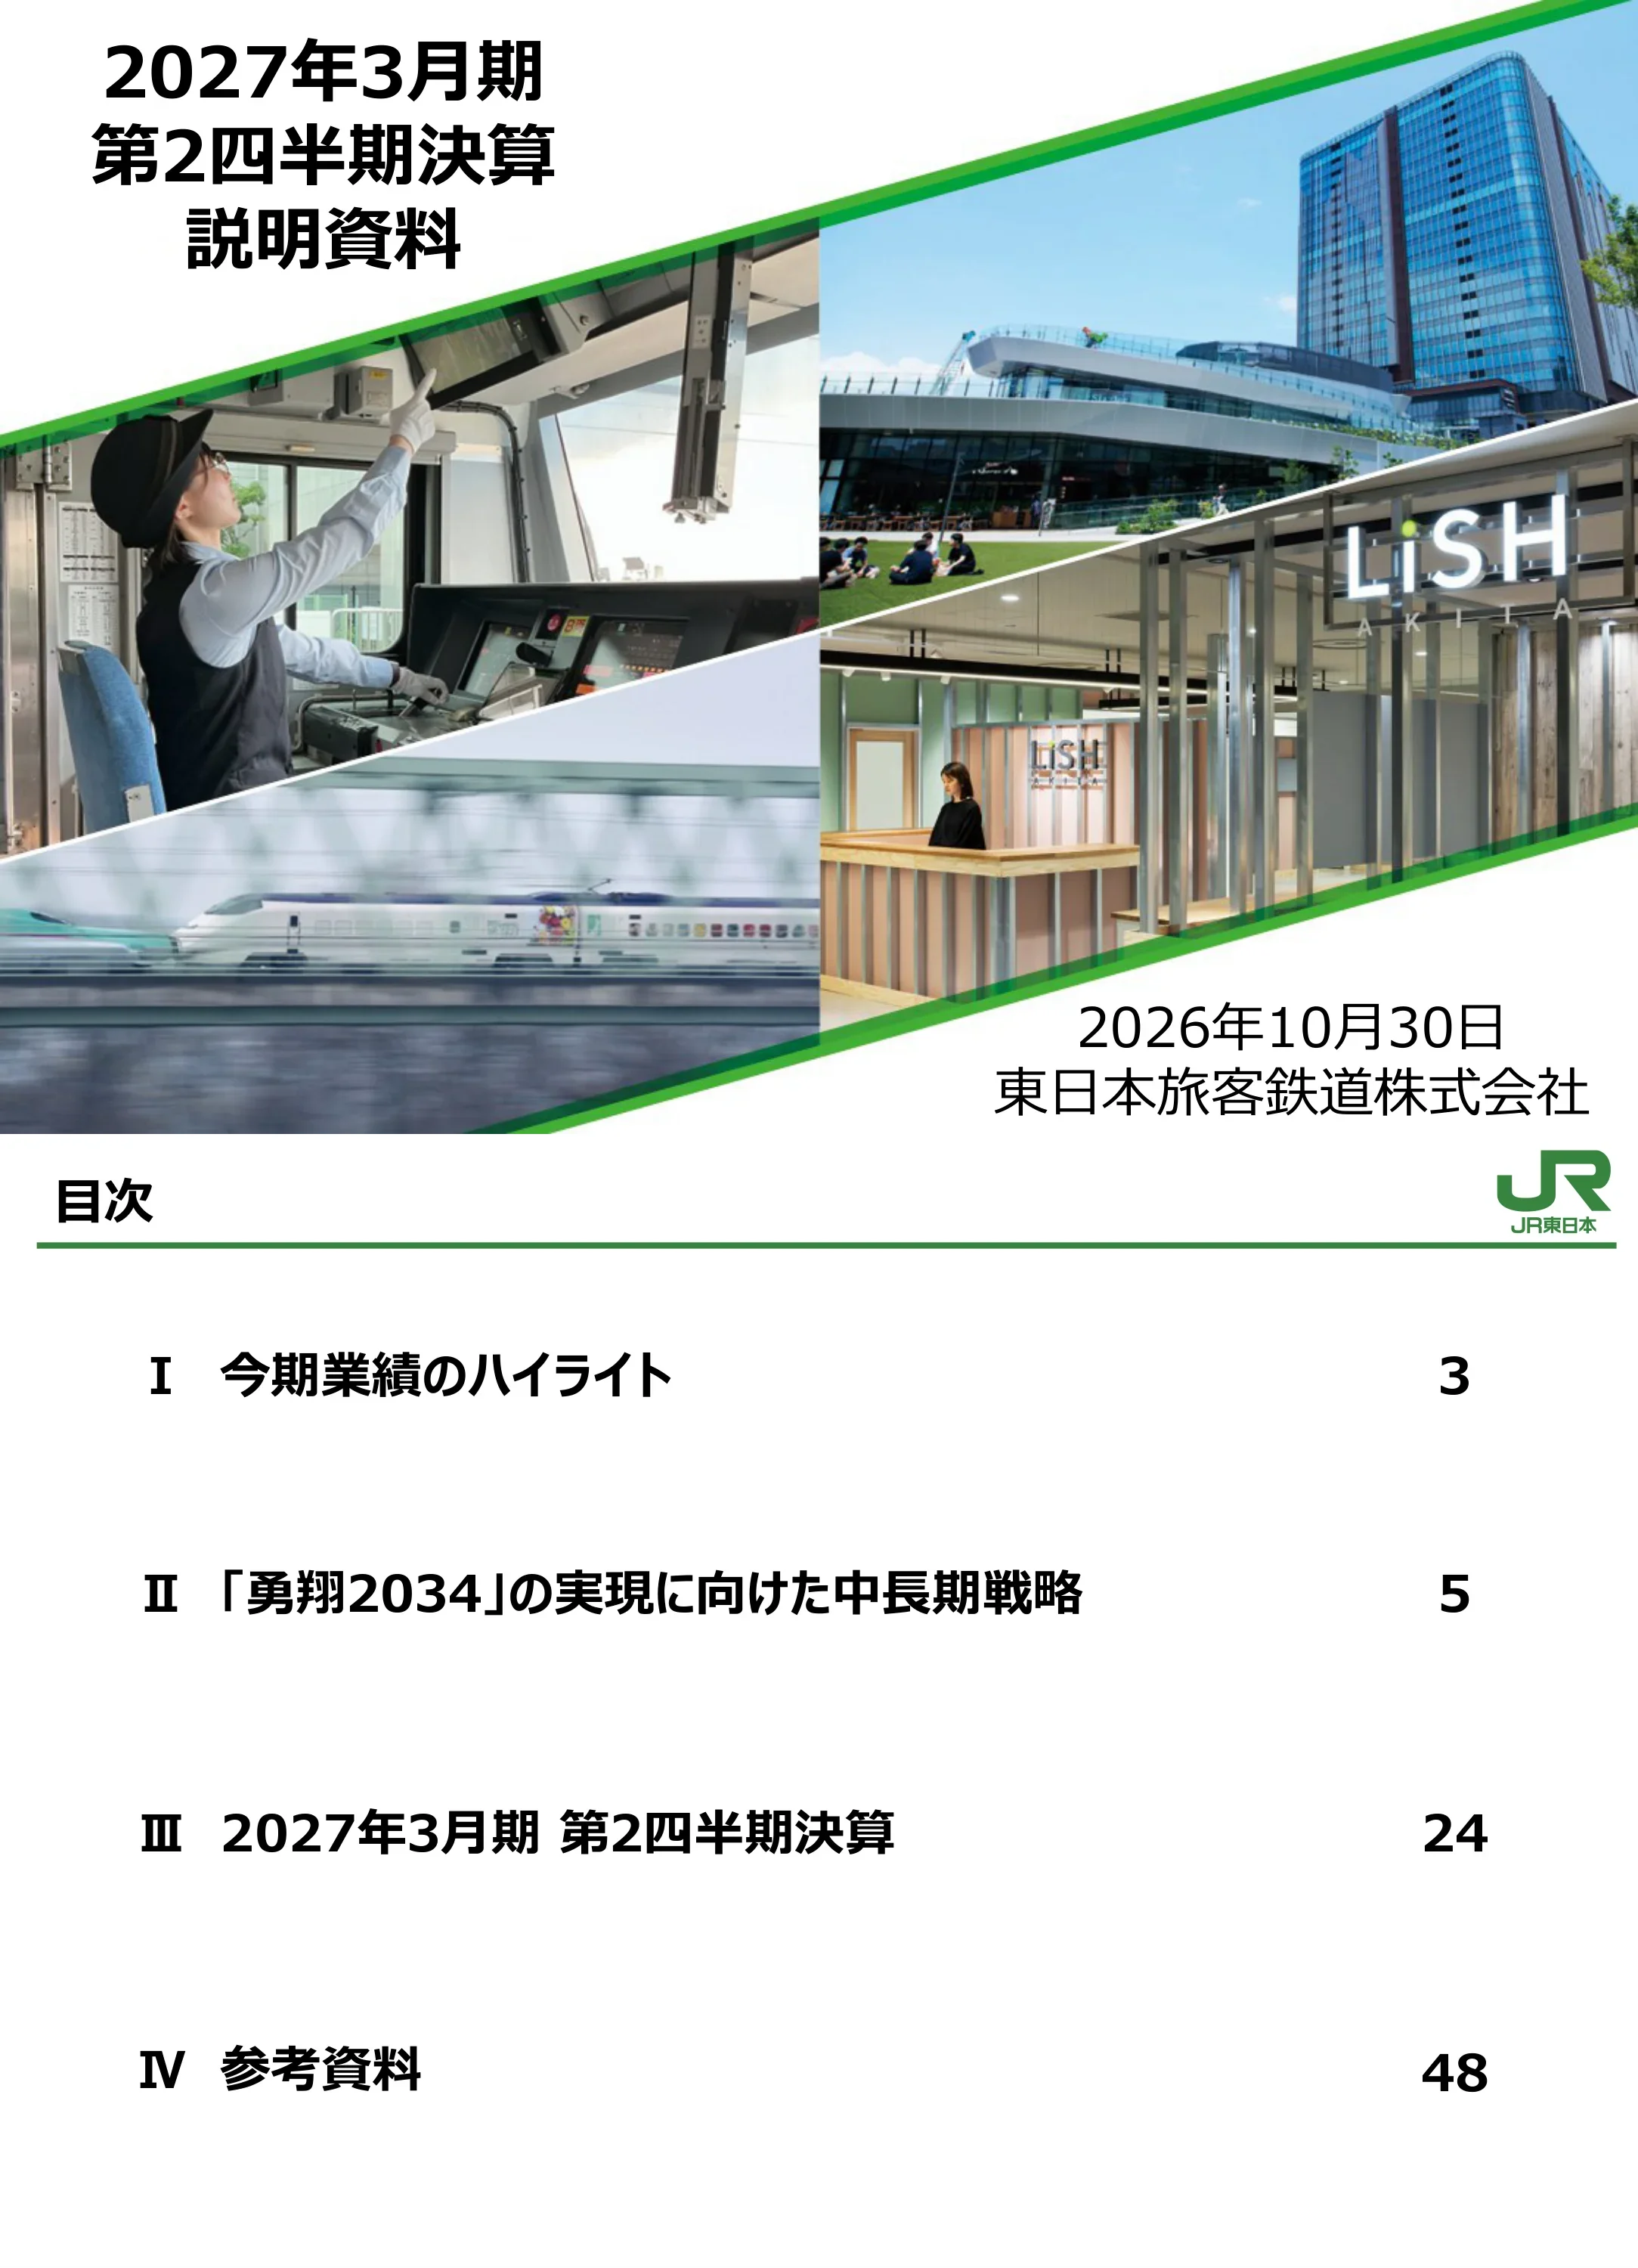
Title slide for 2027年3月期 第2四半期決算説明資料 (Second Quarter Results Presentation for the fiscal year ending March 2027), dated October 30, 2026, issued by East Japan Railway Company (JR East). A diagonal photo collage shows a train driver in the cab, a glass office tower with a landscaped deck, the LiSH Akita facility interior, and a Shinkansen.
Full-page photo collage cover with the Japanese presentation title, date and company name, in the JR East house style.
Four parts: I Highlights (p3), II Mid and long-term strategy toward Yūshō 2034 (p5), III Results for the second quarter of the fiscal year ending March 2027 (p24), and IV Reference materials (p48).
Text list of four numbered sections with page numbers, green header line and JR East logo top-right.
Section divider introducing Part I, Highlights of this period.
White page with a single centered section title.
Operating profit ran above plan through Q2 on strong rail usage, so the full-year forecast was raised: revenue ¥3,358.0 billion (+¥63.0 billion), operating profit ¥450.0 billion (+¥21.0 billion), ordinary profit ¥378.0 billion (+¥25.0 billion), net profit ¥265.0 billion (+¥10.0 billion), EBITDA ¥908.0 billion (+¥21.0 billion). The dividend rises from ¥84 (payout 37.2%) to ¥88 (interim ¥44), payout 37.5%. Net debt/EBITDA is 5.8x, ROE 8.5% and ROA 4.1%.
Beige summary box at the top with red emphasis text, followed by a table of revised forecast items against the prior forecast.
Divider for Part II, with an illustration collage of Lifestyle Transformation (LX) and a concept diagram of Yūshō 2034 showing mobility plus life solutions and five growth engines.
Faded illustration collage in the background with a centered section title and a concept diagram.
After transport disruptions, six measures: workflow review (grounding-device procedure from April, manual in August), abnormal-situation response (evacuation preparation within 30 minutes, about ¥0.5 billion of spare parts by fiscal year-end), remote level-crossing monitoring at 419 crossings in FY2026 (519 in total), about 150 extra engineering hires in FY2027, repair costs up about ¥30 billion year on year, and daytime maintenance on the Keihin-Tohoku and Yokosuka lines.
Numbered text blocks with a beige summary box and photos of rail replacement, signal relay, a drone and an AI-generated diagram.
Describes the JR East Group Resolve and Promise (決意と約束), psychological safety and harassment prevention, governance regulations covering internal control, group management and compliance, compliance officers, more statutory auditors at group companies, and a communication liaison.
Text bullets with a highlighted summary box at the top and a simple governance framework diagram.
Group basic policy plus technical measures (SOC, integrated endpoint security product, attack surface management since FY2025, vulnerability scans) and managerial measures (10 rules, phishing drills, training). The CISO is the head of innovation strategy, and CSIRT drills are run.
Two-column text layout separating technical and managerial measures under a beige summary box.
JR East aims for returns above a rising cost of capital. Investment hurdles are revised: Mobility NPV discount rate from 3.0% to 3.6%, Life-style Solutions IRR hurdle from 4.4% to 5.0%. All debt is fixed-rate and long-dated. Mobility pricing steps include notification-based Shinkansen non-reserved fees; Life Solutions steps include ekinaka stores, rent reviews and condo sales with JR East Itochu real estate development.
Split layout with Mobility and Life Solutions columns under a beige summary box with red emphasis text.
JR East carried out its first-ever company fare revision on March 14, 2026. Examples of investment include platform doors, slope reinforcement, catenary renewal, all-direction warning lights, the Haneda Airport Access Line (tentative name), elevators, the lost-and-found cloud service, walk-through ticket gates, Yamanote drone inspection and Suica Renaissance.
Grid of measure categories with small photos under a beige summary box.
Heavy rain and Typhoon No. 25 in August 2026 caused extensive damage in Chiba. Most suspended lines are restored; the Uchibō Line (Anegasaki to Chōnan) resumes on November 9, 2026, while rail restoration of the Kururi Line (Kururi to Kazusa-Kameyama) is abandoned, with bus substitution until March 31, 2027. Countermeasures include water-resistant point machines, flood barriers and raising electrical equipment.
Text with map-style line status, damage photos and a summary box at the top.
Comprehensive partnership with Nasushiobara City (Tochigi) to grow the related population; a wide-area inbound tourism model with the four JR companies and JAL themed on pilgrimage and spiritual culture (Dewa Sanzan, Kumano Kodō, Shikoku); the Haneda Access Line and through-services; and a new overnight-capable limited express, Luna Azur, starting in FY2027.
Three-part layout of initiatives with an AI-generated illustration diagram and a beige summary box.
Four requests: move the Shinkansen non-reserved express fee from approval to notification; create a mechanism for inflation and wages; revise the revenue-cost calculation, since the rate-of-return method fixes capital at 30% equity and 70% debt and cannot reflect rate rises; and review the total-cost (総括原価) method.
Numbered requests on the left with a table of the current regulation of fares (cap plus notification) and charges (notification) on the right.
Lease fee table: Hokuriku Takasaki to Nagano ¥17.5 billion a year plus ¥2.1 billion taxes and admin, ending September 2027; Nagano to Jōetsumyōkō ¥16.5 billion, ending March 2045; Tohoku Morioka to Hachinohe ¥7.93 billion, ending November 2032; Hachinohe to Shin-Aomori ¥9.2 billion (including ¥2.2 billion for Hokkaido Shinkansen), ending December 2040. JR East wants new-line funding separated from fee calculation and fees capped based on maintenance costs under the 1991 agreement.
Lease fee table by line section with a text box stating JR East's position.
Target for the Mobility operating margin is 11.5% in the fiscal year ending March 2032. Driver-only operation covers 4 lines by FY3/2026, extends to Keihin-Tohoku/Negishi and Chūō-Sōbu local lines in spring 2027, and to main Tokyo lines by about 2030. Driverless Shinkansen deadhead runs target FY3/2030, with Yamanote driverless operation around 2035.
Roadmap-style layout with a timeline of one-man and driverless operation milestones and a beige summary box.
Yamanote drone inspection, a multi-function rail heavy machine (humanoid robot), Shinkansen tunnel inspection DX with crack extraction, autonomous track robots, a new AI Shinkansen inspection car, a Midori-no-Madoguchi AI service (tentative), QR short-distance tickets, ticketless travel and a daytime work shift.
Photo-led grid of technologies with short captions below a beige summary box.
Mode conversion agreed for the Kururi Line to road transport from April 2027 (¥2.0 billion for 18 years plus a hub) and for the Tsugaru Line (¥3.36 billion for 18 years, NPO set up with municipalities). The Yonesaka and Agatsuma lines are under discussion. For lines under 2,000 average passengers a day, FY3/2025 shows 36 lines/71 sections, revenue ¥6.2 billion, expenses ¥85.3 billion and loss ¥79.0 billion (FY3/2024: loss ¥75.7 billion).
Left text on agreed and pending conversions, right reference table of low-density lines for two fiscal years.
Greater Shinagawa (Hamamatsuchō to Ōimachi) targets over ¥100 billion a year of revenue by the mid-2030s. Takanawa Gateway City: about ¥65 billion a year from FY3/2031, cost about ¥610 billion, grand opening March 28, 2026, offices fully leased, rental residences about 80% applied, rail revenue up about ¥0.2 billion a month. Ōimachi Tracks: about ¥15 billion a year from FY3/2032, cost about ¥120 billion, rail revenue up about ¥0.1 billion a month.
Two project panels with photos and key figures beneath a beige summary box with red emphasis text.
A map of Tokyo-area projects classed as mobility-network, terminal, asset-reorganization and other types, including Omiya, Shinjuku, Shibuya, Tokyo, Takanawa Gateway, Haneda Access Line, Yokohama, Funabashi and Chiba. The JR Funabashi Ichibachō site plans over 1,000 units, completion December 2028, group sales revenue about ¥42 billion, with Tokyu Fudosan HD.
Tokyo-area rail map with color-coded project markers and a text panel on the Funabashi and Nakano projects.
With JR East Itochu Real Estate Development, the real estate sales operating profit target is raised to a cumulative ¥650 billion for FY3/2026 to FY3/2032. FY3/2026 actual revenue ¥73.0 billion and operating profit ¥50.3 billion; FY3/2027 plan revenue ¥100.0 billion and operating profit ¥45.0 billion. Fund AUM KPI is ¥700 billion in FY3/2028 and ¥1.4 trillion in FY3/2032 (from ¥585.4 billion). Rental property book value is ¥1,445.4 billion with unrealized gains of ¥2,085.3 billion.
Cycle diagram of the rotation model beside tables of sales results and fund AUM targets.
Hakobyun train cargo and Multi e-Cube lockers deliver same-day luggage to hotels (Tokyo to Sendai) and are expanding; JRE Tebura-tabi offers hands-free travel. JR East Smart Logistics targets revenue of ¥10 billion in FY3/2032, with a FY3/2027 outlook of ¥6.6 billion.
Two service panels with photos and a small revenue target chart beneath a summary box.
Targets for FY3/2032 are revenue up ¥100 billion and operating profit up ¥25 billion or more versus FY3/2025. Group revenue is about ¥3 trillion in FY3/2026, rising to about ¥4.3 trillion in FY3/2032 (+about ¥1.3 trillion). The ecosystem includes Lumine, atré, ecute, NewDays, Hotel Metropolitan, teppay, JRE GO, regional Suica and walk-through gates.
Ecosystem diagram with JRE ID at the center and service logos around it, plus a revenue target callout.
36 business headquarters launched in July 2026, replacing 2 headquarters and 10 branch offices, along with an HR and wage reform from April 2026 and health investment. The engagement survey positive rate is 66.2% for FY3/2027 (+3.7 points), above the 65.0% KPI. JRE MALL front-line items number about 700, with sales of about ¥270 million in FY3/2026.
Text bullets with local customer-experience case photos and a highlighted survey result.
Section divider introducing Part III, the second quarter results for the fiscal year ending March 2027.
White page with a single centered section title.
H1 revenue ¥1,585.3 billion (+¥122.2 billion, +8.4%), operating profit ¥262.9 billion (+¥31.4 billion, +13.6%), ordinary profit ¥230.1 billion (+15.7%), net profit ¥151.9 billion (+3.2%), EBITDA ¥481.9 billion (+10.3%). Full-year forecast: revenue ¥3,358.0 billion, operating profit ¥450.0 billion, ordinary ¥378.0 billion, net ¥265.0 billion, EBITDA ¥908.0 billion, versus FY3/2026 actual operating profit of ¥414.2 billion. Revenue rose for six consecutive periods, a Q2 record. Interim dividend ¥44 (prior forecast ¥42).
Large results table comparing H1 actual, prior year, and FY3/2026 actual with April and October forecasts, under a beige summary box with red text.
Operating profit rose from ¥231.4 billion to ¥262.9 billion. Drivers: JR transport revenue about +¥84.0 billion, retail, services and real estate revenue excluding sales about +¥30.5 billion, other revenue about +¥12.0 billion, property sales revenue about -¥4.5 billion, personnel costs about -¥36.0 billion, JR repair costs about -¥13.0 billion, other costs about -¥34.0 billion. Revenue was up ¥122.2 billion and costs up ¥90.8 billion.
Waterfall chart with positive bars in one color and cost bars in another, beneath a beige summary box.
Segment revenue: Transportation ¥1,088.8 billion (+¥89.8 billion), Retail & Services ¥206.0 billion, Real Estate & Hotels ¥232.8 billion, Others ¥57.6 billion. Operating profit: Transportation ¥177.5 billion (+¥34.3 billion, 124.0%), Retail & Services ¥32.2 billion, Real Estate & Hotels ¥41.2 billion (-¥6.6 billion), Others ¥11.8 billion. Extraordinary items swung from +¥10.6 billion to -¥14.3 billion. Transportation EBITDA ¥325.3 billion.
Dense multi-column financial table by segment with prior-year comparisons and EBITDA rows.
H1 revenue ¥1,088.8 billion (+¥89.8 billion), operating profit ¥177.5 billion (+¥34.3 billion), EBITDA ¥325.3 billion. Full-year forecast revenue ¥2,210.0 billion (+8.0%), operating profit ¥228.0 billion (+17.3%), EBITDA ¥536.0 billion. Shinkansen and conventional lines rose on ridership and the fare revision; commuter pass revenue was 112% of the prior year in Q2.
Summary table on top and a year-on-year railway revenue percentage table by quarter below.
Shinkansen revenue ¥326.3 billion (+8.5%; ridership including inbound +¥21.0 billion, fare revision +¥5.0 billion). Conventional lines ¥673.6 billion (+9.5%), of which Kanto area ¥639.4 billion. Total railway revenue ¥999.9 billion (+¥84.1 billion, +9.2%) on 65,246 million passenger-km (102.1%). Commuter passes ¥244.3 billion (fare revision +¥13.5 billion), non-commuter ¥755.5 billion.
Detailed table of passenger-km and revenue by line group with factor breakdowns of fare, ridership and weather.
Railway operating revenue (own handling, estimate) was 110% of the prior year in Q2 and 109% year to date; commuter 114% and non-commuter 108%. Shinkansen section volume was 106% (Tohoku 105, Jōetsu 107, Hokuriku 108). Tokyo-area weekday commuter gate usage was 103% in Q2 and 102% year to date.
Table of YoY percentages by category with monthly breakdowns for July, August and September.
H1 revenue ¥206.0 billion (+¥8.7 billion), operating profit ¥32.2 billion (+¥0.6 billion), EBITDA ¥42.2 billion. Full-year forecast revenue ¥426.0 billion, operating profit ¥70.0 billion, EBITDA ¥92.0 billion. Ekinaka retail sales and advertising were up; retail revenue was 105% year on year in Q2 and transit advertising 105%.
Segment summary table with a YoY percentage table of retail, advertising and store sales below.
H1 revenue ¥232.8 billion (+¥17.2 billion) and operating profit ¥41.2 billion (-¥6.6 billion, 86.2%) as property sales were zero versus ¥4.5 billion a year earlier. EBITDA ¥84.9 billion. Full-year forecast revenue ¥605.0 billion (+17.9%, including ¥100.0 billion of sales), operating profit ¥131.0 billion, EBITDA ¥221.0 billion. Takanawa Gateway City and Ōimachi Tracks lifted leasing.
Segment summary table, YoY table for shopping centers, offices and hotels, and a hotel reference table.
Shopping center leasable area is 1,127 thousand square meters at September 2026 and hotel rooms number 10,550. Hotel occupancy in Q2 was 80.9% (+0.6 points) with ADR of ¥18,674. Group office leasable area is 904 thousand square meters, and JR East Building Tokyo properties had 1.5% vacancy versus 3.6% in March 2026, against a central-5-ward market average of 1.85%.
Donut charts of shopping center and hotel mix beside tables of store sales, hotel KPIs and office area.
H1 revenue ¥57.6 billion (+¥6.4 billion, 112.6%), operating profit ¥11.8 billion (+37.1%), EBITDA ¥29.2 billion. Full-year forecast revenue ¥117.0 billion, operating profit ¥25.0 billion, EBITDA ¥63.0 billion. IT and Suica business revenue rose from ¥31.9 billion to ¥40.3 billion; in-house payment transaction value was ¥1,268.5 billion in Q2 and ¥2,502.7 billion year to date.
Segment summary table with an IT/Suica comparison table and payment value figures.
Mobility inbound revenue was ¥47.5 billion in FY3/2026; the FY3/2027 full-year plan is about ¥61.0 billion, with H1 about ¥20.3 billion against a plan of ¥22.0 billion. Life-style Solutions was ¥51.9 billion in FY3/2026, with H1 about ¥29.8 billion versus a plan of ¥25.5 billion and a full-year plan of ¥55.0 billion. Rail passes are about 30% of the total.
Two quarterly tables for Mobility and Life-style Solutions with notes on counting methods.
Total assets are ¥10,814.2 billion (-¥6.4 billion versus March 2026), with current assets ¥1,437.8 billion and fixed assets ¥9,376.4 billion. Liabilities are ¥7,649.4 billion (-¥111.1 billion), and net assets ¥3,164.7 billion (+¥104.7 billion). Non-current liabilities rose ¥145.5 billion on bonds.
Two-sided balance sheet table with assets on the left and liabilities and net assets on the right.
H1 operating cash flow ¥283.0 billion (versus ¥291.2 billion), investing -¥490.5 billion (capex -¥504.8 billion), financing +¥214.6 billion (CP +¥45.0 billion, new borrowings and bonds ¥334.0 billion, repayments -¥134.4 billion, dividends -¥44.1 billion). Cash at the end of the period is ¥270.0 billion, and free cash flow is -¥207.5 billion.
Cash flow statement table with prior-year comparison and a breakdown of financing items.
Interest-bearing debt is ¥5,403.8 billion (+¥241.6 billion), with an average rate of 1.79% and net debt of ¥5,133.8 billion. H1 capex was ¥258.4 billion (Mobility ¥93.4 billion, Life Solutions ¥165.0 billion); the full-year plan is ¥850.0 billion. FY3/2026 ROA 3.9%, ROE 8.4%, net debt/EBITDA 5.8x. Cross-shareholdings are 64 issues at ¥274.1 billion (8.6% of net assets), with 2 issues sold for ¥12.2 billion in H1.
Debt composition table, capex table and ratio panel arranged in three blocks.
Total debt rose from ¥4,703.7 billion (1.31%) in FY3/2022 to ¥5,403.8 billion (1.79%) in September 2026; bonds grew from ¥2,542.6 billion to ¥3,532.4 billion, and the foreign-currency bond ratio from 17.4% to 40.7%. Average remaining tenor is 12.09 years overall. The average rate of 1.79% is compared with the 10-year JGB at 3.07%. All debt is fixed-rate.
Stacked bar chart of debt by type over time, maturity distribution table and a line chart of average rate versus JGB yield.
H1 non-consolidated revenue ¥1,149.6 billion (+¥74.0 billion) and operating expenses ¥940.7 billion (+¥59.0 billion), including personnel costs of ¥236.4 billion (+¥25.7 billion) and repairs of ¥143.1 billion (+¥12.9 billion). Operating profit ¥208.9 billion (+¥14.9 billion), ordinary profit ¥170.8 billion (-¥8.2 billion), net profit ¥110.2 billion (-¥35.0 billion).
Line-item income statement table with prior-year comparison columns.
Non-consolidated total assets are ¥9,581.7 billion (-¥73.2 billion versus March 2026), with current assets ¥956.3 billion and fixed assets ¥8,625.4 billion. Liabilities are ¥7,298.0 billion and net assets ¥2,283.6 billion (+¥52.1 billion). Non-current liabilities rose ¥128.1 billion on bonds, while current liabilities fell ¥253.5 billion on lower payables.
Two-sided balance sheet table with change columns.
Revenue forecast ¥3,358.0 billion (+¥63.0 billion versus April): Transportation ¥2,210.0 billion, Retail & Services ¥426.0 billion, Real Estate & Hotels ¥605.0 billion, Others ¥117.0 billion. Operating profit ¥450.0 billion; EBITDA ¥908.0 billion; ROA 4.1% (Mobility 3.0%, Life Solutions 5.0%), ROE 8.5%. FY3/2028 targets: revenue ¥3,518.0 billion, operating profit ¥488.0 billion, EBITDA ¥958.0 billion, ROA 4.3%, ROE 8%+.
Large segment table covering revenue, operating profit, EBITDA and ratios across FY3/2026 actual, April and October forecasts, and FY3/2028 targets.
Plan: Shinkansen 24,206 million passenger-km, revenue ¥654.4 billion (+¥39.3 billion); conventional lines revenue ¥1,351.6 billion (+¥118.1 billion); total railway revenue ¥2,006.0 billion (+¥157.4 billion, 108.5%). Commuter passes ¥483.1 billion (fare revision +¥34.5 billion). Fare revision assumptions at application: overall rate 7.1% and revenue +5.0%; commuter passes 11.0% and +8.7%; non-commuter 7.8% and +5.7%.
Plan table with factor breakdowns plus a box of fare revision assumptions and a note on calculation method changes.
FY3/2027 operating expenses ¥2,055.0 billion (+¥131.2 billion): personnel ¥472.0 billion (+¥39.8 billion), non-personnel ¥1,021.0 billion (energy ¥102.0 billion, repairs ¥369.0 billion, other ¥550.0 billion), JRTT lease ¥78.0 billion, taxes ¥119.0 billion, depreciation ¥365.0 billion. From FY3/2028 the COVID repair catch-up ends, and the Takasaki to Nagano lease after October 2027 is not in the targets.
Expense plan table with notes on outlook assumptions to the right.
Changes are marked in red. Railway transport revenue FY3/2027 is ¥2,006.0 billion (April plan ¥1,944.0 billion), FY3/2032 ¥2,007.0 billion. Retail revenue ¥350.0 billion, transit advertising ¥38.9 billion, SC/office/hotel revenue ¥440.0 billion, and real-estate fund AUM ¥650.0 billion with the FY3/2032 target raised from ¥1.2 trillion to ¥1.4 trillion. Group CO2 target is -60% by FY3/2036 versus FY3/2014.
KPI table by business area with current, next-year and FY3/2032 columns and red text marking changes.
Mobile Suica issued 45.0 million (+2.86 million), targeting 50 million in FY3/2028 and 70 million in FY3/2032. In-house payment transaction value ¥5.35 trillion, targeting ¥9 trillion. Global external sales ¥17.1 billion (target ¥40.0 billion), construction external sales ¥9.7 billion (target ¥12.6 billion), and energy CO2 reduction 287 thousand tonnes.
KPI table with current value, change, FY3/2028 and FY3/2032 columns.
Safety: railway accidents -30% by FY3/2032 versus FY3/2024, platform doors at 187 stations rising to 330 stations by FY3/2032. People: engagement positive rate 65.0% rising to 70%, women managers 9.4% to 15%. Innovation: digital talent 4,700 rising to 11,000. Finance: domestic rating AA and foreign A, cross-shareholdings cut 30%+ by FY3/2032 versus FY3/2025.
KPI table grouped by Safety, CX, People, Innovation and Finance, with current and target columns.
Section divider introducing Part IV, the reference materials.
White page with a single centered section title.
FY3/2027 forecast: revenue ¥3,358.0 billion, EBITDA ¥908.0 billion, operating profit ¥450.0 billion, ROA 4.1%, net debt/EBITDA 5.8x, ROE 8.5%. FY3/2028: revenue ¥3,518.0 billion, EBITDA ¥958.0 billion, operating profit ¥488.0 billion. FY3/2032: revenue about ¥4.3 trillion, EBITDA about ¥1.2 trillion, operating profit about ¥750 billion (Mobility about ¥260 billion, Life about ¥490 billion), ROA 5%+, ROE 10%+.
Three-column table (FY3/2027, FY3/2028, FY3/2032) with KGI, KPI and current outlook legend.
Cost of equity is now recognised at about 7.5% (CAPM about 7% with risk-free about 3%, beta 0.7 to 0.8, market risk premium about 5.5%; inverse PER about 6.5%). JR East aims to widen the equity spread through ROE of 10%+ in FY2031 and a lower cost of equity. ROE history includes 10.9% in FY2016, 4.1% in FY2022, 8.4% in FY2025 and a 8.5% forecast for FY2026.
ROE time-series bar chart with a calculation panel for cost of equity under the beige summary box.
WACC is recognised at about 4% (cost of equity 7.5% x about 0.4 plus after-tax debt cost 1.5% x about 0.6). ROIC is treated as roughly equal to ROA. History: FY2016 ROIC 5.7% and ROA 5.9%, FY2025 3.7% and 3.9%, FY2026 forecast ROA 4.1%, FY2031 ROA 5%+ (Mobility 3%+, Life 7%+). The aim is to widen the ROIC to WACC spread.
Formula box for WACC beside a bar and line chart of ROIC and ROA history.
Mobility ROA was 5.2% in FY2018, 2.4% in FY2024, 2.6% in FY2025 and 3.0% forecast for FY2026, targeting 3%+ in FY2031. Life Solutions ROA was 5.2%, 5.4%, 5.5% and 5.0%, targeting 7%+. Mobility levers are inbound, notification-based pricing, fare system review and automation; Life levers are growth above inflation and rates, real-estate rotation and Suica data.
Two line or bar charts of segment ROA history with lists of improvement levers beneath each.
PBR was 1.42 in FY2016, 0.98 in FY2019, 1.34 in FY2025 and 1.20 in the FY2026 second quarter. PER was 13 in FY2016, 27 in FY2022 and 14 in the FY2026 second quarter, versus a TSE Prime average of roughly 19 to 20. PBR is explained as ROE times PER, or ROA times leverage times one over cost of equity minus growth.
Two time-series charts for PBR and PER with a yellow TSE Prime average line and a formula box.
Five levers: profitability, asset efficiency, optimal capital structure, lower cost of equity and higher expected growth. Targets: revenue about ¥4.3 trillion, EBITDA about ¥1.2 trillion, operating profit about ¥750 billion, assets about ¥13 trillion (Mobility ¥8 trillion, Life ¥6 trillion), net debt/EBITDA 5x, ROA 5%+, ROE 10%+, payout ratio 40% with flexible buybacks, and PBR sustainably above 1x.
Framework diagram linking five levers to a target table with balance sheet and return targets.
Sharpen the two-axis strategy; for Mobility, expand capacity and pursue Shinkansen non-reserved fee notification, an inflation mechanism and rate-of-return review. For Life Solutions, price and rent increases, J-TOD, condo business and rotation with JR East Itochu real estate development. Also teppay code payment, Suica as a life device, data-driven ads, the 36 HQ structure and a capital efficiency check of 13 businesses.
Text columns by business area under a beige summary box with red emphasis text.
Asset efficiency targets ROA 5%+ in FY2031, with asset carve-outs such as the Kamakura depot site and a cross-shareholding cut of 30%+. Capital structure treats Real Estate & Hotels as a growth business with a net debt/EBITDA guide of 8 to 10x and Mobility as a sustainable business. Cost of equity is addressed through dialogue, governance recovery and disclosure, and IR DAY was held twice in FY2026.
Four text blocks covering asset efficiency, capital structure, cost of equity and expected growth.
Institutional channels include results briefings, IR DAY, a real-estate briefing, site tours, one-on-one meetings and conferences; retail channels include web briefings, site tours and IR events. About 335 institutional investor and analyst firms were met (+about 35 year on year); 48% domestic and 52% overseas; 18% handled by management and 82% by IR staff.
Channel list on the left with donut charts of investor mix and meeting attendees on the right.
Concerns span management (Yūshō 2034 target update, rate impact), Mobility (second fare revision, Shinkansen non-reserved notification, planned lease, labor shortage, transport troubles), Life Solutions (leasing at Takanawa Gateway City and Ōimachi, price pass-through, Suica Renaissance), capital policy (cost of capital, 40% payout timing, buybacks) and ESG. Q&A is posted on the IR library page.
Five-category text table of investor concerns with a link to the Q&A library.
Investor feedback flows to the board, CEO, departments and employees. H1 improvements include updated Yūshō 2034 targets and cost of capital, the March 2026 fare revision, the Takanawa Gateway City grand opening, a new real-estate company, JAL and municipality partnerships, a merger of overseas business and overseas rail business, IR DAY, and the fourth and fifth Suica Renaissance announcements.
Loop diagram of the feedback cycle with a list of improvement items.
Sources: operating cash flow of ¥5.5 trillion (excluding asset management and R&D), asset management ¥0.9 trillion, and external funding at net debt/EBITDA of about 5x with an equity ratio of about 30% by FY3/2032. Uses: growth ¥3.1 trillion, maintenance and strengthening ¥3.2 trillion, LX fund and others ¥0.3 trillion, plus shareholder returns with payout rising to 40% by FY3/2028.
Sources and uses diagram of cash flows with bars or boxes sized by amount.
Payout ratio was 38.0% in FY3/2023, 26.8% in FY3/2024, 30.3% in FY3/2025 and 33.7% in FY3/2026, with 37.5% forecast for FY3/2027 and a 40% policy for FY3/2028. Dividend per share (adjusted for a 3-for-1 split) was ¥60 in FY3/2025, ¥74 in FY3/2026 and ¥88 forecast for FY3/2027.
Combined bar and line chart of dividend per share and payout ratio by fiscal year.
Rental property book value rose from ¥854.8 billion in FY3/2022 to ¥1,445.4 billion in FY3/2026, with unrealized gains of ¥2,085.3 billion. Cross-shareholdings at market value were ¥280.0 billion in March 2026 (64 issues, 9.2% of net assets) and ¥274.1 billion in September 2026 (8.6%). Issues sold were 2, 7, 9 and 2 for ¥5.7 billion, ¥20.9 billion, ¥46.2 billion and ¥12.2 billion.
Two bar charts with accompanying tables for rental property and cross-shareholdings over time.
Platform doors are accelerated to 330 stations and 758 platforms by FY3/2032 (about ¥490 billion). Earthquake countermeasures to FY3/2034 total about ¥1 trillion (phase III about ¥450 billion). The Fukushima Station approach line costs about ¥13 billion, and the Haneda Airport Access Line (tentative) opens in FY3/2032 at about ¥280 billion. Driverless Shinkansen costs are undisclosed.
Table of major projects with cost, schedule and photos or schematics.
Takanawa Gateway City totals about ¥610 billion and Ōimachi Tracks about ¥120 billion. Other projects include Hamamatsuchō West Exit (about 301 thousand square meters, use from March 2027), Tamachi West Exit, Blue Front Shibaura (about 550 thousand square meters), the Institute of Science Tokyo Tamachi campus land and the Shinagawa North Exit station building (about ¥160 billion). The goal is over ¥100 billion a year of revenue by the mid-2030s.
Project table with floor area, opening date and cost, plus an area map of the Shinagawa corridor.
Shibuya Scramble Square Central and West towers (about 95 thousand square meters) complete in FY3/2032; the Shinjuku Southwest Exit blocks are under review with Keio; Ikebukuro, Yokohama, Omiya and Chiba are to be defined. On company land, the JR Funabashi Ichibachō site (about 45,400 square meters, complete December 2028, sales revenue about ¥42 billion) is a joint venture with Tokyu Fudosan HD. Investment and returns are undisclosed.
Project table by terminal station followed by a company land panel with site details.
Group capex was ¥692.2 billion in FY3/2021 and ¥825.8 billion in FY3/2025. On the new classification, FY3/2026 actual was ¥949.1 billion (Mobility ¥423.9 billion, Life ¥525.1 billion; depreciation ¥428.7 billion). FY3/2027 plan is ¥850.0 billion (Mobility ¥449.0 billion, Life ¥400.0 billion, LX fund ¥1.0 billion; growth ¥428.0 billion, maintenance ¥421.0 billion; depreciation ¥458.0 billion).
Stacked bar chart of capex by segment with a growth versus maintenance table for the new classification.
Policy: diversify methods, use mid tenors, control interest, manage debt against earnings and continue sustainability finance. Long-term funding in April to September 2026 was ¥334.0 billion, including ¥92.8 billion of sustainability finance. Facilities total ¥1.11 trillion. Ratings: R&I AA+ (stable), Moody's A1 (stable), S&P A+ (stable).
Policy text with a table of funding facilities and a ratings table.
Net debt/EBITDA fell from 19.0x in FY3/2022 to 5.8x in FY3/2026, targeting about 5x in FY3/2032. EBITDA was ¥842.9 billion in FY3/2026 and ¥481.9 billion in H1 FY2026 with net debt of ¥5,133.8 billion. Interest coverage was 9.6 in FY3/2026 and 5.4 in H1; D/E has been 1.7.
Time-series table of EBITDA, net debt, leverage ratio, interest coverage and D/E ratio with a leverage line chart.
Consolidated repayments excluding short-term debt: FY3/2027 ¥279.1 billion, FY3/2028 ¥371.1 billion, FY3/2029 ¥330.4 billion, FY3/2030 ¥392.2 billion, FY3/2031 ¥381.8 billion, FY3/2032 ¥299.1 billion, split among bonds, loans and railway payables. ¥136.8 billion had been repaid by September 30, 2026. Maturities are levelled to limit refinancing risk.
Stacked bar chart of annual repayments by instrument type with a supporting table.
Initiatives include the SDGs, UN Global Compact (since 2024), GX Future Consortium, CDP, TCFD and TNFD. Recognitions include the PRIDE Index Gold for 9 consecutive years (2025), Health and Productivity Management Outstanding Organization 2026 (large), Sports Yell Company 2026 and a Shokuiku excellent corporation 2026.
Logo grid of initiatives and certification badges with the Switch! Sustainable Train logo.
The JR East Group Report 2026 integrated report covers Yūshō 2034 initiatives, the two-axis growth strategy, six materialities, safety and governance dialogue. IR DAY focused on sustainable mobility with an outside director dialogue. The Nikkei/TSE IR Fair 2026 drew about 1,300 retail investors over 2 days, and JR East won the SAAJ Disclosure Excellence Award 2026, first in the transportation sector.
Report cover images and an event summary with award badge.
Closing slide gives the IR website, https://www.jreast.co.jp/company/ir/, and the forward-looking statements disclaimer. Listed risks include the ability to maintain or increase rail ridership, expand life-style solutions businesses, improve profitability, and changes in the Japanese economy, regulation and government policy.
Text-only page with the IR URL on top and a disclaimer paragraph below.
このスライドと基礎となるプレゼンテーションコンテンツに関する一般的な質問。
The original is in Japanese and is titled 2027年3月期 第2四半期決算説明資料 (決算説明資料 means earnings presentation materials). JR East published it on TDnet, the Tokyo Stock Exchange's Timely Disclosure network, and on its own IR site. This page provides English page-by-page summaries so you can navigate the Japanese slides.
It covers the first half, April to September 2026, of the fiscal year ending March 2027. JR East names fiscal years by the calendar year in which they begin, so this year is 2026年度 (FY2026), while financial tables label it FY3/2027. The deck is dated October 30, 2026.
Revenue was ¥1,585.3 billion (+8.4%), operating profit ¥262.9 billion (+13.6%), ordinary profit ¥230.1 billion (+15.7%), net profit ¥151.9 billion (+3.2%) and EBITDA ¥481.9 billion (+10.3%). Revenue rose for six consecutive periods and set a Q2 record. Transportation operating profit grew to ¥177.5 billion, while Real Estate & Hotels profit fell to ¥41.2 billion on lower property sales.
Operating profit ran above plan through Q2 on strong rail usage, so the forecast was raised to revenue ¥3,358.0 billion and operating profit ¥450.0 billion (+¥21.0 billion). Net profit is now ¥265.0 billion and EBITDA ¥908.0 billion. The annual dividend rises from ¥84 to ¥88, with an interim dividend of ¥44 and a payout ratio of 37.5%.
Yūshō 2034 (勇翔2034) is JR East's mid to long-term strategy, combining mobility and life solutions with five growth engines. The FY3/2032 targets are revenue of about ¥4.3 trillion, EBITDA of about ¥1.2 trillion, operating profit of about ¥750 billion, ROA of 5%+ and ROE of 10%+. The payout ratio is to reach 40% by FY3/2028.
Takanawa Gateway City is expected to earn about ¥65 billion a year from FY3/2031 on a project cost of about ¥610 billion, and Ōimachi Tracks about ¥15 billion a year from FY3/2032 on about ¥120 billion. Both opened fully in FY3/2026 and lifted H1 leasing revenue. Rail revenue is up about ¥0.2 billion a month at Takanawa and ¥0.1 billion at Ōimachi, and the Greater Shinagawa goal is over ¥100 billion a year by the mid-2030s.
JR East recognises a cost of equity of about 7.5% and a WACC of about 4%, with PBR at 1.20 in the FY2026 second quarter, and it aims to widen the equity spread through ROE of 10%+. As a template, it offers a useful structure of highlights, strategy, results and a reference appendix, although its density suits a large-cap institutional audience more than a short investor update.
Official IR page listed on the deck's closing slide; hosts results materials and Q&A.
Original Japanese-language filing of this presentation (2027年3月期 第2四半期決算説明資料).

Create Your Own Slides
Turn your ideas into professional presentations in seconds with 2slides AI.
プロフェッショナルなデザインを参照し、スタイルを選択し、完璧なテキストレンダリングでスライドを生成。Nano Banana搭載—今すぐプレゼンテーションの作成を始めましょう。
© 2026 2slides。全著作権所有。


