
収録コレクション: 投資家向けプレゼン資料の実例 · EC プレゼン資料の実例
Commerce (formerly BigCommerce, NASDAQ: CMRC) 3Q 2026 Earnings Presentation, a 37-slide investor deck that presents the company as a three-brand agentic commerce stack (Feedonomics data, BigCommerce engine, Makeswift experience) and reports US$358M ARR, US$84.2M quarterly revenue (-2% YoY), US$9.0B quarterly GMV (+14%), 94.7% net revenue retention, a 9.5% non-GAAP operating margin, US$9.4M operating cash flow and raised FY2026 profit guidance.
このスライドの表紙をスタイルの参考にして、ご自身の内容からスライドを作成します。 下のページから好きな1枚を選び、そのレイアウトを参考にすることもできます。
クイックナビゲーション
タグ
スライドを共有
Commerce (formerly BigCommerce, NASDAQ: CMRC) 3Q 2026 Earnings Presentation, a 37-slide investor deck that presents the company as a three-brand agentic commerce stack (Feedonomics data, BigCommerce engine, Makeswift experience) and reports US$358M ARR, US$84.2M quarterly revenue (-2% YoY), US$9.0B quarterly GMV (+14%), 94.7% net revenue retention, a 9.5% non-GAAP operating margin, US$9.4M operating cash flow and raised FY2026 profit guidance.
レイアウト、主要コンテンツ、視覚要素を含む各スライドページの詳細ビュー。
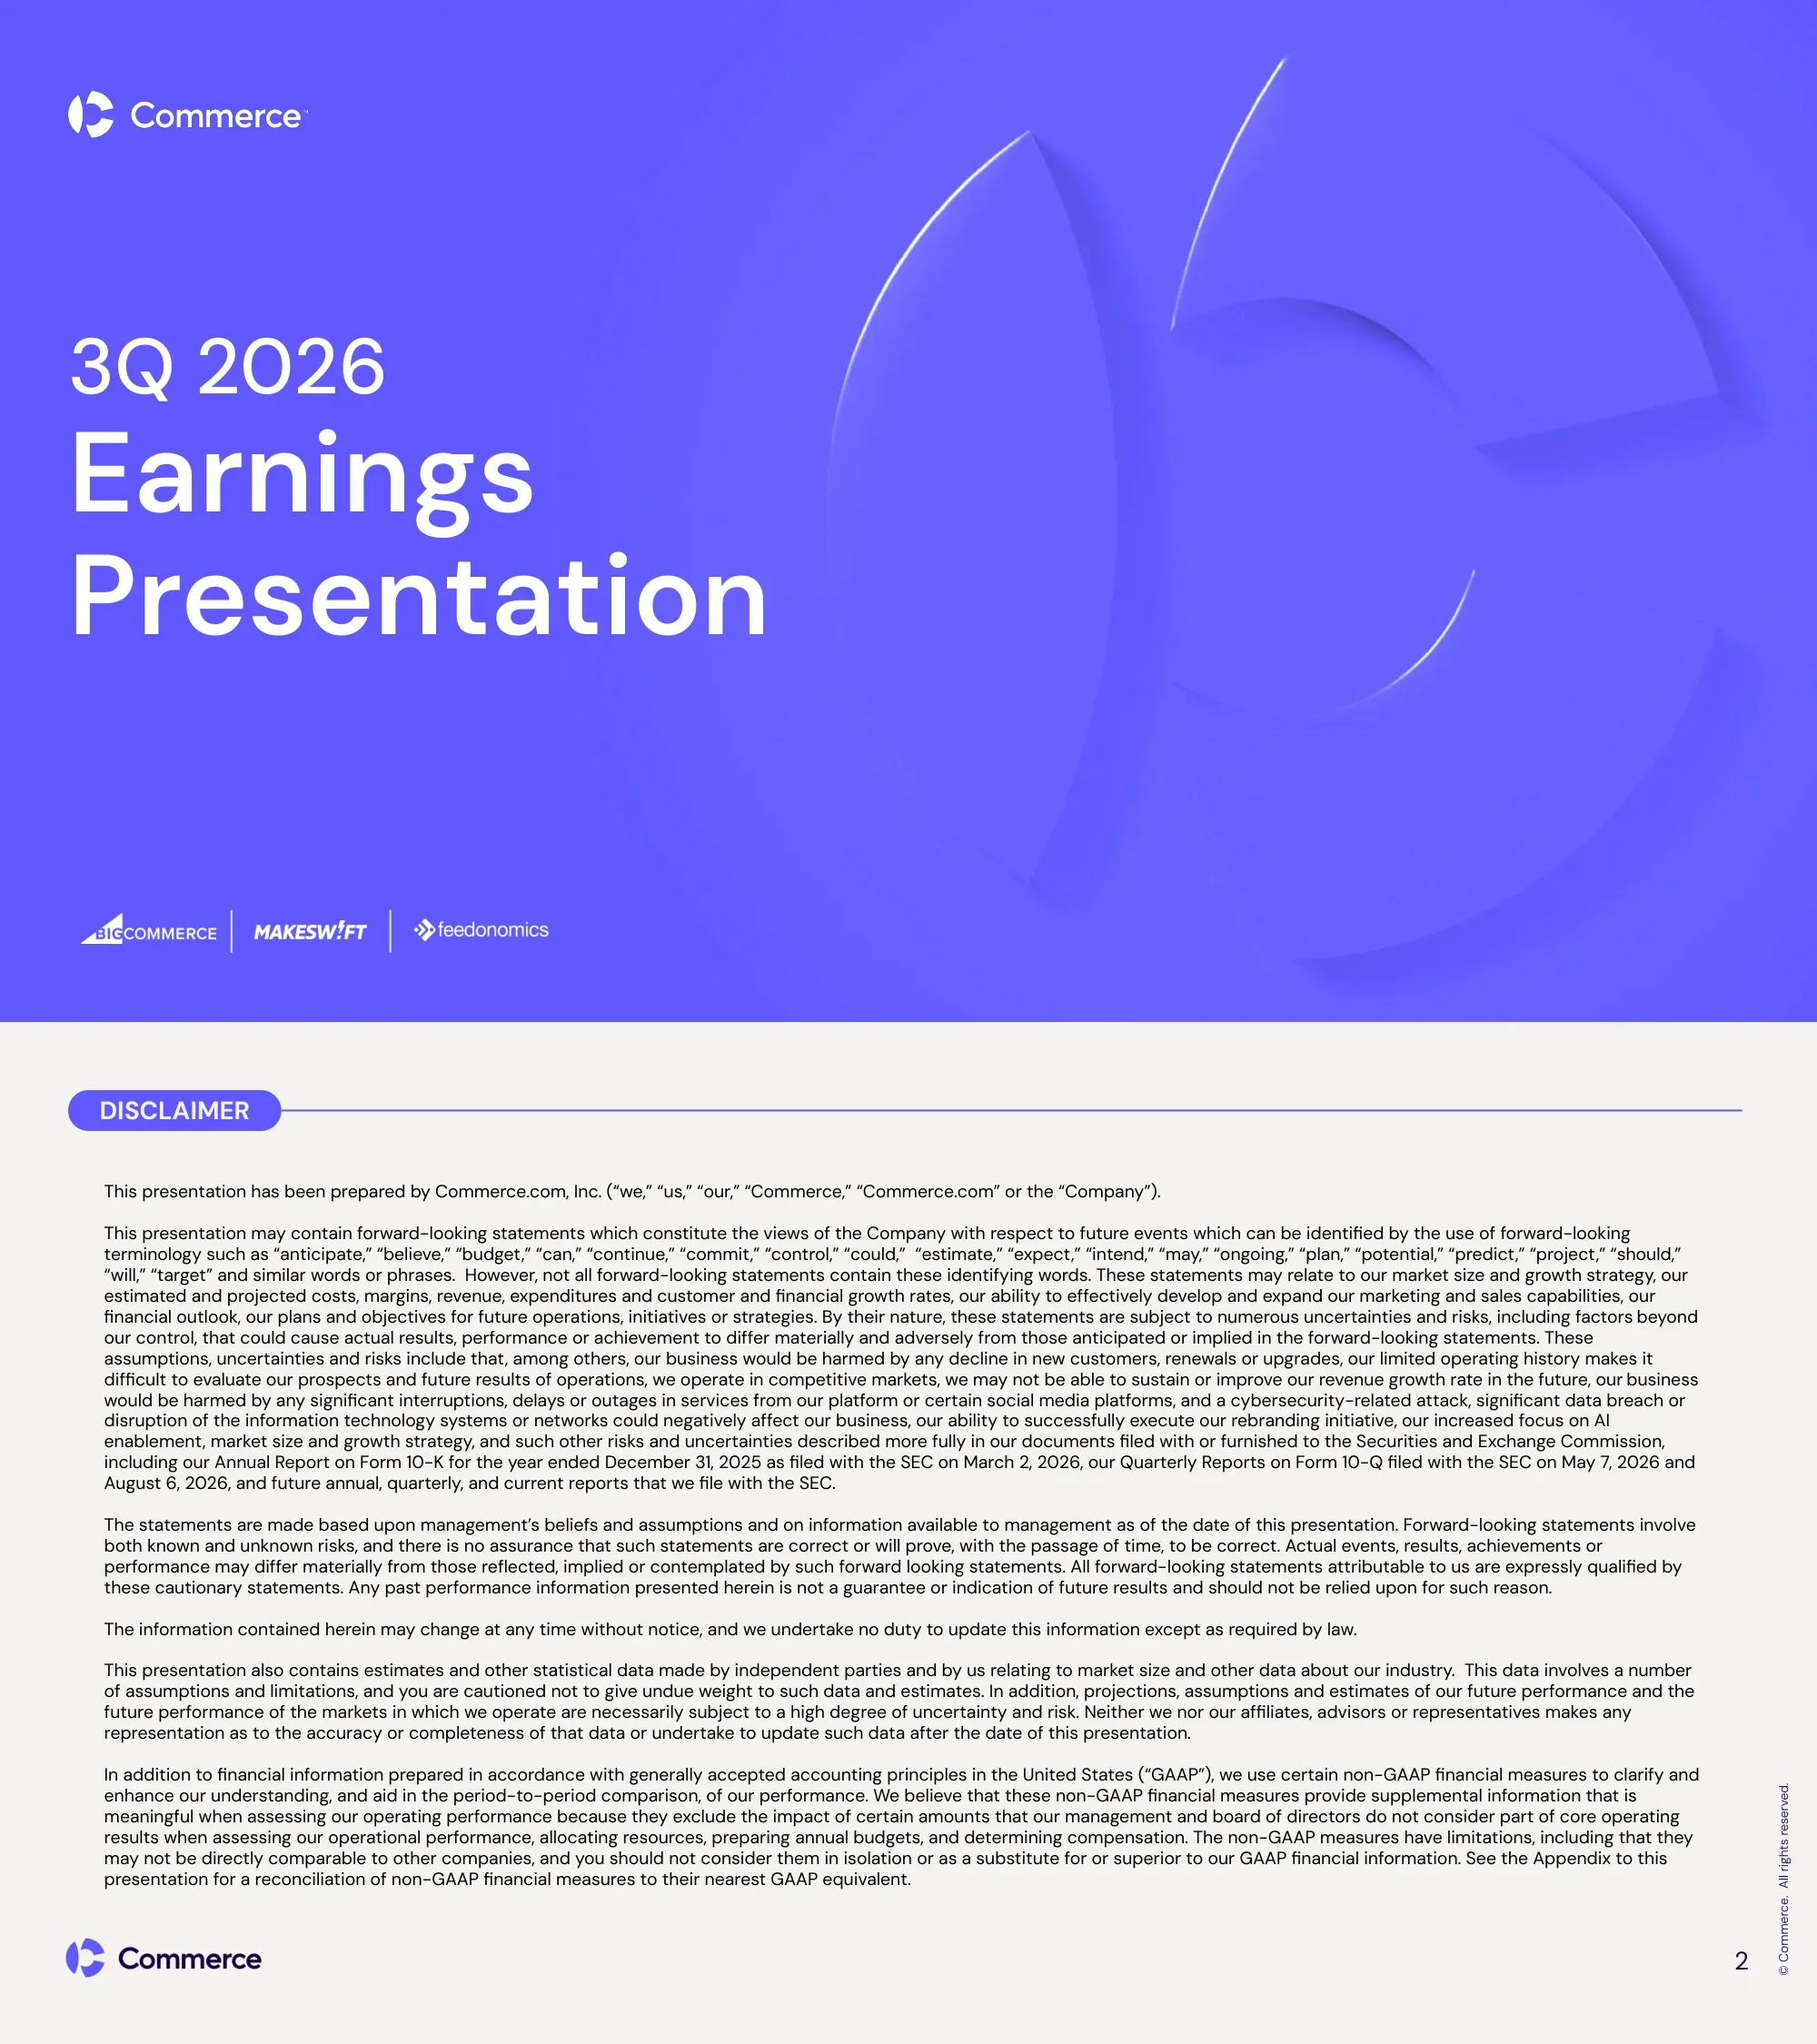
Cover slide for Commerce's third-quarter 2026 earnings presentation, with the BigCommerce, Makeswift and Feedonomics product-brand logos along the bottom.
Full-bleed electric periwinkle background, large white left-aligned title, embossed 3D Commerce 'C' mark on the right, logo strip at the bottom left.
Forward-looking statements and non-GAAP disclaimer from Commerce.com, Inc., referencing the 2025 Form 10-K and the Form 10-Q reports filed May 7 and August 6, 2026.
Light grey slide with a periwinkle pill tag and rule line, dense full-width body text in six paragraphs.
Section divider opening the company overview.
Soft grey abstract 3D background with a large dark title on a lime highlighter bar.
Vision: powering an open, intelligent ecosystem for next-generation commerce. Mission: an open, AI-driven commerce ecosystem that connects tools and data and delivers personalized experiences across every channel.
Midnight-navy background with two staggered text blocks, each topped by a lime pill and rule, lime headings and white body text.
Two columns: traditional commerce problems (fragmented discovery, slow digital adoption, rigid tech stacks) and agentic commerce challenges (AI search skipping storefronts, brands losing control, AI agents handling transactions through APIs and MCP).
Light slide with a large two-line headline and two bulleted columns under periwinkle subheads; footnote pointing to the AI glossary.
Layered stack: Makeswift storefronts, Feedonomics agentic search and checkout (with Perplexity, Copilot, Gemini, PayPal and Google Pay icons), the BigCommerce commerce engine (catalog, orders, cart, promotions, personalization) and Feedonomics data intelligence (enrichment, normalization, optimization, syndication, data orchestration).
Four horizontal bands, each a colored brand pill followed by a row of outlined capability pills in matching color.
Customer logos plotted along a rising price curve from B2C commerce ($) through B2B ($$) and omnichannel ($$$) to agentic commerce ($$$$), where Perplexity, Gemini, Copilot, PayPal and Stripe sit as agentic search and checkout partners.
Navy grid with dashed guide lines, a diagonal line linking four lime-ringed price circles, logo clusters per segment and lime segment labels below.
Timeline across the omnichannel, composable and agentic eras: mid-market expansion, the Feedonomics, B2B Ninja and Makeswift acquisitions, building Catalyst, AI partnerships and the launch of the Commerce brand family.
Navy slide with a horizontal arrow timeline, three era pills, colored milestone dots and a legend for platform, data and content needs.
Snapshot KPIs: $358M ARR, 75% non-GAAP gross margin in 3Q26, non-GAAP operating income improving from ($9M) in 4Q22 to $8M in 3Q26, and operating cash flow from ($3M) to $9M.
Navy slide with a large periwinkle donut ring holding the lime ARR figure on the left and three outlined KPI cards with start-to-end trend lines on the right.
Positions the three brands as Data (Feedonomics), Engine (BigCommerce) and Experience (Makeswift), where traditional and agentic commerce converge.
Navy slide with an intro paragraph on the left, three white brand cards across the top right and a wide white banner card below.
Grid of 28 customer logos including Dell, L'Oréal, HP, Nvidia, Patagonia, Wayfair, Puma, Skechers, Tiffany & Co., Uniqlo and New Balance.
Light slide with a 7 x 4 grid of white tiles holding greyscale logos.
Partner map grouped by category: ad channels, agentic search, martech, marketplaces, CMS, sales and merch, checkout/fraud/lending, ERP, shipping, payments, tax, point of sale, OMS and PIM, with 90+ preferred and elite partners.
Three columns of periwinkle category pills with four partner logos each, a central Commerce logo card and a lime banner along the bottom.
Eight recognition cards from 2024-2025: AI readiness, Gartner, Paradigm B2B (24 medals), TrustRadius, G2, Forrester and IDC.
Navy slide with a 4 x 2 grid of white cards, each with a source logo, lime year tab, periwinkle heading and short text.
Section divider for the competitive positioning section.
Navy background with a light title on a periwinkle underline bar and a large wireframe 3D C mark on the right.
Six investment theses: multi-billion dollar TAM expansion, a rebuilt team and GTM, high gross margins and positive cash flow, a unified AI-era platform, high-quality relationships that scale, and market leadership in B2B commerce. The section pill above the headline is empty in the source.
Periwinkle background with a large white headline and a 3 x 2 grid of white text cards with periwinkle headings.
B2B customer outcomes: $20M+ added net revenue per year per 100 customers, 13% higher AOV, 24% more efficient sales teams, 391% ROI in three years, 7 months to positive ROI and $10K+ IT cost avoidance per 1,000 customers.
Light slide with a two-line headline and three white metric cards (growth, operations, technology costs), each with three large periwinkle stats.
B2B differentiation: out-of-the-box features (multi-company hierarchy, configure-price-quote, invoice portal), enterprise scale (17K+ data feeds, 30M+ products, 20M+ product configurations) and agility (composable architecture, flexible payments, multi-storefront).
Three white cards, each with a periwinkle icon, heading, vertical connector of gear icons and an arrow to a summary line.
B2C outcomes: 61.9% average checkout conversion, 65+ payment providers, 100% Google Lighthouse scores, $180k+ integration savings, 15% more channel revenue, 211% ROI in under eight months and 90% developer time savings by year three.
Same three-card metric layout as the B2B proof slide, with three large stats per card.
B2C differentiation: customization (custom checkout, real-time visual page editing, feed-based personalization), complex business models (multi-storefront, component-based sites, channel syndication) and unified infrastructure (low-code development, AI-optimized product data).
Three white icon cards with gear-icon connectors and arrow summaries; a small stray chart icon sits at the bottom center of the source slide.
Agentic differentiation: discoverability in AI search (structured data, AI-optimized storefronts, APIs and MCPs), merchant control and brand integrity, and intelligent agentic commerce (agentic search and checkout, syndicated data, AI personalization). Footnote defines MCP.
Three white icon cards with gear-icon connectors, arrow summaries and an italic footnote.
Section divider for the financial results.
Navy background with the title on a periwinkle underline bar and the wireframe 3D C mark.
Matrix of revenue model, sales-led motions and self-serve motions for BigCommerce, Feedonomics, Makeswift (self-serve launching early Q1 2027) and partner and services revenue (take-rate fees and BigCommerce Payments).
Navy table with periwinkle column headers, brand logos and icon tiles in the row headers, and thin periwinkle grid lines.
Total ARR grew from $167M at the 3Q20 IPO to $358M in 3Q26 (14% CAGR); five-quarter ARR of $356M, $359M, $360M, $361M and $358M, with YoY growth slowing to +1% in 3Q26.
Two white chart cards: a two-bar CAGR chart with an arrow and a five-bar YoY chart with growth bubbles; ARR definition footnote.
Revenue split into subscription and partner and services: annual revenue from $152M (2020 IPO) to $342M (2025, 18% CAGR); quarterly revenue from $40M (3Q20) to $84M (3Q26, 13% CAGR); quarterly YoY of +3%, +3%, +5%, +0% and -2% for 3Q25-3Q26.
Four white chart cards with stacked periwinkle and black bars, YoY bubbles and a shared legend.
Non-GAAP opex as % of revenue: annual S&M 48% to 38%, R&D 30% to 19%, G&A 18% to 15% (margin -18% to 8%, 2020-2025); quarterly S&M 49% to 30%, R&D 29% to 21%, G&A 19% to 14% (margin -18% to 9%, 3Q20-3Q26).
Two white cards with paired stacked percentage bars and margin labels above.
Quarterly operating cash flow line from ($3M), a -4% margin, in 4Q22 to $9M, an 11% margin, in 3Q26.
Single white card with a zig-zag periwinkle line around a grey zero axis and labelled start and end points.
Quarterly GMV of $7.9B, $8.9B, $8.3B, $8.8B and $9.0B (3Q25-3Q26, +14% YoY in each of the last three quarters) and annual GMV of $25.4B, $28.2B and $31.7B (2023-2025).
Two white chart cards with periwinkle bars, YoY bubbles and a GMV definition footnote.
Quarterly net revenue retention of 94.5%, 95.2%, 95.4%, 95.8% and 94.7% from 3Q25 to 3Q26, with the NRR definition.
White card with a five-point periwinkle line chart and data labels, plus a footnote.
Q4 2026 revenue of $83.4M-$86.4M (-5% YoY at midpoint), non-GAAP operating income of $6.8M-$8.8M and an 8-10% margin; FY2026 revenue of $339.0M-$342.0M (-1%), non-GAAP operating income of $35.3M-$37.3M and a 10-11% margin.
Light slide with a clean four-column guidance table, periwinkle row labels and a footnote on GAAP reconciliation.
Section divider for the GAAP and non-GAAP appendix.
Navy background with the title on a periwinkle underline bar and the wireframe 3D C mark.
Three months ended September 30: revenue $84.2M vs $86.0M, gross profit $62.4M, total operating expenses $64.2M including $4.0M restructuring, loss from operations ($1.8M) and net loss ($3.2M) vs ($2.2M) a year earlier.
White slide with a navy-header financial table, zebra rows and dotted row separators.
As of September 30, 2026 vs December 31, 2025: cash and equivalents $92.5M (from $44.3M), marketable securities $69.1M, total assets $327.3M, convertible notes $152.2M (related party, non-current) and total stockholders' equity $52.3M.
Dense full-width table with navy header, bold subtotal rows and underlined totals.
Quarterly cash flows: net cash from operations $9.4M (vs $10.6M), investing inflow $26.4M from $30.0M of maturing securities, financing outflow ($0.4M), ending cash and restricted cash $93.7M.
Dense full-width table with navy header and bold section rows.
Bridges GAAP to non-GAAP gross profit (74.5% vs 79.1% margin), S&M (29.6% of revenue vs 40.2%), R&D (21.4% vs 17.9%), G&A (14.1% vs 11.7%) and operating income ($8.0M, a 9.5% margin, vs $8.0M and 9.3%).
Table with navy section-header bands for each line item, italic percentage rows and dotted separators.
Net loss of ($3.2M) adjusted for stock comp, depreciation, amortization, interest, taxes, restructuring and other expenses to adjusted EBITDA of $9.9M vs $8.8M a year earlier.
Simple two-column table with a navy header and bold total row.
Net loss of ($3.2M) adjusted for stock comp, amortization and restructuring to non-GAAP net income of $6.6M vs $6.2M.
Spacious two-column table with a navy header and bold total row.
Ten AI commerce terms with definitions and applications: agent, agentic checkout, agentic discovery, agentic search, buyer agent, data syndication, LLMs, merchant agent, product data enrichment and shopper agent.
White slide with a black-ruled three-column table (term, definition, application) under a navy header row.
このスライドと基礎となるプレゼンテーションコンテンツに関する一般的な質問。
It is a 37-slide investor deck from Commerce.com, Inc., the e-commerce platform company formerly named BigCommerce. It covers the company's vision, its three-brand agentic commerce stack (Feedonomics, BigCommerce, Makeswift), customer and partner proof, investment highlights, Q3 2026 financials (ARR, revenue, GMV, NRR, margins, cash flow), Q4 and full-year 2026 guidance, and a GAAP/non-GAAP appendix with an AI glossary.
ARR of US$358M (+1% YoY), revenue of US$84.2M (-2% YoY), GMV of US$9.0B (+14%), total net revenue retention of 94.7%, a 74.5% non-GAAP gross margin, US$8.0M non-GAAP operating income (9.5% margin), US$9.4M operating cash flow, adjusted EBITDA of US$9.9M and a GAAP net loss of US$3.2M that included US$4.0M of restructuring charges.
The company formerly named BigCommerce renamed its parent company Commerce (Commerce.com, Inc., still trading on Nasdaq as CMRC). BigCommerce, Feedonomics and Makeswift are now product brands within the Commerce family, which the deck presents as a single stack for AI-driven, agentic commerce.
Q4 2026 revenue of US$83.4M-US$86.4M (-5% YoY at the midpoint) with non-GAAP operating income of US$6.8M-US$8.8M, and FY2026 revenue of US$339.0M-US$342.0M (-1%) with non-GAAP operating income of US$35.3M-US$37.3M, a 10-11% margin.
ARR eased from US$361M to US$358M, NRR fell from 95.8% to 94.7% and revenue was roughly flat at about US$84M, while operating cash flow rose and full-year non-GAAP operating income guidance went up from US$28.0M-US$34.0M. The earlier deck is in the gallery as the Commerce Q2 2026 Earnings Presentation: https://2slides.com/gallery/commerce-bigcommerce-q2-2026-earnings-presentation
Yes. The gallery page offers the original PDF and a PPTX converted from it, so you can reuse the slide layouts, charts and tables in PowerPoint, Keynote or Google Slides.
It is the 3Q 2026 Earnings Presentation published on Commerce's investor relations site (investors.commerce.com) with its third-quarter 2026 results. All figures are in US dollars, and the appendix tables are in US$ thousands.
A modern corporate style that alternates midnight-navy and light-grey slides, with electric periwinkle as the brand color, lime-green highlights, pill-shaped section tags, rounded white cards and a wireframe 3D logo on section dividers.
Official investor relations site with quarterly results, earnings presentations and SEC filings.

Create Your Own Slides
Turn your ideas into professional presentations in seconds with 2slides AI.
プロフェッショナルなデザインを参照し、スタイルを選択し、完璧なテキストレンダリングでスライドを生成。Nano Banana搭載—今すぐプレゼンテーションの作成を始めましょう。
© 2026 2slides。全著作権所有。


