
収録コレクション: 投資家向けプレゼン資料の実例 · 決算説明資料の実例集
Asahi Kasei H1 FY2026 Earnings Presentation: a 54-page Japanese-language 2026年度第2四半期 決算説明資料 released November 5, 2026, originally published on TDnet (Tokyo Stock Exchange Timely Disclosure), covering first-half FY2026 results (net sales 1兆6,896億円, operating income 1,654億円, +54.0%), a raised full-year forecast of 2,900億円 operating income, segment details for Healthcare, Homes and Material, and shareholder returns.
このスライドの表紙をスタイルの参考にして、ご自身の内容からスライドを作成します。 下のページから好きな1枚を選び、そのレイアウトを参考にすることもできます。
クイックナビゲーション
タグ
スライドを共有
Asahi Kasei H1 FY2026 Earnings Presentation: a 54-page Japanese-language 2026年度第2四半期 決算説明資料 released November 5, 2026, originally published on TDnet (Tokyo Stock Exchange Timely Disclosure), covering first-half FY2026 results (net sales 1兆6,896億円, operating income 1,654億円, +54.0%), a raised full-year forecast of 2,900億円 operating income, segment details for Healthcare, Homes and Material, and shareholder returns.
レイアウト、主要コンテンツ、視覚要素を含む各スライドページの詳細ビュー。
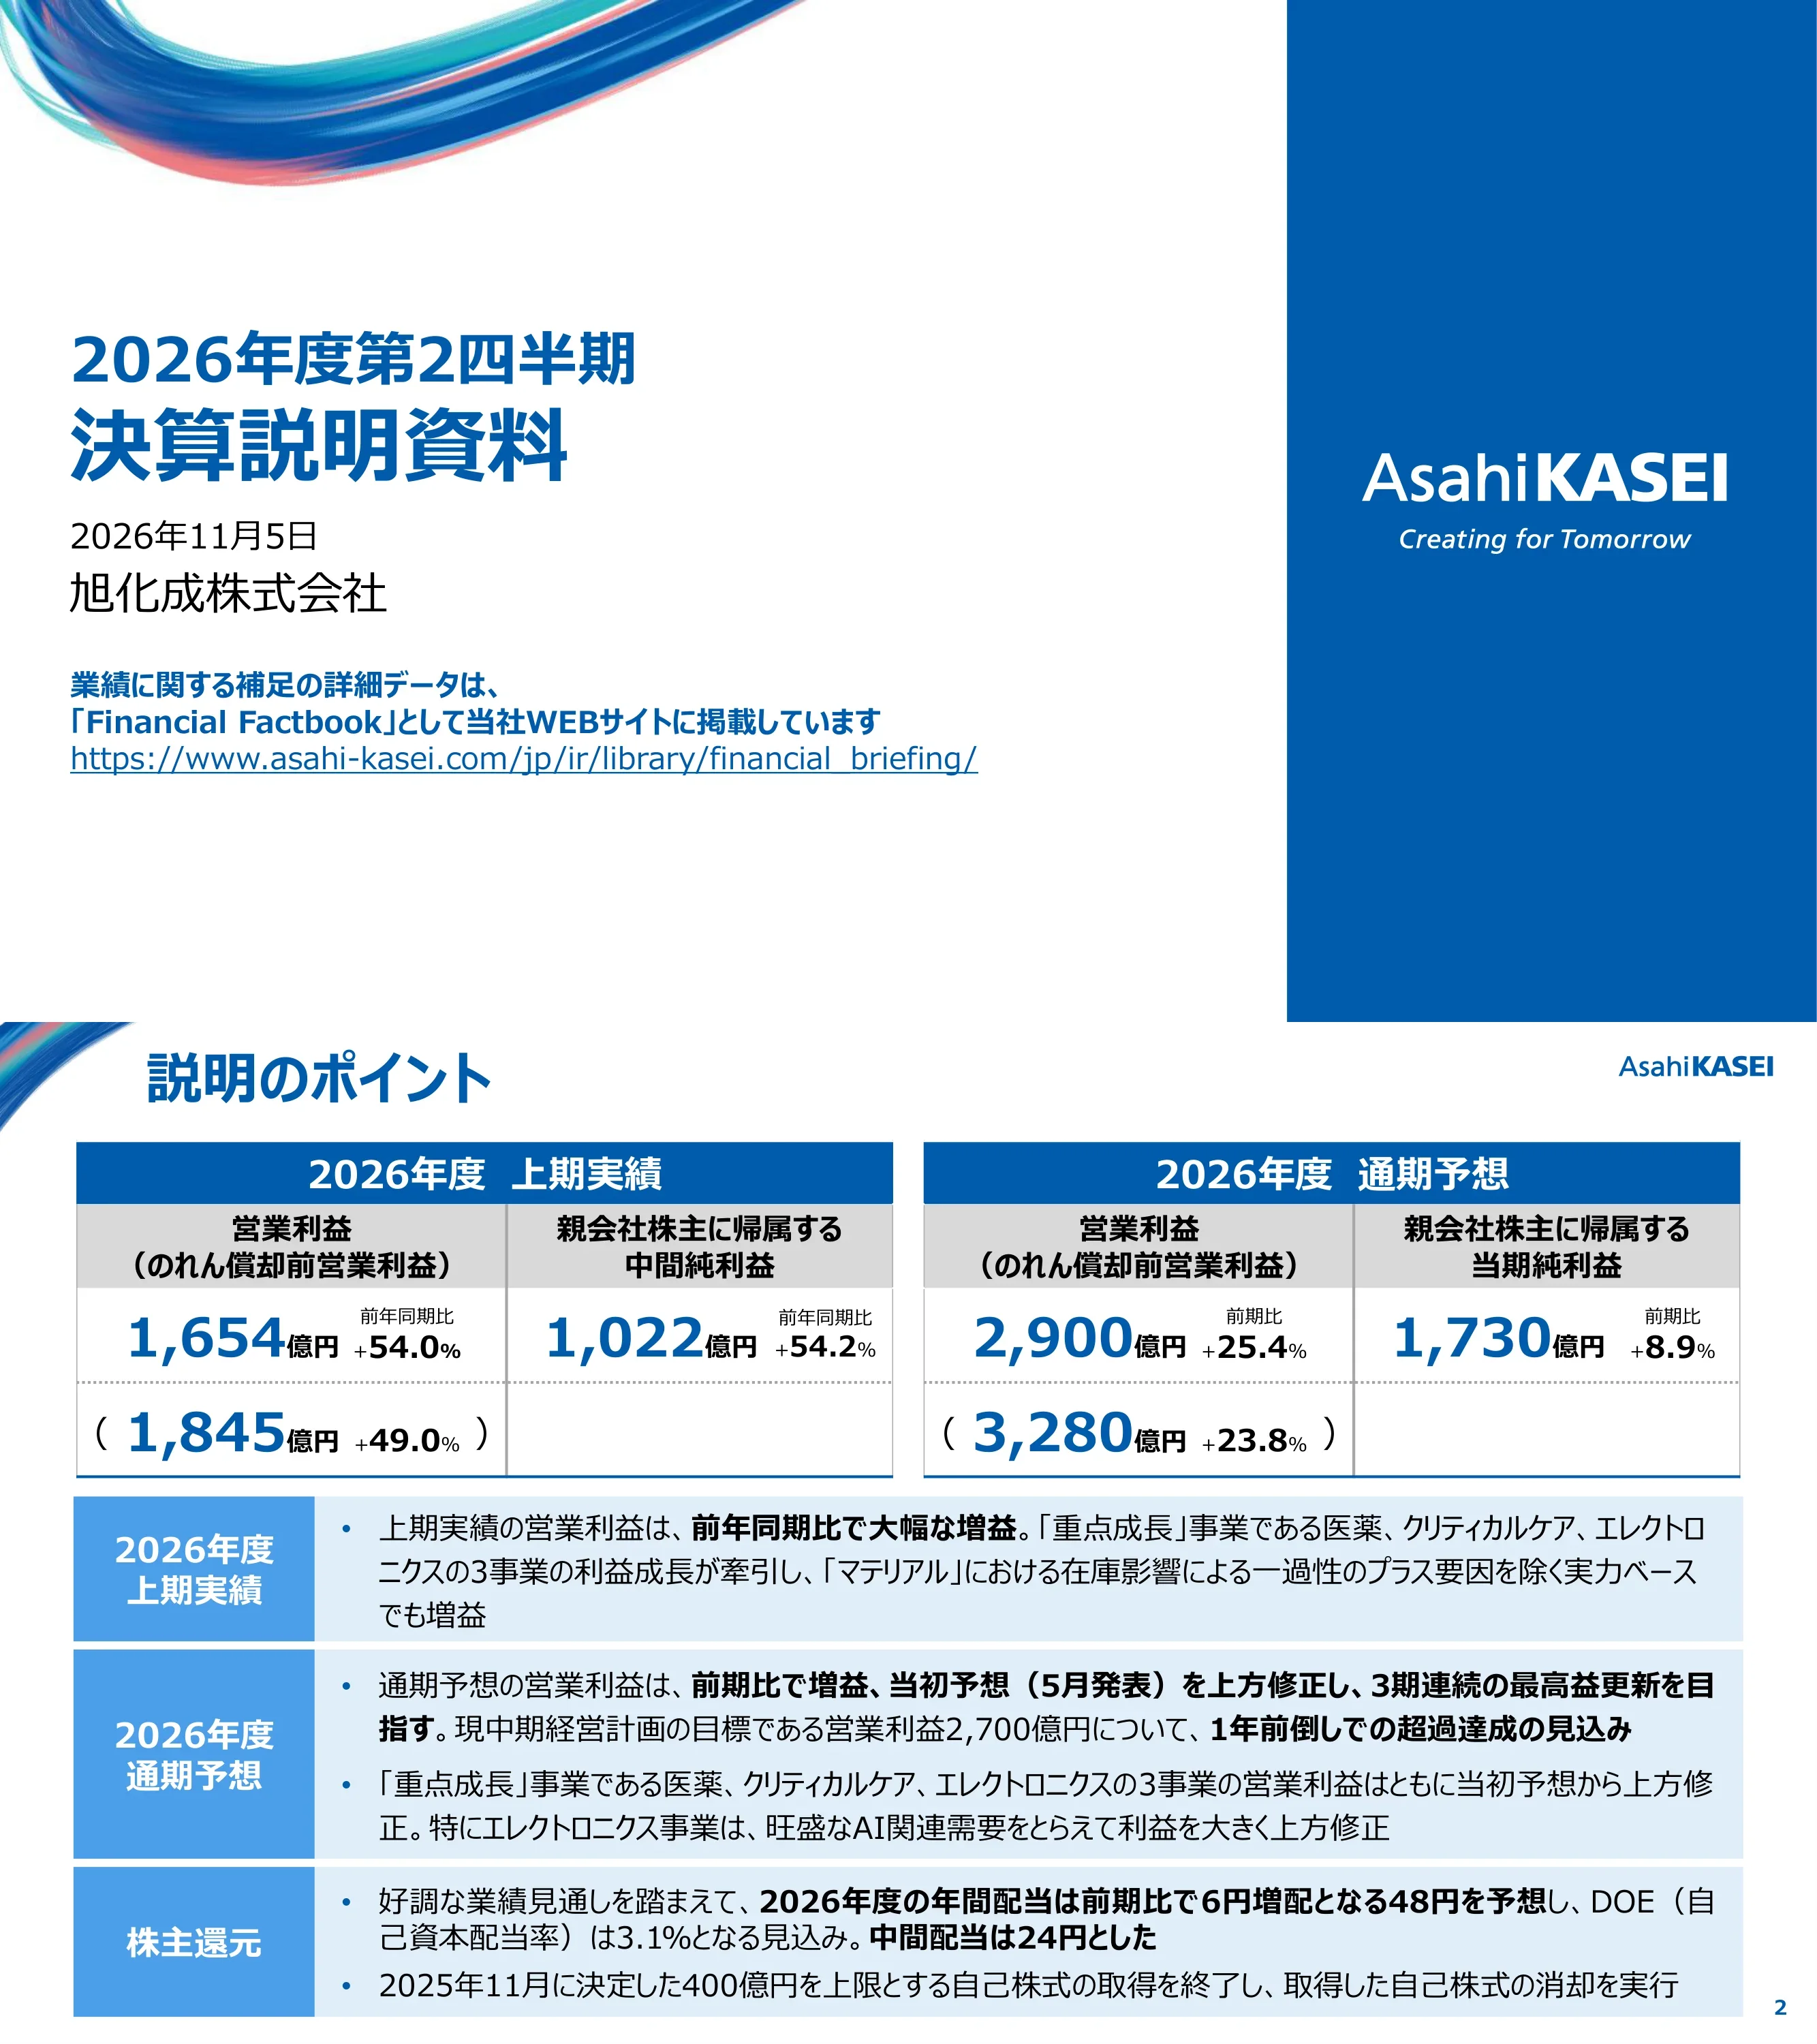
Title slide for Asahi Kasei's FY2026 second-quarter (first-half) results presentation dated November 5, 2026, with a pointer to the Financial Factbook on the company's IR website.
Left-aligned Japanese title block on white with a flowing ribbon graphic at top-left and a solid blue brand panel on the right holding the Asahi Kasei logo.
H1 FY2026 operating income ¥165.4 billion (1,654億円, +54.0% YoY; 1,845億円 before goodwill amortization) and net income ¥102.2 billion (1,022億円, +54.2%); full-year forecast raised to operating income 2,900億円 (+25.4%) and net income 1,730億円 (+8.9%), targeting a third straight record. Annual dividend forecast ¥48 (+¥6), interim ¥24, DOE 3.1%; the 400億円 buyback is complete and the shares cancelled.
Two KPI tables side by side (H1 actual vs. full-year forecast) above three labeled text bands for H1 results, full-year outlook and shareholder returns.
Waterfall from the initial forecast of 2,480億円 to the new 2,900億円 (+420億円, +16.9%): +229 from the three Priority Growth businesses (Pharma & Life Science +78, Critical Care +28, Electronics +123), +61 from other businesses, +130 from Material inventory effects. Electronics was lifted by AI-related demand for Pimel and glass cloth.
Summary callout box on top; horizontal waterfall chart with stacked colored increments, dotted annotation boxes and an orange arrow showing total change.
Operating income grew from 2,096億円 in FY2018 (1,317億円 excluding the petrochemical-related chemical businesses) to a forecast 2,900億円 in FY2026 (2,434億円 excluding chemicals), backed by about 10,000億円 (roughly ¥1 trillion) of M&A and about 6,000億円 of expansion-related capex.
Two donut charts (FY2018 vs FY2026 forecast) flanking a center column of acquired-company logos and product photos, with an ecosystem banner across the bottom.
Matrix of growth investments and structural reforms across the previous plan (2022-2024, Be a Trailblazer) and current plan (2025-2027, Trailblaze Together), including the Aicuris acquisition (1,443億円, closed April 17, 2026), Pimel capacity expansion (160億円, production from H1 FY2028), alkaline water electrolysis capacity (310億円) and a new Planova spinning plant (234億円, FY2029); reforms include exits from MMA, UVC LED and the lead-acid battery separator business.
Two-row grid (growth investment / structural reform) by two plan periods, with color-coded sub-segment header tiles and bullet items.
Maps the three segments (Healthcare, Homes, Material) and their sub-segments to four strategic roles: Priority Growth (Pharma, Critical Care, Overseas Homes, Electronics), Strategic Development, Earnings Base Maintenance/Expansion, and Earnings Improvement/Business Model Transformation (Performance and Essential Chemicals).
Matrix with segment column headers in green, coral and blue; rows for each strategic role with descriptions on the left and business tiles placed in cells.
Operating income: 2,096 (FY2018), 2,026 (FY2021), 2,119 (FY2024), 2,312 (FY2025), 2,900 forecast (FY2026) in 億円, with a 3,800 outlook for FY2030; the current plan's 2,700億円 FY2027 target is expected to be exceeded a year early.
Stacked bar chart by business category under a two-part arrow banner, with a dotted outline bar for the 2030 outlook and a callout box.
Overseas pharma sales: Envarsus XR US $199M and Tarpeyo US $175M in H1 FY2026; Hovilpri (pritelivir) won FDA approval in October 2026. Critical Care H1 sales: ACT $791M and CMS (LifeVest) $535M, both growing.
Two side-by-side stacked bar charts (FY2022-FY2026 H1) under green header boxes, each with commentary below.
Overseas Homes H1 sales rose to 1,619億円 (North America Synergos and Australia NEX); Electronics shows indexed sales with 2022-2026 CAGR of 26% for Pimel, 18% for glass cloth and 5% for camera-module ICs, driven by AI demand.
Left stacked bar chart in red tones and right indexed line chart with CAGR legend box, each with commentary below.
Lists five measures (portfolio transformation, earnings power, investment management, capital structure, cost of capital) alongside PBR history (0.98 in FY25, aim 1.00) and ROE/PER trends (ROE 8.0% FY25, 9.0% FY27 plan vs. 8% cost of equity). A special incentive for the employee shareholding association starts in FY2026.
Left column of five bordered measure boxes; right column with PBR line chart and ROE/PER dual-axis chart.
Section divider introducing the first-half results.
Full-width blue lower panel with white section title and ribbon graphic above.
Net sales 1兆6,896億円 (+13.7%), operating income 1,654億円 (+54.0%, margin 9.8%), EBITDA 2,726億円, net income 1,022億円 (+54.2%), EPS ¥75.94; all above the July forecast. Average FX ¥159/US$ and ¥184/EUR; naphtha ¥108,400/kl; interim dividend ¥24.
Summary callout on top; financial table comparing H1 FY2025, H1 FY2026, YoY change and July forecast, with an assumptions block beneath.
Operating income rose 580億円 from 1,075 to 1,654: Priority Growth three businesses +307 (Pharma & Life Science +109, Critical Care +95, Electronics +102), other businesses +103, Material inventory effects +170.
Waterfall chart with segment-colored increments, dotted driver annotations and an orange total arrow; FX rates shown below.
Sales +2,032億円 and operating income +580億円 YoY. Healthcare OI 603 (+203), Homes 441 (-24), Material 720 (+410, +132.5%), with sub-segment drivers such as Essential Chemicals +217 and Performance Chemicals +133.
Two stacked comparison bars (sales and operating income) on the left; three color-coded driver tables on the right.
Sales +36億円 (+0.2%) and operating income +204億円 (+14.1%) above the July forecast: Healthcare +73, Homes -4, Material +130 (Electronics +39, Essential Chemicals +46, Performance Chemicals +43).
Same layout as the segment page: stacked forecast-vs-actual bars with right-hand driver tables.
Non-operating income worsened to -41億円 on higher interest expense; net extraordinary items improved to -4億円 from -94 as last year's restructuring costs (362) fell away; income taxes rose to 546億円.
Summary callout on top; three-column table (H1 FY2025, H1 FY2026, change) with line items.
Total assets 4兆4,115億円, up 2,735億円 on Aicuris goodwill/intangibles and higher inventories. Interest-bearing debt 11,755億円 and D/E ratio 0.56, within the 0.7 guideline.
Balance sheet table (assets and liabilities/net assets) on the left; bar-and-line chart of debt and D/E ratio on the right.
Operating cash flow 950億円 (down on working capital), investing cash outflow 2,437億円 including 1,317億円 of M&A (Aicuris), free cash flow -1,487億円 for H1 FY2026.
Two colored commentary bars on top; three bar charts (operating CF, investing CF, FCF) across three half-years with the current period outlined in orange.
Section divider introducing the full-year outlook.
Full-width blue lower panel with white section title.
Net sales 3兆4,220億円 (+11.3%), operating income 2,900億円 (+25.4%, margin 8.5%), EBITDA 5,090億円, net income 1,730億円 (+8.9%), EPS ¥129.12, dividend ¥48; all raised from the May forecast. Assumptions: ¥157/US$, ¥180/EUR, naphtha ¥99,200/kl.
Summary callout; wide table with FY2025 H1/H2/full year, FY2026 H1/H2 forecast/full year, YoY and May-forecast comparison, plus assumptions.
Operating income forecast to rise 588億円 from 2,312 to 2,900: Priority Growth businesses +344 (Electronics +168, Critical Care +127, Pharma & Life Science +49), other businesses +144, Material inventory effects +100.
Waterfall chart with segment-colored steps, dotted driver box and orange total arrow.
Higher petrochemical feedstock prices were largely passed through; inventory gains are expected to settle at about +100億円 for the year as naphtha falls from ¥108,400/kl in H1 to an assumed ¥90,000/kl in H2. Segment-by-segment impacts and responses are tabulated.
Callout on top, bullet list of forecast assumptions, then a three-row table colored by segment.
Sales +3,475億円 (+11.3%) and operating income +588億円 (+25.4%): Healthcare 1,005 (+170), Homes 963 (-35), Material 1,150 (+467), led by Essential Chemicals +220 and Electronics +168.
Stacked sales and operating income bars with segment driver tables on the right.
Sales +1,680億円 (+5.2%) and operating income +420億円 (+16.9%) above the May forecast: Healthcare +105, Homes -50 (slower North American recovery), Material +340 (Essential Chemicals +210, Electronics +123).
Stacked comparison bars with right-hand driver tables.
H2 operating income forecast at 1,246億円, down 409億円 (-24.7%) from H1's 1,654 on one-off and seasonal factors: Healthcare -202 (R&D up about 80億円, Hovilpri launch costs), Homes +81, Material Priority Growth +53, chemicals -342 (inventory effect about -200億円).
Waterfall from H1 to H2 forecast with two dotted driver boxes above and an orange arrow.
FY2026 annual dividend forecast ¥48 (+¥6, interim ¥24), total dividends 642億円, DOE 3.1% and payout 37.2%; the 400億円 buyback decided in November 2025 is complete and cancelled. Policy: judge returns from medium-term FCF, aim for progressive dividends at DOE around 3%, and consider buybacks flexibly.
Bar chart of dividends and buybacks (FY2020-FY2026) with DOE lines, a data table below, and a blue policy panel on the right.
Operating margin forecast 8.5% (from 4.7% in FY2022), operating income before goodwill amortization 3,280億円; ROIC 6.4% and ROE 8.3% forecast for FY2026.
Three blue-labeled commentary rows on top; bar-and-line chart of operating income and margin on the left, ROIC/ROE line chart on the right.
Section divider introducing segment-level details.
Full-width blue lower panel with white section title.
Healthcare sales 3,892億円 (+26.9%) and operating income 603億円 (+203, +50.5%): volume +181, price +48, FX +3, other -29 (including Aicuris consolidation -7). Pharma & Life Science OI 395, Critical Care 211.
Green waterfall chart of operating income drivers above a sales and operating income breakdown table.
Operating income 395億円 in H1 (448 before goodwill) and 522 forecast for the year (632 before goodwill, up from 444/574 initially). Growth from Envarsus XR, Tarpeyo and domestic drugs; Aicuris acquired April 2026; about 400億円 of in-licensing planned over the plan period; Planova growth and Bionova restructuring.
Bar-and-line operating income chart (top-left), driver table (top-right), initiatives panel and overseas pharma sales chart (bottom).
H1 FY2026 sales: Envarsus XR $199M (+18.9%), Tarpeyo $175M (+6.6%), Teribone 220億円, Kevzara 72億円, Cresemba 44億円 (+41.4%), Doptelet 18億円; product table lists generic names, classes, indications and dosage forms.
Two stacked tables: a sales table by product (US and Japan) and a product reference table.
Domestic pipeline includes TA799 (apraglutide, short bowel syndrome, Phase III), ART-123 and MN-10-T in Phase III and several AK-series compounds in Phase I/II; overseas, Hovilpri (pritelivir) is approved with launch planned within the year, ART-123 in Phase III for sepsis-associated coagulopathy, VEL-101 and AIC468 in Phase II.
Pipeline table grouped by domestic and overseas with phase, compound, indication, origin, developer and remarks columns.
Operating income 211億円 in H1 (307 before goodwill) and 488 forecast (678 before goodwill), driven by new defibrillators launched September 2025, LifeVest patient growth and sleep-apnea diagnostic devices. ACT sales $791M and CMS $535M in H1.
Bar-and-line chart, driver table, initiatives panel and ACT/CMS stacked bar chart.
Homes sales 5,628億円 (+6.9%) but operating income 441億円 (-24, -5.3%): order-built homes +12 on sales, margin -4, fixed costs -1, overseas -49 (North American demand and pricing), other +16.
Coral waterfall chart of drivers above a sales and operating income table for Homes and Construction Materials.
Domestic operating income 451億円 in H1 and 942 forecast (order-built 454, real estate development 109, rental management 216). Order intake trend: 3,939, 4,264, 4,305億円 for FY2023-25 and 4,478 (+4.0%) forecast for FY2026.
Stacked operating income bars, driver table, initiatives panel and order intake stacked bars.
Overseas Homes posted an H1 operating loss of 10億円 (2 before goodwill), with full-year forecast cut to 21億円 from 90 on slower North American recovery; Australia improved. H1 sales reached 1,619億円.
Bar-and-line operating income chart, driver table, initiatives panel and North America/Australia sales chart.
Material sales 7,245億円 (+13.6%) and operating income 720億円 (+410, +132.5%): volume +65, price +667, raw materials -603, FX +130, other +152. Electronics OI 229, Essential Chemicals 243, Performance Chemicals 161, Energy & Infrastructure -21.
Blue waterfall chart above a detailed sub-segment table with driver breakdown columns.
Electronics operating income 229億円 in H1 (24% margin) and 464 forecast for the year (up from 341), driven by AI demand for electronic materials such as Pimel and EV current sensors; camera-module IC volumes fell on smartphone memory shortages.
Bar-and-line chart, driver table, initiatives panel and indexed product sales line chart with CAGR box.
Car Interior operating income 60億円 in H1 (87 before goodwill) and 115 forecast (175 before goodwill), helped by European sales and a weaker yen; Sage Automotive Interiors sales grew at an 8% CAGR from FY2022 to FY2026.
Bar-and-line chart, driver table, initiatives panel and Sage sales bar chart with orange trend arrow.
Energy & Infrastructure posted an H1 operating loss of 21億円 and forecasts -15 for the year, after the lead-acid battery separator divestiture and higher fixed costs; Hipore sales are shifting toward ESS uses, and the Canada plant start is deferred by 1.5-2 years.
Bar-and-line chart, driver table, initiatives panel and Hipore volume/EBITDA combo chart.
H1 operating income: Comfort Life 98億円, Performance Chemicals 161 (13% margin), Essential Chemicals 243 (10%). Full-year forecasts raised to 184, 184 and 282 on pass-through pricing, restructuring benefits and inventory effects.
Three stacked rows, each with a bar-and-line chart on the left and a two-row driver table on the right.
Sales by segment and sub-segment for FY2025 and FY2026 (H1, H2 forecast, full year) with YoY and initial-forecast comparisons; FY2026 total forecast 34,220億円 vs. 30,745 in FY2025.
Large color-banded data table grouped by Healthcare, Homes and Material.
Operating income by segment and sub-segment; FY2026 forecast 2,900億円 with Healthcare 1,005, Homes 963, Material 1,150, Corporate/eliminations -247.
Large color-banded data table with H1/H2 and full-year columns.
Section divider introducing the appendix.
Full-width blue lower panel with white section title.
Reference chart listing each segment, sub-segment and main businesses, for example ACT and CMS (LifeVest) under Critical Care, Planova and CDMO under Life Science, and Saran Wrap under Comfort Life.
Three-column table with color-banded segment rows and white business tiles.
H1 sales of 16,896億円 with domestic share at 44.0% and the Americas rising to 23.8%, reflecting US M&A in Healthcare and Homes.
Five stacked 100%-style bars (H1 FY2022-FY2026) by region with dotted connectors and a right-hand legend.
Depreciation 881億円 in H1 (1,810 forecast), of which acquisition-related intangible amortization 283; goodwill amortization 190 in H1 and 380 forecast, mostly in Healthcare.
Segment-banded table split into depreciation and goodwill amortization column groups.
Capex 1,236億円 in H1 and 2,580 forecast for FY2026 (vs 2,110), led by Material; R&D 561億円 in H1 and 1,270 forecast (vs 1,105), with Healthcare license-in costs.
Two commentary bars on top; two stacked bar charts (capex and R&D) by segment.
Timeline of projects from FY2025: Planova spinning plant (FY2029), Bionova CDMO expansion, Pimel capacity in Fuji (FY2027), Sunfort slitting plant in Tainan (H1 FY2026), Hipore coating expansion (H1 FY2026), Canada Hipore line (FY2027, delayed), 2GW/yr electrolyzer plant in Kawasaki (FY2028).
Gantt-style table with project details on the left and colored arrow bars across half-year columns FY25-FY28.
Aicuris Anti-infective Cures AG (antiviral drug R&D) acquired for 1,443億円, consolidated from May 2026; goodwill not yet determined.
Single-row deal table with a green arrow on a half-year timeline.
Timeline of exits and divestitures: Sepacell exit (March 2027), diagnostics divestiture (July 2025), lead-acid separator transfer (December 2025), trading-function integration (October 2026), HMD end (April 2027), MMA/CHMA/acrylic resin/SB latex exits, and ethylene restructuring by FY2030.
Gantt-style table with segment and sub-segment labels and arrow bars across FY25-FY28.
Operating income by segment from FY2009 (576億円) to FY2026 forecast (2,900), with margin rising back to 8.5%; Homes and Healthcare have made profits more resilient as Material recovers from its FY2022 trough.
Stacked bar chart across 18 years with an operating margin line chart above.
Segment-profit note, next results date (Q3 FY2026 on February 4, 2027), Asahi Kasei Report 2026 release and the IR Prime Business Award 2025, plus a forward-looking statements disclaimer.
Note at top; blue calendar box on the left and two announcement images on the right; disclaimer at bottom.
Back cover with the Asahi Kasei logo and tagline.
Centered logo on white with a large ribbon swoosh across the bottom right.
このスライドと基礎となるプレゼンテーションコンテンツに関する一般的な質問。
The slides are in Japanese. This is Asahi Kasei's 決算説明資料 (financial results briefing material) for the second quarter of FY2026, released on November 5, 2026 and originally published on TDnet, the Tokyo Stock Exchange's Timely Disclosure network. The page descriptions here are in English and translate the slide titles and key numbers.
Asahi Kasei's fiscal year runs from April to March, so FY2026 (2026年度) is April 2026 to March 2027. The first half (上期) covered in this deck is April to September 2026.
Net sales were 1兆6,896億円 (about ¥1.69 trillion, +13.7%), operating income 1,654億円 (+54.0%), and net income attributable to owners of the parent 1,022億円 (+54.2%). All three came in above the July forecast.
The FY2026 operating income forecast was raised from 2,480億円 (May) to 2,900億円, a 25.4% rise on FY2025 and a third consecutive record. Net sales are forecast at 3兆4,220億円 and net income at 1,730億円. The annual dividend forecast is ¥48 per share, up ¥6.
億円 is the Japanese unit of ¥100 million. For example, 2,900億円 equals ¥290 billion. The summaries keep the company's own 億円 units so they match the slides.
The three Priority Growth businesses, Pharmaceuticals, Critical Care and Electronics, added 307億円 of operating income in H1. Electronics benefited from AI-related demand for Pimel and glass cloth, and Material also gained from price pass-through and inventory effects.
Yes. The deck is available as a PDF and as an editable PPTX, so you can reuse the table, waterfall chart and timeline layouts in your own presentations.
Company IR page referenced on the deck's cover for the Financial Factbook and briefing materials.

Create Your Own Slides
Turn your ideas into professional presentations in seconds with 2slides AI.
プロフェッショナルなデザインを参照し、スタイルを選択し、完璧なテキストレンダリングでスライドを生成。Nano Banana搭載—今すぐプレゼンテーションの作成を始めましょう。
© 2026 2slides。全著作権所有。


