
The New Rules of Platform Strategy in the Age of Agentic AI
クイックナビゲーション
タグ
スライドを共有
The New Rules of Platform Strategy in the Age of Agentic AI
レイアウト、主要コンテンツ、視覚要素を含む各スライドページの詳細ビュー。
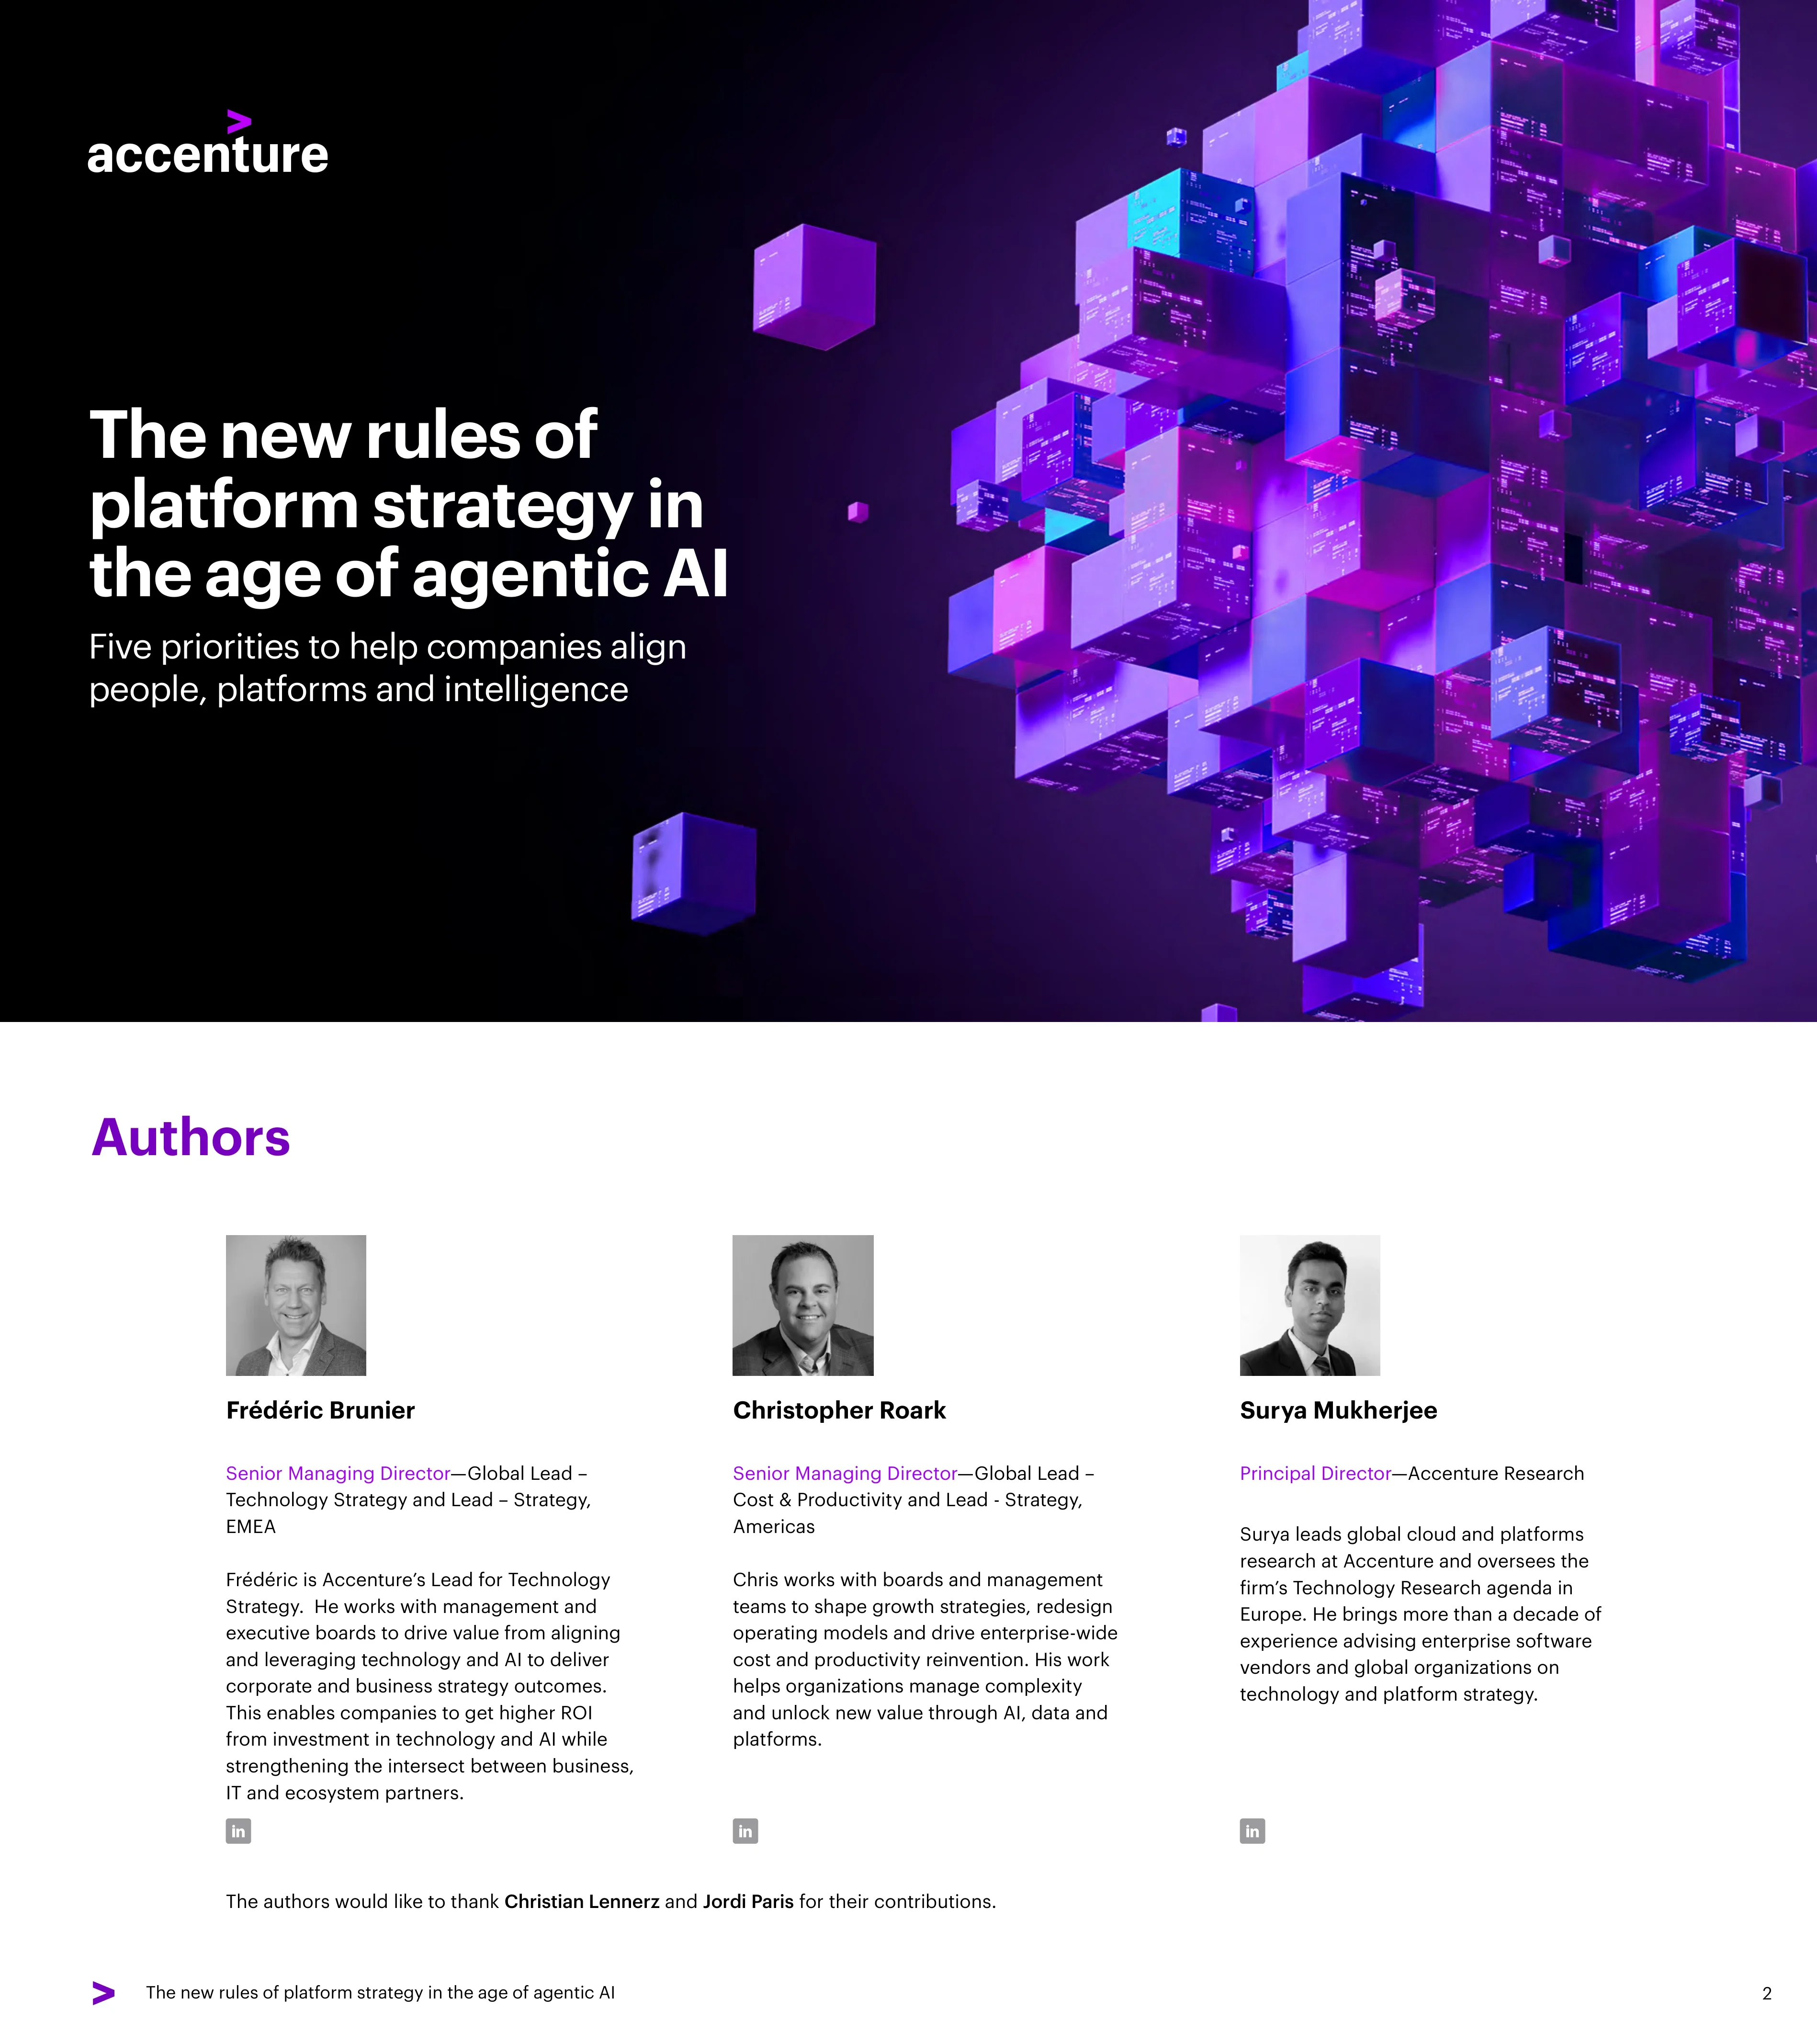
Title slide featuring the report name and subtitle: Five priorities to help companies align people, platforms and intelligence. Accenture branding.
Full-bleed dark background with 3D geometric cube visuals in purple/blue tones, white title text left-aligned
Profiles of three authors: Frederic Brunier (Senior Managing Director, Global Lead - Technology Strategy), Christopher Roark (Senior Managing Director, Global Lead - Cost & Productivity), and Surya Mukherjee (Principal Director, Accenture Research).
Three-column layout with headshots, names, titles, and brief bios. LinkedIn icons below each profile.
Overview of the report: enterprise platforms need reinvention for the AI age. Five priorities: Architect for the future, Design a fit-for-purpose foundation, Articulate the interplay, Prepare for operating model reinvention, Transform culture.
Three-column text layout with geometric line art on the right side
Table of contents listing all major sections with page numbers, from The case for platform reinvention through About the research.
Single-column table of contents with section titles and page numbers, clean minimal design
AI has captured executive attention but enterprise traction lags. Core systems remain fragmented. Key platform vendors listed: Adobe, Oracle, Salesforce, SAP, ServiceNow, Workday. Nearly 1 in 5 believe platforms will not survive the AI onslaught.
Three-column text layout with vendor callout boxes in the center column
Companies that align strategies achieve 13% revenue growth (2x peers) and 37% increase in operating profit (~$1B for average enterprise). Key terms defined: Platforms, Embedded AI, Agentic AI.
Split layout - left column with large statistics, right column with key term definitions on gray background
Platform reinvention involves two shifts: technological (embedding AI into platforms) and organizational (rethinking workflows). Two forces making this unavoidable: AI transforming work, and business expectations outpacing platforms.
Three-column layout with wireframe cube art on left, text center, and photo on right
Generative and agentic AI is redefining work. AI agents can now perform tasks requiring human judgment. Quote: AI agents aren't just supercharging existing applications - they're creating new ones.
Two-column text with large quote callout and technology photo
Lenovo used Adobe Experience Platform and Microsoft Copilot to orchestrate AI across marketing and customer service, delivering $11M in efficiency savings and 12.5% boost in click-through rates.
Purple left border case study layout with title, body text, and photo on right
94% of executives say agentic AI requires rethinking platform strategies. 74% of organizations focus on productivity as main platform goal. Figure 1 survey chart showing 57% believe significant change or complete reinvention needed.
Two-column with text left, horizontal bar chart right
The answer is evolution, not replacement. Platforms must host embedded intelligence and work with AI agents. The future belongs to those who balance humans, platforms, and agents.
Half-page wireframe cube art left, text right with purple highlighted conclusion statement
Enterprise platforms entering new chapter. Vendor AI initiatives: Adobe (Experience Platform Agent Orchestrator), Microsoft (Copilot, AutoGen), Oracle (AI4Data), Salesforce (Agentforce), SAP (Joule), ServiceNow (Workflow Data Fabric), Workday (Agent System of Record).
Two-column with introductory text left, vendor descriptions right with purple left-border callouts
66% of organizations rely primarily on platform-native AI capabilities, while 32% build platform-agnostic agents spanning multiple systems. Figure 2 horizontal bar chart.
Two-column with analysis text left, horizontal bar chart right
Only 18% of companies have fully aligned AI, platform, and business strategies. Just 17% have embedded AI deeply into core processes. More than 50% remain trapped in narrow pilots.
Three-column layout with large purple percentage statistics (18%, 17%, 50%) in the center
Companies with aligned platform strategies achieve 2.2x higher revenue growth. Figure 3 bar chart comparing average company (6%), business-aligned (10%), and AI-aligned (13%) revenue growth.
Two-column with analysis text left, vertical bar chart right
Five numbered priorities introduced: 1. Architect for the future, 2. Design a fit-for-purpose foundation, 3. Articulate the interplay, 4. Prepare for operating model reinvention, 5. Transform culture.
Dark background with large white numbers 1-5 and purple text descriptions, purple geometric overlay at top
57% of leaders cite integration with existing systems as top risk. Need to treat AI as a system, not a feature. Introduces concept of agentic enterprise architecture.
Two-column text with 3D purple cube art on right side
Zurich launched AI-powered CRM (ZCAM) integrating customer and policy data with Outlook and Salesforce. Three-click rule for instant access. Reduces service times by over 70%.
Purple left border case study with title, text, and large photo
Three-tier agent hierarchy: Utility Agents (execute basic tasks), Super Agents (coordinate work), Orchestrator Agents (govern the system). Architecture includes reasoning engines, orchestration logic, and management tools.
Two-column with text left and concept definitions right on gray background panel
Visual diagram showing how Utility Agents, Super Agents, and Orchestrator Agents interact in a hierarchical tree structure. Example of financial close process reinvention.
Two-column with explanatory text left, organizational diagram right with purple boxes and arrows
Nearly six in 10 organizations are already planning structural adjustments to accommodate AI. The shift is crucial to ensure seamless integration and effective use of AI.
Centered text with geometric wireframe cube illustrations top and bottom on dark background
Before agents can scale, the digital core must be ready. Questions about modularity, real-time data, and governance. Quote about reducing ERP implementation from 6-7 years to under one using AI.
Two-column with text left, large purple quote callout center, 3D voxel art right
Only 31% have formal platform strategy. 38% informal/piecemeal. 28% have concrete plans. Only 3% have no plans at all. Modernization starts with readiness assessment.
Two-column with analysis text left, horizontal bar chart right
Mascoma Bank consolidated 66 fragmented systems onto Salesforce Data Cloud. Onboarding fell from 45 minutes to minutes. PPP loan volumes processed in 13 days. Call center hold times dropped 98%.
Purple left border case study with text left, photo and results callout right
Challenge of defining who does what between platforms, agents, and humans. Questions about workflows, decisions, transactions. Need to map responsibilities explicitly.
Two-column with text and bold questions left, 3D purple cube cascade art right
Western Sugar transformed finance operations using SAP Ariba and SAP S/4HANA. Processes 40,000 invoices annually with no human intervention until approval. 25% faster processing.
Purple left border case study with text left, photo and results callout right
Figure 6: Venn diagram showing overlapping roles. Platform+Agent = AI-triggered workflows. Human+Agents = Human-in-loop decisions. Human+Platform = Audit/compliance. Center = Adaptive enterprise processes.
Two-column with explanatory text left, three-circle Venn diagram right
Table showing Platforms (routine, rules-driven work), Humans (judgment, strategy, relationships), and Agents (proactive, adaptive, cross-functional) with examples for each.
Three-column with analysis text left, role comparison table right
Stacked bar chart showing agent vs platform vs human work distribution across IT, Customer Service, Finance, Operations, Marketing, Sales, HR, and Legal. In legal, 63% remains human-only.
Two-column with analysis text left, horizontal stacked bar chart right
Rethink operating models, work structures, and roles. Recruiting example: AI agents pre-screen, rank applicants. Finance: agents reconcile accounts. ERP evolving through three stages: accelerate, assist, transform.
Two-column with text and purple quote callout left, 3D purple/blue cube art right
Adecco: Salesforce Agentforce handles 24/7 candidate engagement, 300M+ resumes/year. US AutoForce: Microsoft Dynamics 365 cut reconciliation time 80%, saving 30+ hours/month.
Purple left border case study, two mini case studies side by side, photo and quote on right
Stacked bar chart showing No impact, Supplement, Augment, Transform across Finance, Strategy, HR, Risk, Product, Marketing, IT, Sales. Finance leads with 15% no impact, Sales leads augmentation at 50%.
Two-column with text left, horizontal stacked bar chart right
Organization structure shifting from pyramid to diamond shape. Product and innovation at 48%. 34% expect transformational IT impact. Operating models becoming more fluid with cross-functional teaming.
Three-column text layout with detailed analysis and purple highlighted statistics
Figure 9: 2x2 matrix with Value Potential (vertical) and Differentiation Potential (horizontal). Four quadrants: Execute on platforms to industry standard, Execute amplified by AI, Move to ecosystem partner, Reimagine with agentic AI.
Two-column with explanatory text left, 2x2 matrix diagram right
64% cite employee resistance as biggest barrier. But real barriers: insufficient training (51%) and limited budgets (47%). Nearly 3/4 of companies paused AI projects in 2024 due to risk concerns.
Three-column with text, analysis, and quote with 3D cube art on right
People need analytical reasoning, fluency with AI tools, and situational judgment. New roles emerging: trainers, explainers, sustainers. Responsible AI builds trust and drives 25% increase in customer loyalty.
Three-column dense text with bold highlighted terms and purple quote
Action table with First Step and Follow Up Action for each priority: Architect (map AI gaps), Design (platform readiness scan), Articulate (define roles), Prepare (Impact Map), Transform (AI fluency sprint).
Three-column table on dark background with priority names, first steps, and follow-up actions
Accenture Marketing + Communications team redesigned 2,000+ roles for human-AI collaboration. Campaign steps cut from 135 to 85, campaigns to market 25-35% faster.
Purple left border case study with text left, large team collaboration photo right
Enterprise platforms entering new phase where value comes from adapting quickly and embedding intelligence. Focus must shift from preservation to preparation. Quote: This is a hybrid model. Platforms won't disappear. But their role will change.
Two-column with purple highlighted intro text left, body text center, and large purple quote right
Survey of 1,031 C-suite executives across 12 countries and 10 industries. Figure 10: Geographic and industry composition charts. Companies range from mid-sized to Fortune 500.
Two-column with methodology text left, dual horizontal bar charts right (country and industry)
20 structured interviews with platform vendor leaders. ANCOVA statistical analysis using S&P Capital IQ data. Binary predictor from survey. Controls for baseline performance, industry, and region.
Three-column with interview methodology, model specification, and interpretation
332 intermediate-level tasks evaluated across four criteria: language-intensive, interpersonal, proactive, human sign-off. O*NET Online taxonomy used. Three categories: Platform tasks, Agentic tasks, Human-only tasks.
Three-column with task classification criteria, mapping methodology, and aggregation approach
11 endnote references including sources from Adobe, Salesforce, SAP, Microsoft, Accenture research publications from 2024-2025.
Three-column reference list with numbered citations
Acknowledgements to contributors. About Accenture Strategy and Accenture Research descriptions. Copyright notice and disclaimer.
Four-section layout with acknowledgements, two About sections, and legal disclaimer on dark background
このスライドと基礎となるプレゼンテーションコンテンツに関する一般的な質問。
This is a research report by Accenture titled 'The New Rules of Platform Strategy in the Age of Agentic AI.' It presents findings from a global survey of 1,031 C-suite executives across 12 countries and 10 industries, providing five strategic priorities for aligning enterprise platforms with agentic AI capabilities.
The five priorities are: 1) Architect for the future - build AI-ready, platform-aware infrastructure; 2) Design a fit-for-purpose foundation - modernize the digital core; 3) Articulate the interplay - clarify platform, human, and agent roles; 4) Prepare for operating model reinvention - reimagine how the enterprise operates; 5) Transform culture - empower people, build trust, and evolve how work gets done.
According to the research, companies that align their AI, business, and platform strategies achieve 2.2x higher revenue growth and up to 37% increase in operating profit compared to their peers, equivalent to roughly $1 billion in pre-tax earnings for the average enterprise.
The Platform Agent Hierarchy is a three-tier framework for enterprise AI deployment: Utility Agents execute basic tasks autonomously within systems, Super Agents coordinate work by understanding user intention and mobilizing utility agents, and Orchestrator Agents govern the overall system by assigning tasks and coordinating across multiple super agents.
The report includes six case studies: Lenovo (scaling AI engagement with Adobe and Microsoft), Zurich Insurance (AI-ready CRM architecture), Mascoma Bank (consolidating 66 systems onto Salesforce), Western Sugar (AI-powered finance automation with SAP), Adecco and US AutoForce (redesigning recruitment and finance with AI), and Accenture M+C (redesigning 2,000+ roles for human-AI collaboration).
The presentation contains 44 slides with a premium Accenture design aesthetic featuring dark backgrounds, purple and blue accent colors, 3D geometric cube illustrations, professional photography, data visualizations with charts and diagrams, and clean typography. It alternates between analytical content slides, data visualization slides, and case study layouts.
This presentation serves as an excellent reference template for enterprise AI and platform strategy presentations. Its structure - combining executive summary, data-driven analysis, strategic frameworks (like the Venn diagram and Impact Map), case studies, and actionable recommendations - provides a proven format for board-level and C-suite strategy decks.
The research used three methods: a global executive survey of 1,031 C-suite executives across 12 countries and 10 industries, 20 structured interviews with senior leaders from major platform vendors (Adobe, Oracle, Salesforce, SAP, ServiceNow, Workday), and statistical analysis using ANCOVA with S&P Capital IQ financial data covering 602 public companies.

Create Your Own Slides
Turn your ideas into professional presentations in seconds with 2slides AI.
プロフェッショナルなデザインを参照し、スタイルを選択し、完璧なテキストレンダリングでスライドを生成。Nano Banana搭載—今すぐプレゼンテーションの作成を始めましょう。
© 2026 2slides。全著作権所有。



