
Fa parte di Esempi di presentazioni per investitori
Palantir Q3 2026 Business Update — the 34-slide quarterly earnings deck Palantir Technologies released on November 2, 2026 alongside its third-quarter 2026 results. It covers Q3 2026 highlights, Sovereign AI and AIP customer stories (NVIDIA, McCarthy, L3Harris, Tampa General Hospital, the US Army TITAN program, Hexion, the FAA, AIP Evolve), the full set of financial charts, Q4 and FY 2026 guidance, and the non-GAAP reconciliation appendix.
Usa la copertina di questa presentazione come riferimento di stile per slide create con i tuoi contenuti. Oppure scegli una pagina qui sotto per usarne il layout come riferimento.
Navigazione Rapida
Tag
Condividi le slide
Palantir Q3 2026 Business Update — the 34-slide quarterly earnings deck Palantir Technologies released on November 2, 2026 alongside its third-quarter 2026 results. It covers Q3 2026 highlights, Sovereign AI and AIP customer stories (NVIDIA, McCarthy, L3Harris, Tampa General Hospital, the US Army TITAN program, Hexion, the FAA, AIP Evolve), the full set of financial charts, Q4 and FY 2026 guidance, and the non-GAAP reconciliation appendix.
Vista dettagliata di ogni pagina di slide, inclusi layout, contenuto chiave ed elementi visivi.
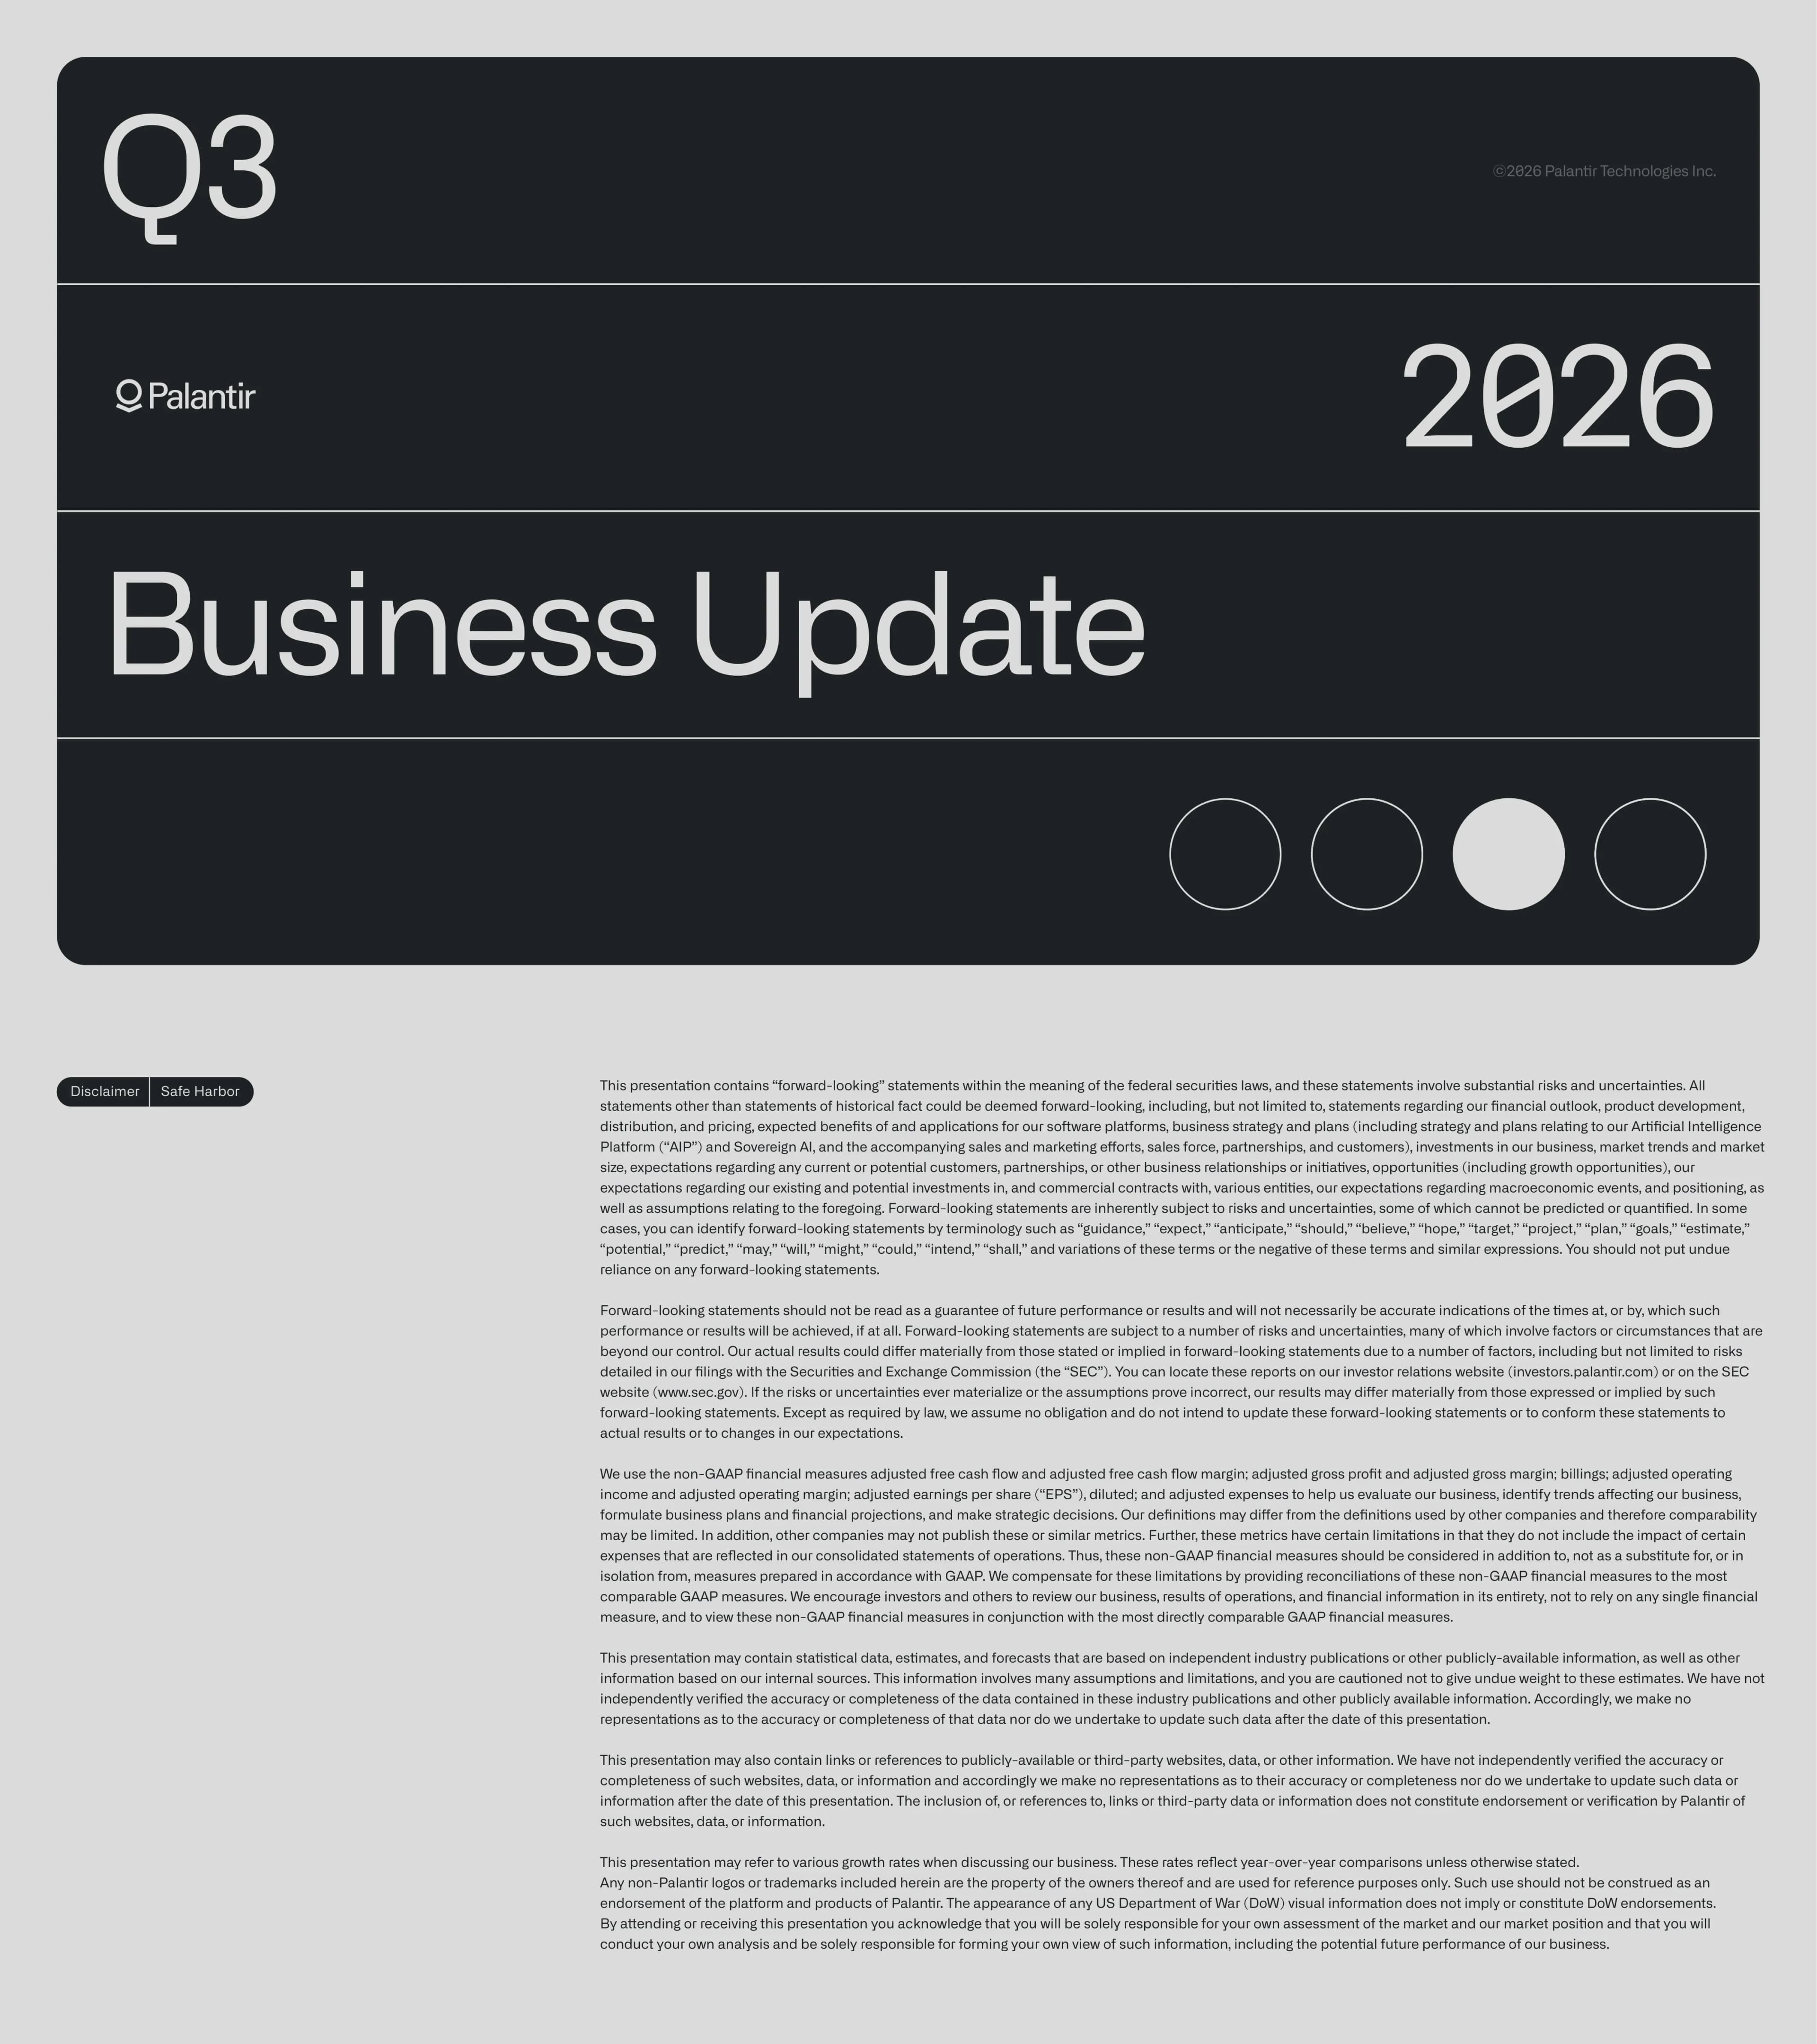
Cover slide reading 'Q3 2026 Business Update' with the Palantir wordmark and a ©2026 Palantir Technologies Inc. notice.
Rounded dark card on a light grey background, split into four horizontal bands: 'Q3' at top left, Palantir logo with a large monospaced '2026' on the right, 'Business Update' as the main title, and a row of four circles with the third one filled.
Forward-looking statements notice: statements about financial outlook, AIP and Sovereign AI, customers and partnerships are subject to risks described in SEC filings; lists the non-GAAP measures used (adjusted free cash flow and margin, adjusted gross profit and margin, billings, adjusted operating income and margin, adjusted diluted EPS, adjusted expenses), says growth rates are year-over-year unless stated, and notes that US Department of War (DoW) visuals do not imply DoW endorsement.
Pill label 'Disclaimer | Safe Harbor' at top left; dense legal text in several paragraphs filling the right two-thirds of the slide.
Scatter plot of Y/Y revenue growth against adjusted operating margin (most recent quarter) for the 100 largest companies by market cap, with Rule of 120 and Rule of 160 frontier lines; Palantir is highlighted at a Rule of 40 score of 158%, above Broadcom (147%), Taiwan's 2330 (110%), ASML (100%) and APH (95%); companies with growth above 100% (SPCX 188%, Samsung 182%, NVDA 174%, SK hynix 408%, MU 461%, CXMT 699%) are pinned at the top edge. Source: S&P Capital IQ as of November 1, 2026; a few overlapping labels at the bottom of the cluster are not legible.
Title and source footnotes on the left third; large dark rounded chart panel on the right with labelled dots, dashed diagonal frontier lines and triangle markers at the plot boundary.
Eleven headline results: US revenue +119% Y/Y and +23% Q/Q to $1.94 billion; US commercial revenue +148% Y/Y and +29% Q/Q to $984 million; US government revenue +96% Y/Y and +18% Q/Q to $953 million; US commercial passed US government revenue for the first time; total revenue +96% Y/Y and +20% Q/Q to $2.31 billion; net dollar retention 165% (+8 points Q/Q); 212 deals of at least $1 million, 107 of at least $5 million and 64 of at least $10 million; Rule of 40 score 158%; adjusted free cash flow $1.22 billion (53% margin); adjusted operating income $1.43 billion (62% margin); GAAP and adjusted EPS of $0.44.
Title at top left; eleven full-width dark rounded bars stacked vertically, each starting with an arrow and with growth rates underlined; footnote text defining deal value, adjusted metrics and net dollar retention at the bottom.
NVIDIA case study: NVIDIA trains open models on its own supply-chain data, spanning millions of parts and thousands of suppliers, inside Palantir's Ontology; Jensen Huang quote on combining NVIDIA Nemotron models with Palantir's Ontology to 'orchestrate the journey from wafer to token'.
Dark slide; headline, body copy and a pull quote with attribution on the left half; Palantir | NVIDIA logo lockup and a 'Learn More' link at the bottom left; full-height photo of green-lit data-center server racks on the right.
Three customer results from fine-tuned open models: McCarthy beats frontier models at a fraction of the cost and will save 30,000 drafting hours a year; L3Harris's sovereign model beat the frontier model and cut costs by 95% in preliminary results; Tampa General Hospital improved performance by 7% and cut latency by 22x. A chart for McCarthy RFI classification plots balanced accuracy against cost per 1M tokens: fine-tuned Nemotron 3 Nano 4B reaches about 73% at roughly $0.1, against about 54% untuned, with Claude Sonnet 5.5, GPT-6 Astra and GPT-6 Luna as frontier comparisons.
Dark left half with headline, subhead and three logo-plus-result rows separated by thin rules; light-blue panel on the right holding a dark chart card with a log-scale cost axis.
The US Army awarded Palantir a prime agreement to produce eight TITAN systems, its next-generation AI-enabled ground station, shaped by soldiers at every stage to turn sensor data from space to ground into actionable targeting.
Dark slide; headline and body text on the left, Palantir | TITAN logo lockup and 'Learn More' link at the bottom left; night photo of a TITAN military truck with green laser lines on the right.
Hexion and Palantir are rebuilding a 170-year-old chemical company around a single Ontology, with AI agents that turn customer signals into coordinated action; quote from Hexion President & CEO Michael Lefenfeld on propagating decisions from sensing demand to buying and pricing across one connected value chain.
Dark slide; headline, description and pull quote on the left; play button, Palantir | Hexion logos and a 'Watch the Video' link at the bottom; photo of chemical distillation towers on the right.
The FAA is using AIP to unify siloed safety systems into one national picture of risk, surfacing emerging issues before they become incidents; quote from Nick Fuller of FAA Aviation Safety Management saying that replicating the work without Palantir would take hundreds of analysts.
Dark slide; headline, description and pull quote on the left; play icon and 'Watch the Video' link at the bottom left; photo of an air traffic control tower with a US flag at dusk on the right.
Introduces AIP Evolve, which pairs each ontologized workflow with its Pareto-optimal solution, optimizing models for the customer's chosen trade-off between speed, cost and accuracy; the tagline reads 'Change the model. Change the prompt. Change the logic. Own the system.'
Dark slide; headline and body text on the left with a 'Watch the Video' link; product title card on the right with a large light-blue 'AIP Evolve' wordmark over a blue streak texture.
Section divider opening the Financials section of the Q3 2026 deck.
Same banded dark card as the cover, with 'Financials' as the main title, the Palantir logo, '2026', and the four-circle marker with the third circle filled.
US commercial revenue over eight quarters: $214M (Q4 2024, 64% Y/Y), $255M (Q1 2025, 71%), $306M (Q2 2025, 93%), $397M (Q3 2025, 121%), $507M (Q4 2025, 137%), $595M (Q1 2026, 133%), $764M (Q2 2026, 149%) and $984M (Q3 2026, 148%); Q/Q growth was 20%, 19%, 20%, 29%, 28%, 18%, 28% and 29%.
Headline at top; wide dark chart panel with outlined bars (the latest bar filled with a white gradient), a Y/Y growth line on a secondary axis, and a row of dashed Q/Q growth pills under the quarter labels.
GAAP net income by quarter: $476M (Q3 2025), $609M (Q4 2025), $871M (Q1 2026), $1.06B (Q2 2026) and $1.13B (Q3 2026).
Statement headline on the left of a light grey slide; dark rounded line-chart panel on the right with labelled data points.
GAAP operating income by quarter: $393M (Q3 2025), $575M (Q4 2025), $754M (Q1 2026), $912M (Q2 2026) and $1.08B (Q3 2026).
Statement headline on the left; dark line-chart panel on the right, matching the previous slide.
Rule of 40 score over eight quarters: 81% (Q4 2024), 83% (Q1 2025), 94% (Q2 2025), 114% (Q3 2025), 127% (Q4 2025), 145% (Q1 2026), 155% (Q2 2026) and 158% (Q3 2026), with the latest point circled in green.
Full-width dark chart panel with a single rising line, percentage labels above each point and quarter labels along the x-axis.
US revenue rose from $883M in Q3 2025 to $1.94B in Q3 2026 (+119% Y/Y), driven by acceleration in both US commercial and US government.
Statement headline on the left; dark panel on the right with two bars (outlined prior year, gradient-filled current year) joined by a dotted line labelled with the growth rate.
US commercial revenue grew from $397M to $984M (+148% Y/Y) and US government revenue from $486M to $953M (+96% Y/Y), comparing Q3 2025 with Q3 2026.
Two side-by-side dark chart cards, each with a two-bar Y/Y comparison and a dotted growth connector.
Total commercial revenue grew from $548M to $1.17B (+113% Y/Y) and total government revenue from $633M to $1.15B (+81% Y/Y), comparing Q3 2025 with Q3 2026.
Two side-by-side dark chart cards with two-bar Y/Y comparisons, mirroring the previous slide.
Total revenue rose from $1.18B in Q3 2025 to $2.31B in Q3 2026 (+96% Y/Y), driven by continued acceleration of the US business.
Statement headline on the left; dark two-bar chart panel on the right.
Adjusted operating income and margin by quarter: $601M at 51% (Q3 2025), $798M at 57% (Q4 2025), $984M at 60% (Q1 2026), $1.19B at 62% (Q2 2026) and $1.43B at 62% (Q3 2026); the message is continued heavy investment in AIP and the US alongside operating leverage at scale.
Statement on the left; dark bar-chart panel on the right with its own headline, value labels and small margin labels above each bar.
US commercial customer count on a trailing-twelve-month basis: 530 (Sep 30, 2025), 571 (+8%), 615 (+8%), 653 (+6%) and 686 (Sep 30, 2026, +5%), up 29% Y/Y; a customer is an organization from which revenue was recognized during the TTM period.
Full-width dark chart card with five bars, dotted Q/Q growth connectors and a dashed bracket across the top showing the Y/Y change.
Total customers (TTM): 911, 954, 1,007, 1,049 and 1,090, up 20% Y/Y; commercial customers: 742, 780, 832, 870 and 904, up 22% Y/Y, from Sep 30, 2025 to Sep 30, 2026, with Q/Q gains of 4–7%.
Two side-by-side dark chart cards, each with five bars, Q/Q growth labels and a Y/Y bracket.
Deal count for the quarter: 212 deals of at least $1 million, of which 107 were at least $5 million and 64 at least $10 million.
Very large '212 deals' type on the upper half of a light slide; two dark cards below with big numerals (107 and 64) and dot grids showing the count.
$10.4B in cash, cash equivalents and US Treasury securities with no debt; cash from operations rose from $508M (43% margin) to $1.20B (52% margin) and adjusted free cash flow from $540M (46% margin) to $1.22B (53% margin), Q3 2025 versus Q3 2026.
Large '$10.4B' statement on the left; dark panel on the right with two pairs of Y/Y bars separated by a dashed divider and labelled with margins.
Q4 2026 guidance: revenue of $2.649–$2.653 billion and adjusted income from operations of $1.640–$1.644 billion. FY 2026 guidance: revenue of $8.530–$8.534 billion; US commercial revenue above $3.559 billion (at least 143% growth); adjusted income from operations of $5.245–$5.249 billion; adjusted free cash flow of $4.8–$5.0 billion; and GAAP operating income and net income in each quarter of the year.
Two tall dark cards side by side (Q4 2026 and FY 2026), each with arrow bullets and large figures.
Section divider opening the appendix of non-GAAP reconciliations and additional metrics.
Banded dark card matching the cover and Financials divider, with 'Appendix' as the main title.
Remaining performance obligations ($ billions), Q3 2025 to Q3 2026: total RPO $2.60, $4.08, $4.45, $4.90 and $4.88 (short-term 1.14, 1.54, 1.75, 2.09, 2.14; long-term 1.46, 2.54, 2.70, 2.81, 2.74). Billings: $1.23, $1.49, $1.75, $2.07 and $2.45 billion. Net dollar retention was 165% in Q3 2026. A footnote defines RPO under ASC 606.
Three stacked dark rounded tables (RPO, billings, net dollar retention note) with quarter columns.
Y/Y revenue growth (36%, 39%, 48%, 63%, 70%, 85%, 93%, 96%) plus adjusted operating margin (45%, 44%, 46%, 51%, 57%, 60%, 62%, 62%) equals the Rule of 40 score (81%, 83%, 94%, 114%, 127%, 145%, 155%, 158%) for Q4 2024 through Q3 2026.
Single dark table with eight quarter columns, two input rows, a divider line and a result row.
In $ thousands: cash flow from operating activities of $507,664 (Q3 2025) and $1,204,570 (Q3 2026), plus employer payroll taxes on stock-based compensation (38,990; 19,521), less purchases of property and equipment (6,792; 8,014), gives adjusted free cash flow of $539,862 and $1,216,077, or margins of 46% and 53%.
Title and subtitle on top; dark table with two period columns and Add/Less sections.
In $ thousands for Q3 2026: gross profit of $1,930,125 plus stock-based compensation of 37,892 gives adjusted gross profit of $1,968,017, an adjusted gross margin of 85%.
Title with two subtitle lines; single-column dark reconciliation table.
In $ thousands, Q3 2025 to Q3 2026: income from operations of $393,256, $575,394, $753,998, $912,004 and $1,084,845, plus stock-based compensation (172,318; 196,405; 201,592; 265,209; 318,889) and related employer payroll taxes (34,966; 26,666; 27,955; 17,259; 23,106), gives adjusted operating income of $600,540, $798,465, $983,545, $1,194,472 and $1,426,840, with margins of 51%, 57%, 60%, 62% and 62%.
Dark table with five quarter columns, an Add section and result rows.
In $ thousands for Q3 2026: net income attributable to common stockholders of $1,128,012, plus stock-based compensation of 318,889 and employer payroll taxes of 23,106, less income tax effects and adjustments of 327,660, gives adjusted net income of $1,142,347; with 2,573,926 thousand weighted-average diluted shares, adjusted diluted EPS is $0.44. The tax effect uses an estimated long-term annual effective tax rate of 23.0%.
Dark table with a single Q3 2026 column, double-ruled result rows and a footnote at the bottom.
In $ thousands, Q3 2025 to Q3 2026: revenue of $1,181,092, $1,406,802, $1,632,583, $1,935,464 and $2,313,411, plus change in contract liabilities (44,456; 81,900; 117,027; 136,481; 140,985), gives billings of $1,225,548, $1,488,702, $1,749,610, $2,071,945 and $2,454,396.
Dark table with five quarter columns, two input rows and a billings result row.
In $ thousands for Q3 2025, Q2 2026 and Q3 2026: total expenses of $787,836, $1,023,460 and $1,228,566, less stock-based compensation (172,318; 265,209; 318,889) and related employer payroll taxes (34,966; 17,259; 23,106), give adjusted expenses of $580,552, $740,992 and $886,571.
Dark table with three period columns, a Less section and an adjusted-expenses result row.
Domande comuni su questa slide e il contenuto della presentazione sottostante.
It is the 34-slide investor presentation Palantir Technologies released on November 2, 2026 with its third-quarter 2026 earnings. Palantir calls its quarterly earnings deck a 'Business Update'. It covers Q3 highlights, AIP and Sovereign AI customer stories, financial charts, Q4 and FY 2026 guidance, and non-GAAP reconciliations.
Revenue was $2.31 billion, up 96% Y/Y and 20% Q/Q. US revenue was $1.94 billion (+119% Y/Y) and US commercial revenue was $984 million (+148% Y/Y), passing US government revenue ($953 million) for the first time. Adjusted operating income was $1.43 billion (62% margin), adjusted free cash flow was $1.22 billion (53% margin), and GAAP and adjusted EPS were both $0.44.
For Q4 2026, Palantir guided to revenue of $2.649–$2.653 billion and adjusted income from operations of $1.640–$1.644 billion. For FY 2026 it expects revenue of $8.530–$8.534 billion, US commercial revenue above $3.559 billion (at least 143% growth), adjusted operating income of $5.245–$5.249 billion and adjusted free cash flow of $4.8–$5.0 billion.
The score was 158%: 96% Y/Y revenue growth plus a 62% adjusted operating margin. The appendix reconciliation shows it rising every quarter from 81% in Q4 2024. Slide 3 compares it with the top 100 companies by market cap using S&P Capital IQ data as of November 1, 2026.
Yes. It is Palantir's own presentation, published on its investor relations site (investors.palantir.com) with the Q3 2026 earnings release. Palantir is a US-registered company and files its quarterly results with the SEC. The PDF here is the original file, shown page by page.
Yes. The original PDF is available free on this page, and every slide is shown as an image with a written summary of its content and layout.
Its structure works well as a model: banded section dividers, a highlights page of stacked bars, two-bar Y/Y growth charts, customer case-study pages with photos and pull quotes, a two-column guidance page and reconciliation tables. Rebuild the layout with your own data and branding rather than reusing Palantir's logos, photos or trademarks.
It features NVIDIA's supply chain on Palantir's Ontology, fine-tuned open models at McCarthy, L3Harris and Tampa General Hospital, the US Army's TITAN ground station moving into production of eight systems, Hexion's chemical manufacturing transformation, the FAA's aviation-safety work on AIP, and the launch of AIP Evolve.
The original deck as published on Palantir's investor relations site.
Earnings releases, SEC filings and quarterly business updates.

Create Your Own Slides
Turn your ideas into professional presentations in seconds with 2slides AI.
Fai riferimento a design professionali, scegli il tuo stile e genera slide con rendering del testo perfetto. Alimentato da Nano Banana—inizia a creare la tua presentazione ora.
Il Tuo Agente IA per le slide. Risparmia tempo, brilla più velocemente con la creazione intelligente di presentazioni.


© 2026 2slides. Tutti i diritti riservati.