
Fa parte di Esempi di presentazioni per investitori · Esempi di presentazioni agli investitori giapponesi
Odakyu Electric Railway H1 FY2026 Earnings Presentation. This is the Japanese-language interim results briefing (2027年3月期 第2四半期(中間期)決算説明資料) released on TDnet, the Tokyo Stock Exchange timely-disclosure service, on 11 November 2026. The fiscal year runs April 2026 to March 2027 (FY2026); the deck covers the first half (April-September 2026) and raises the full-year operating profit forecast to ¥55,000 million (百万円).
Usa la copertina di questa presentazione come riferimento di stile per slide create con i tuoi contenuti. Oppure scegli una pagina qui sotto per usarne il layout come riferimento.
Navigazione Rapida
Tag
Condividi le slide
Odakyu Electric Railway H1 FY2026 Earnings Presentation. This is the Japanese-language interim results briefing (2027年3月期 第2四半期(中間期)決算説明資料) released on TDnet, the Tokyo Stock Exchange timely-disclosure service, on 11 November 2026. The fiscal year runs April 2026 to March 2027 (FY2026); the deck covers the first half (April-September 2026) and raises the full-year operating profit forecast to ¥55,000 million (百万円).
Vista dettagliata di ogni pagina di slide, inclusi layout, contenuto chiave ed elementi visivi.
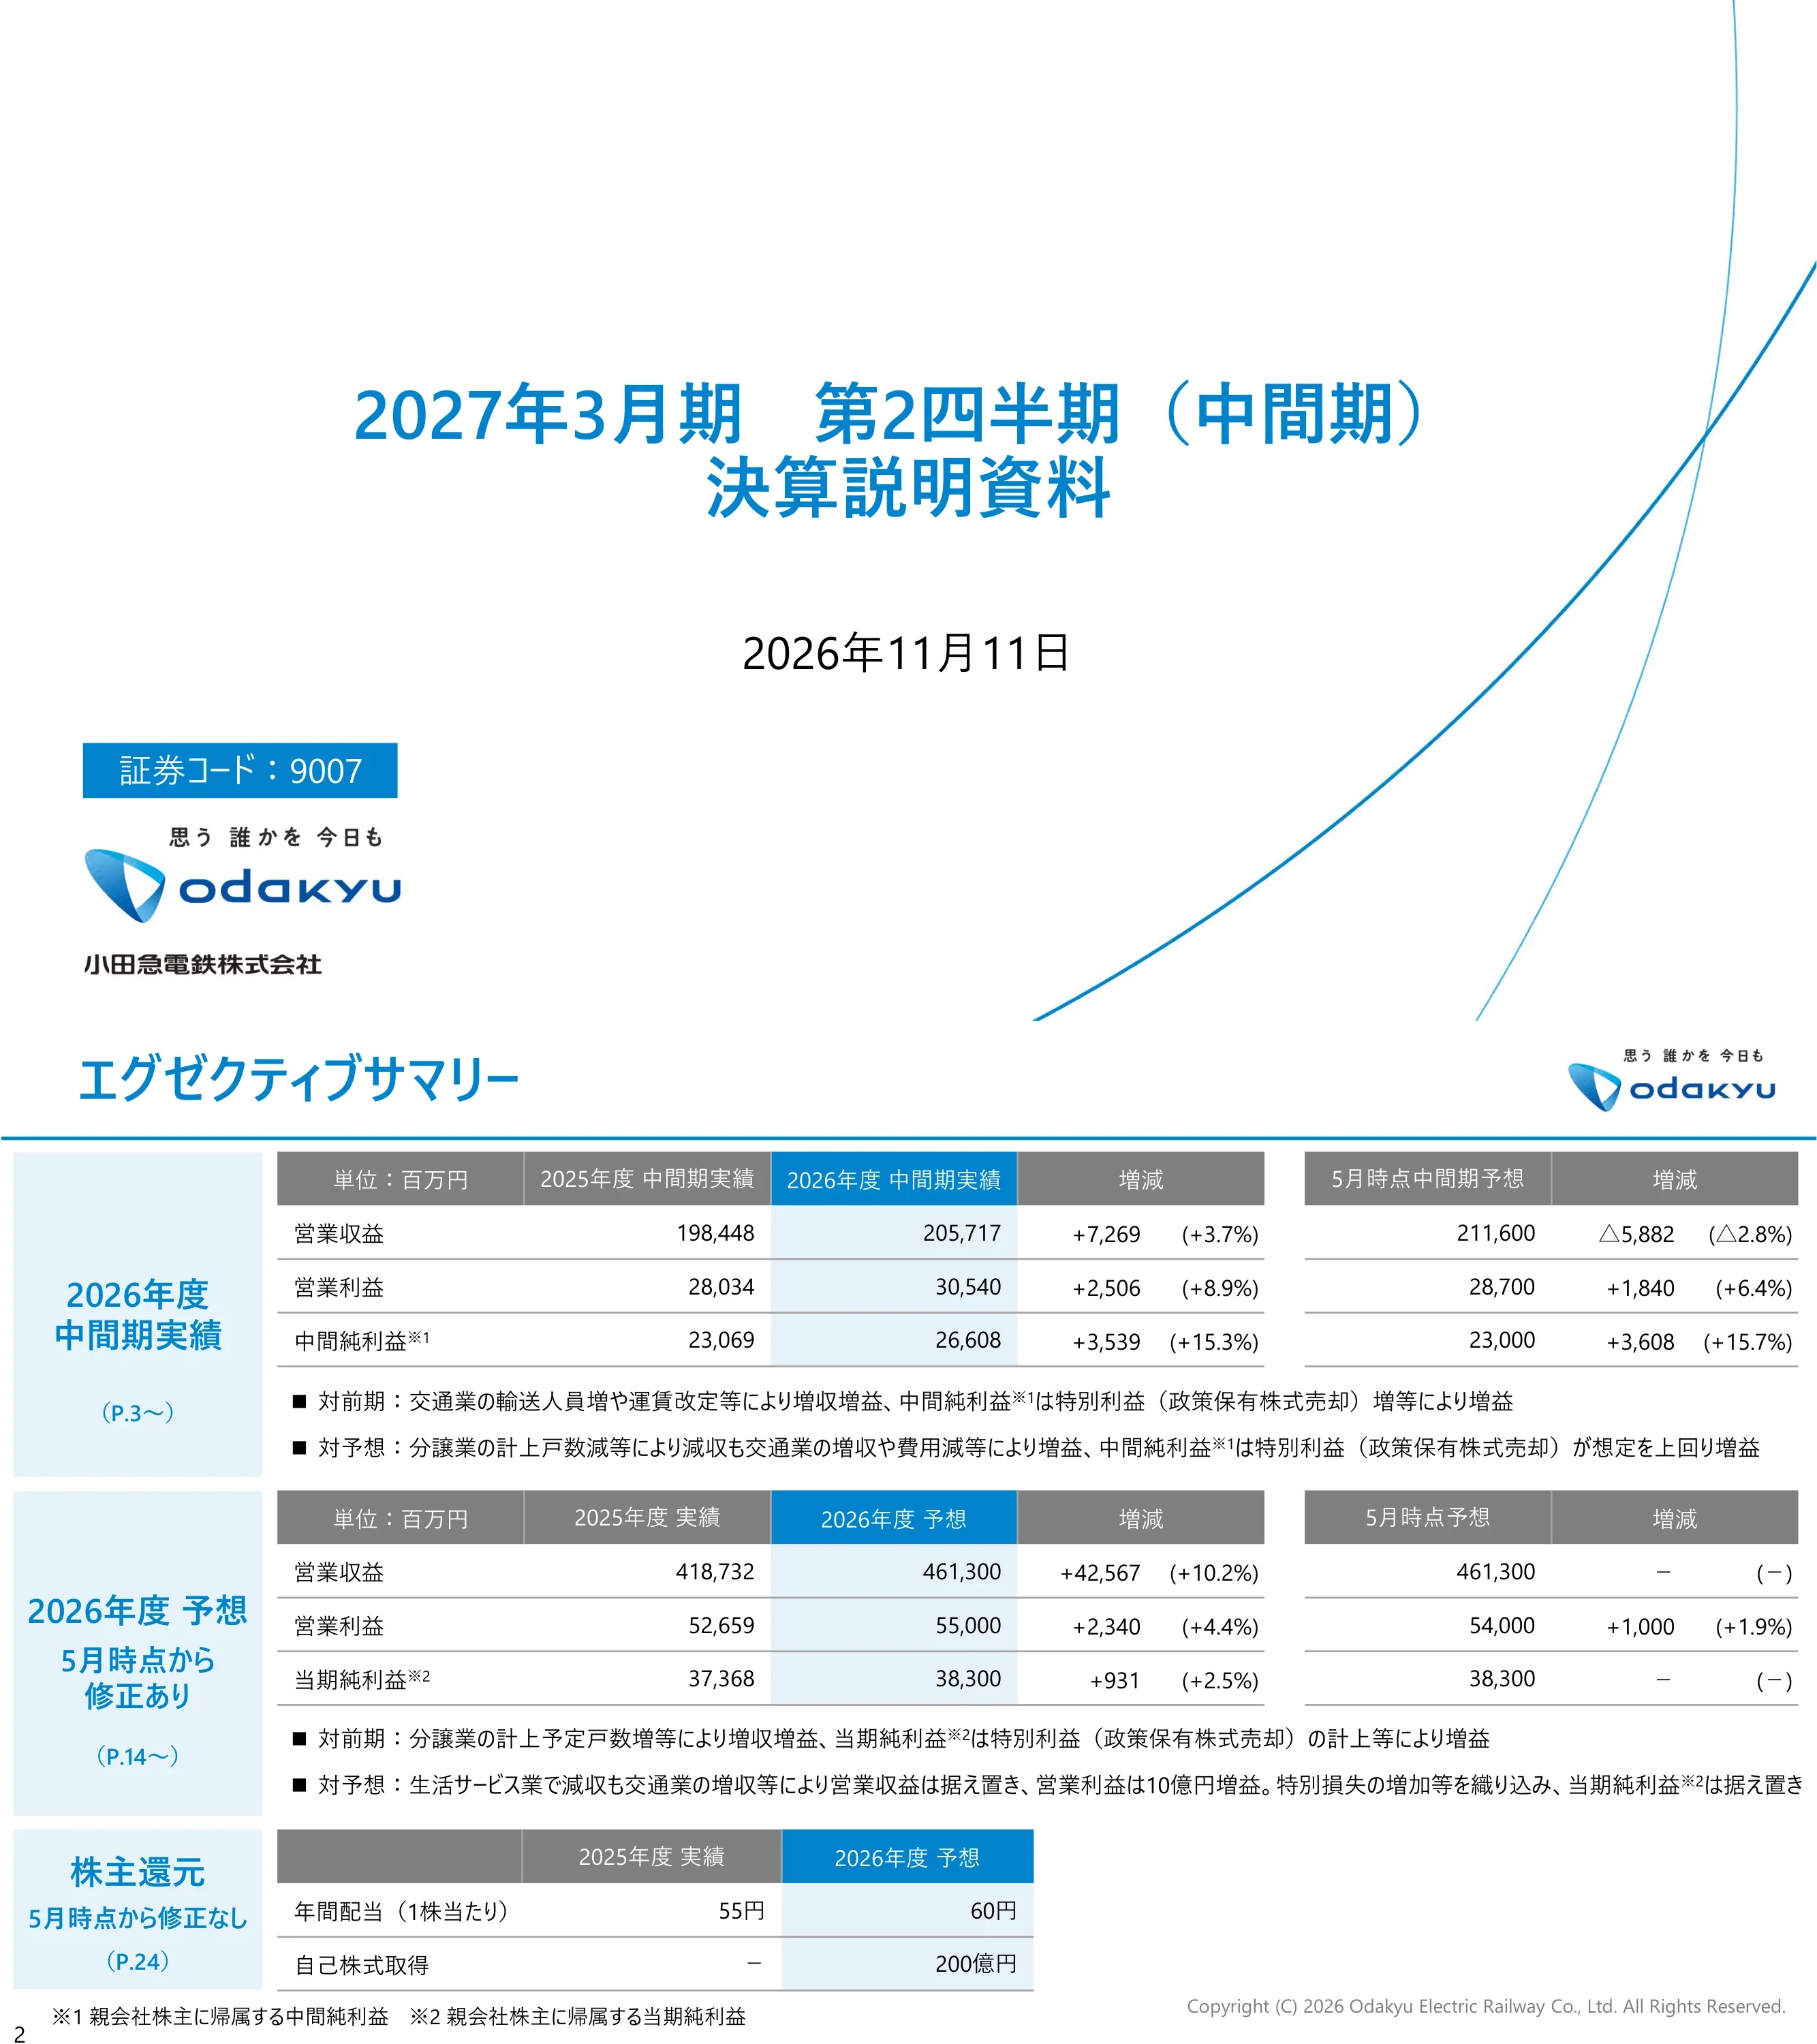
Cover slide of the interim results briefing (決算説明資料) for the fiscal year ending March 2027, dated 11 November 2026. It shows the securities code 9007 and the Odakyu Electric Railway Co., Ltd. logo with the tagline 'thinking of someone, every day'.
Centered blue title and date on a white background with sweeping thin blue arcs on the right; securities code tag and logo at lower left.
H1 FY2026 operating revenue was ¥205,717 million (+3.7% YoY), operating profit ¥30,540 million (+8.9%) and interim net profit attributable to owners of parent ¥26,608 million (+15.3%), above the May forecast of ¥23,000 million. The full-year forecast is operating revenue ¥461,300 million (+10.2%), operating profit ¥55,000 million (+4.4%, raised from ¥54,000 million) and net profit ¥38,300 million (+2.5%). Annual dividend is planned at ¥60 per share (FY2025: ¥55) plus a ¥20,000 million share buyback, unchanged from May.
Three horizontal bands (interim results, full-year forecast, shareholder returns), each with a left label block, a comparison table against the prior year and the May forecast, and bullet commentary underneath.
Revenue rose ¥7,269 million on higher railway ridership, fare revisions, commercial facility rents and retail gains; operating profit rose ¥2,506 million. Ordinary profit was ¥28,543 million (+3.9%), extraordinary gains ¥11,222 million (investment securities sales ¥9,556 million, fixed asset sales ¥1,083 million) and net profit ¥26,608 million. Capital expenditure was ¥21,812 million, depreciation ¥22,722 million and interest-bearing debt ¥705,463 million (¥699,754 million at the end of FY2025).
Boxed commentary at top, a main P&L table on the left, a middle panel explaining non-operating and extraordinary items, and a May-forecast comparison column on the right.
Operating revenue rose ¥7,269 million from ¥198,448 million to ¥205,717 million: Transportation +¥3,829 million (¥93,972 million), Real Estate +¥875 million (¥40,692 million), Lifestyle Services +¥2,809 million (¥79,150 million). Operating profit rose from ¥28,034 million to ¥30,540 million, with margin up 0.7 points to 14.8%; Transportation +¥1,597 million, Real Estate +¥559 million, Lifestyle Services +¥343 million.
Left segment table with margins; right two stacked waterfall charts (revenue on top, operating profit below) with annotated drivers.
Against the May forecast of ¥211,600 million, revenue was ¥5,882 million lower at ¥205,717 million, mainly Real Estate -¥4,907 million (fewer buy-and-resell units and investment-development sales) and Lifestyle Services -¥1,349 million. Operating profit beat the ¥28,700 million forecast by ¥1,840 million: Transportation +¥915 million (lower personnel costs), Real Estate +¥789 million (commercial rents) and Lifestyle Services +¥123 million.
Same format as the previous slide: segment table on the left and two waterfall bridges on the right, starting from the May forecast.
Total assets were ¥1,391,382 million, down ¥2,139 million from the prior year-end, as cash fell ¥19,893 million after the share buyback while real estate for sale rose ¥19,174 million. Liabilities were ¥879,341 million (-¥5,397 million) and net assets ¥512,041 million (+¥3,258 million). The equity ratio was 36.7% versus 36.4%.
Summary box above a balance sheet table with a wide reasons column listing the main movements.
Operating cash flow was ¥14,769 million (FY2025 H1: ¥28,641 million), reduced by real estate for sale purchases. Investing cash flow was -¥17,175 million and free cash flow -¥2,406 million. Financing cash flow was -¥17,486 million with lower borrowing and higher share buyback payments, leaving cash and equivalents at ¥19,970 million after a ¥19,893 million decrease.
Summary box over a six-row table (operating, investing, free, financing, change in cash, ending balance) with a reasons column.
Transportation revenue was ¥93,972 million (+4.2%) and operating profit ¥20,015 million (+8.7%, margin 21.3%). Railway revenue was ¥68,220 million, bus ¥20,242 million and other ¥5,509 million, helped by ridership and a fare revision in the Hakone area from 1 October 2025. Capital expenditure was ¥14,249 million and depreciation ¥15,143 million.
Wide table with sub-segment rows (railway, bus, other) for revenue and operating profit, a reasons column, and a May-forecast comparison panel on the right.
Odakyu's own railway carried 369,040 thousand passengers (+1.6%), with commuter passes +1.2% and non-commuter +2.1%; transport revenue was ¥61,975 million (+2.1%). Operating expenses were ¥46,753 million (+1.0%). Tourism revenue including duty-free sales was ¥42,864 million (+11.5%), of which inbound ¥14,846 million (+26.8%); the Hakone area was ¥16,079 million (+14.9%).
Three side-by-side tables at top (passengers, transport revenue, operating costs) and two tourism tables at the bottom.
Real Estate revenue was ¥40,692 million (+2.2%) and operating profit ¥7,189 million (+8.4%, margin 17.7%). Property sales revenue was ¥10,987 million, leasing ¥22,969 million (+¥708 million on commercial rents) and other ¥6,735 million. Versus the May forecast, revenue was ¥4,907 million lower because of fewer buy-and-resell units and investment-development sales, while profit was ¥789 million higher.
Table with real estate sales, leasing and other sub-rows, a reasons column and a May-forecast panel on the right.
Real estate sales revenue of ¥10,987 million split into investment development ¥990 million, sales ¥5,434 million, buy-and-resell ¥1,223 million and other ¥3,338 million. Leasing revenue was ¥22,969 million, led by commercial facilities at ¥14,855 million. Units recorded for sale were 65 (77 a year earlier), including 62 condominium units, with major properties named such as Leafia Residence Hachioji Kitano and Brans Tower Hashimoto.
Four-panel grid of tables for sales and leasing revenue breakdowns, investment development sale count, buy-and-resell units and units recorded, plus property lists.
Lifestyle Services revenue was ¥79,150 million (+3.7%) and operating profit ¥3,323 million (+11.5%, margin 4.2%). Stores and retail were ¥34,656 million, hotels ¥7,371 million (including RETONA HAKONE, opened 15 December 2025), restaurants ¥8,903 million and department stores ¥10,761 million. Versus the May forecast revenue was ¥1,349 million lower, but operating profit was ¥123 million higher.
Table of five sub-businesses with revenue and profit rows, a reasons column and a May-forecast panel.
Odakyu Department Store sales were ¥30,857 million (+2.3%); the store business was ¥34,656 million (+4.2%), including Seven-Eleven at ¥7,740 million (+13.0%). Hotel Century Southern Tower occupancy was 91.3% (+2.8 points) and foreign guest ratio 90.3%. Hakone hotels showed mixed occupancy, and Hakone-area average room rate rose 5.0% excluding RETONA HAKONE.
Four-quadrant layout: department store sales, store and retail breakdown, hotel occupancy by property and foreign guest ratio by property.
The headline says operating revenue is held while operating profit is raised to ¥55,000 million on strong railway results despite a downward revision in Lifestyle Services. Railway passengers are now forecast +1.7% (was +0.8%) and revenue +2.2% (was +1.3%); units recorded for sale rise to 441 (+211); department store sales +1.1% and store same-store sales +2.4%. Topics include fare revisions for buses and Hakone and the suspension of overnight operations at Hotel Century Southern Tower from 1 October 2026, a ¥2,400 million revenue reduction.
Two-column comparison of the May forecast (grey) versus the current forecast (blue) by segment, with a topics band at the bottom.
FY2026 forecast: operating revenue ¥461,300 million (+10.2%), operating profit ¥55,000 million (+4.4%), ordinary profit ¥48,600 million (-10.0%) and net profit ¥38,300 million (+2.5%). Capital expenditure is ¥132,800 million, depreciation ¥46,700 million and interest-bearing debt ¥790,500 million. Interest-bearing debt/EBITDA is 7.8x, ROA 2.7% and ROE 8.0%.
Commentary box above a table of P&L and KPI rows with FY2025 actual, FY2026 forecast and change, plus a May-forecast comparison on the right.
Forecast revenue rises ¥42,567 million: Transportation +¥6,838 million, Real Estate +¥32,873 million (more units recorded) and Lifestyle Services +¥3,593 million. Operating profit rises ¥2,340 million: Real Estate +¥3,626 million, Transportation +¥182 million and Lifestyle Services -¥1,458 million due to the Southern Tower overnight suspension. Operating margin is 11.9% (-0.7 points).
Segment table at left with two waterfall charts (revenue and operating profit) at right and a boxed summary on top.
Revenue stays at ¥461,300 million: Transportation +¥1,000 million and Real Estate +¥1,000 million, offset by Lifestyle Services -¥1,100 million and adjustments -¥900 million. Operating profit rises ¥1,000 million to ¥55,000 million, entirely from Transportation (railway ridership); Real Estate and Lifestyle Services are unchanged. Margin improves 0.2 points to 11.9%.
Mirror of the prior slide with the May forecast as the starting bar for both waterfalls.
Transportation revenue is forecast at ¥188,100 million (+3.8%): railway ¥136,300 million, bus ¥40,400 million, other ¥11,400 million. Operating profit is ¥29,700 million (+0.6%), with railway ¥23,200 million held back by depreciation and personnel costs. Capital expenditure is ¥77,700 million (FY2025: ¥51,013 million) and operating profit ROA is 4.2%.
Segment table with revenue and profit sub-rows, a factors column and a May-forecast comparison panel on the right.
Forecast railway passengers are 724,496 thousand (+1.7%), transport revenue ¥123,740 million (+2.2%) and operating costs ¥100,881 million (+2.3%). Tourism revenue including duty-free is forecast at ¥84,452 million (+4.8%), with inbound ¥27,687 million (+6.2%); the Hakone area is ¥32,714 million (+9.9%) and its inbound portion ¥9,784 million (+18.2%).
Same three-table top row and two tourism tables below as the H1 key indicator slide, but with forecast columns.
Real Estate revenue is forecast at ¥129,100 million (+34.2%) with operating profit ¥19,100 million (+23.4%). Property sales revenue is ¥67,900 million (+¥32,211 million, driven by +211 units sold and +13 buy-and-resell units and 3 more investment-development sales), while leasing profit falls ¥883 million on higher repair costs. Capital expenditure is ¥38,700 million and operating profit ROA 3.4%.
Table with sales, leasing and other sub-rows, reasons column and May-forecast panel on the right.
Property sales revenue is forecast at ¥67,900 million: investment development ¥15,100 million, sales ¥32,800 million, buy-and-resell ¥11,600 million. Units recorded for sale are 441 (230 in FY2025), mostly condominiums (429), with five investment-development sales planned (2 in FY2025) such as logistics centers in Aichi and Fukuoka, and 25 buy-and-resell units. Leasing revenue is ¥46,100 million, of which commercial facilities are ¥30,100 million.
Four-panel grid of revenue breakdowns, planned sales counts and units, with named property lists and handover dates.
Lifestyle Services revenue is forecast at ¥162,200 million (+2.3%) with operating profit ¥6,200 million (-19.0%, margin 3.8%). Hotels are the main drag: revenue ¥12,500 million and profit ¥1,000 million (FY2025: ¥2,818 million) because of the Southern Tower overnight suspension (-¥2,400 million). Stores and retail are ¥70,200 million, restaurants ¥18,500 million; capital expenditure is ¥16,400 million.
Table of five sub-businesses with revenue and profit rows, factors column and May-forecast panel.
Department store sales are forecast at ¥65,380 million (+1.1%) and the store business at ¥70,200 million (+4.0%), with Seven-Eleven at ¥15,400 million (+9.5%). Hotel occupancy forecasts include 91.3% for Hotel Century Southern Tower, 71.9% for RETONA HAKONE and 84.7% for Hakone Yuwaku. Hakone-area average room rate is expected up 4.6%.
Department store and store/retail tables across the top and a hotel occupancy table by property below.
Not revised since May 2026. Long-term goals: reduce equity ratio toward 30% by FY2030 (36.4% at FY2025 end), ¥180,000 million of shareholder returns in FY2026-2030 (¥200,000 million for FY2025-2030) and progressive dividends. Dividend per share is ¥55 for FY2025 and ¥60 planned for FY2026 (¥30 interim plus ¥30 year-end); a ¥20,000 million buyback is planned by end of December 2026, after ¥32,700 million in FY2023-2024.
Top: stacked policy blocks (long-term goal, basic policy, dividend, buyback). Bottom: stacked bar chart of dividend per share from FY2018 to FY2026, with hatched forecast bars.
Targets: ROE 8.0% in FY2026 rising to 10% or more in FY2030; operating profit ¥55,000 million in FY2026 (revised in this release) and ¥80,000 million or more in FY2030; interest-bearing debt/EBITDA kept in the 7x range through FY2030. The charts show operating profit, net profit and ROE history from FY2018 to FY2026 and interest-bearing debt (¥790,500 million forecast, about ¥1,040,000 million targeted for 2030).
Three goal rows at top and two combination charts below (profitability and financial soundness) with hatched bars for forecasts and targets.
Points readers to other results materials on the company website (earnings summary and results FAQ at odakyu.jp/ir/financial). The cautionary note says that plans, outlooks and strategies that are not historical fact are forward-looking, based on management judgment from information available at release, and actual results may differ with changes in the economic environment.
Text-only closing slide with two headed sections (guidance and cautions) and the company name in large type at the bottom.
Domande comuni su questa slide e il contenuto della presentazione sottostante.
It is Odakyu Electric Railway's interim results briefing (決算説明資料) for the fiscal year ending March 2027, released on TDnet, the Tokyo Stock Exchange timely-disclosure service, on 11 November 2026. The slides are in Japanese; this page provides English titles and key figures, with amounts kept in yen using the company's own ¥ million (百万円) units.
H1 FY2026, the first half of the fiscal year from April to September 2026. FY2026 is the year ending March 2027. The deck also gives the full-year FY2026 forecast and compares both with the prior year and the May 2026 forecast.
Operating revenue was ¥205,717 million (+3.7%), operating profit ¥30,540 million (+8.9%) and profit attributable to owners of parent ¥26,608 million (+15.3%), helped by extraordinary gains from selling policy-held shares.
Yes. Operating profit was raised to ¥55,000 million from ¥54,000 million, while operating revenue (¥461,300 million) and net profit (¥38,300 million) were left unchanged. Shareholder return plans were also unchanged.
Transportation (railway, bus, other), Real Estate (property sales and leasing) and Lifestyle Services (department stores, stores and retail including Seven-Eleven, hotels, restaurants and other). Each has an actuals slide, a key-indicators slide and a forecast counterpart.
The annual dividend is planned at ¥60 per share for FY2026, up from ¥55 in FY2025, and a ¥20,000 million share buyback is planned by the end of December 2026. Long-term goals include an equity ratio of 30% by FY2030.
It is a 26-slide, table-heavy layout with a boxed summary on top of each slide, highlighted current-period columns, change-versus-prior-year and change-versus-forecast columns, and waterfall bridges for revenue and profit. It suits designers studying Japanese earnings decks and founders learning how to structure results presentations.
Most table text is legible at slide resolution. This analysis is a summary of the slides and is not investment advice; check the original filing for exact figures and definitions.

Create Your Own Slides
Turn your ideas into professional presentations in seconds with 2slides AI.
Fai riferimento a design professionali, scegli il tuo stile e genera slide con rendering del testo perfetto. Alimentato da Nano Banana—inizia a creare la tua presentazione ora.
Il Tuo Agente IA per le slide. Risparmia tempo, brilla più velocemente con la creazione intelligente di presentazioni.


© 2026 2slides. Tutti i diritti riservati.