
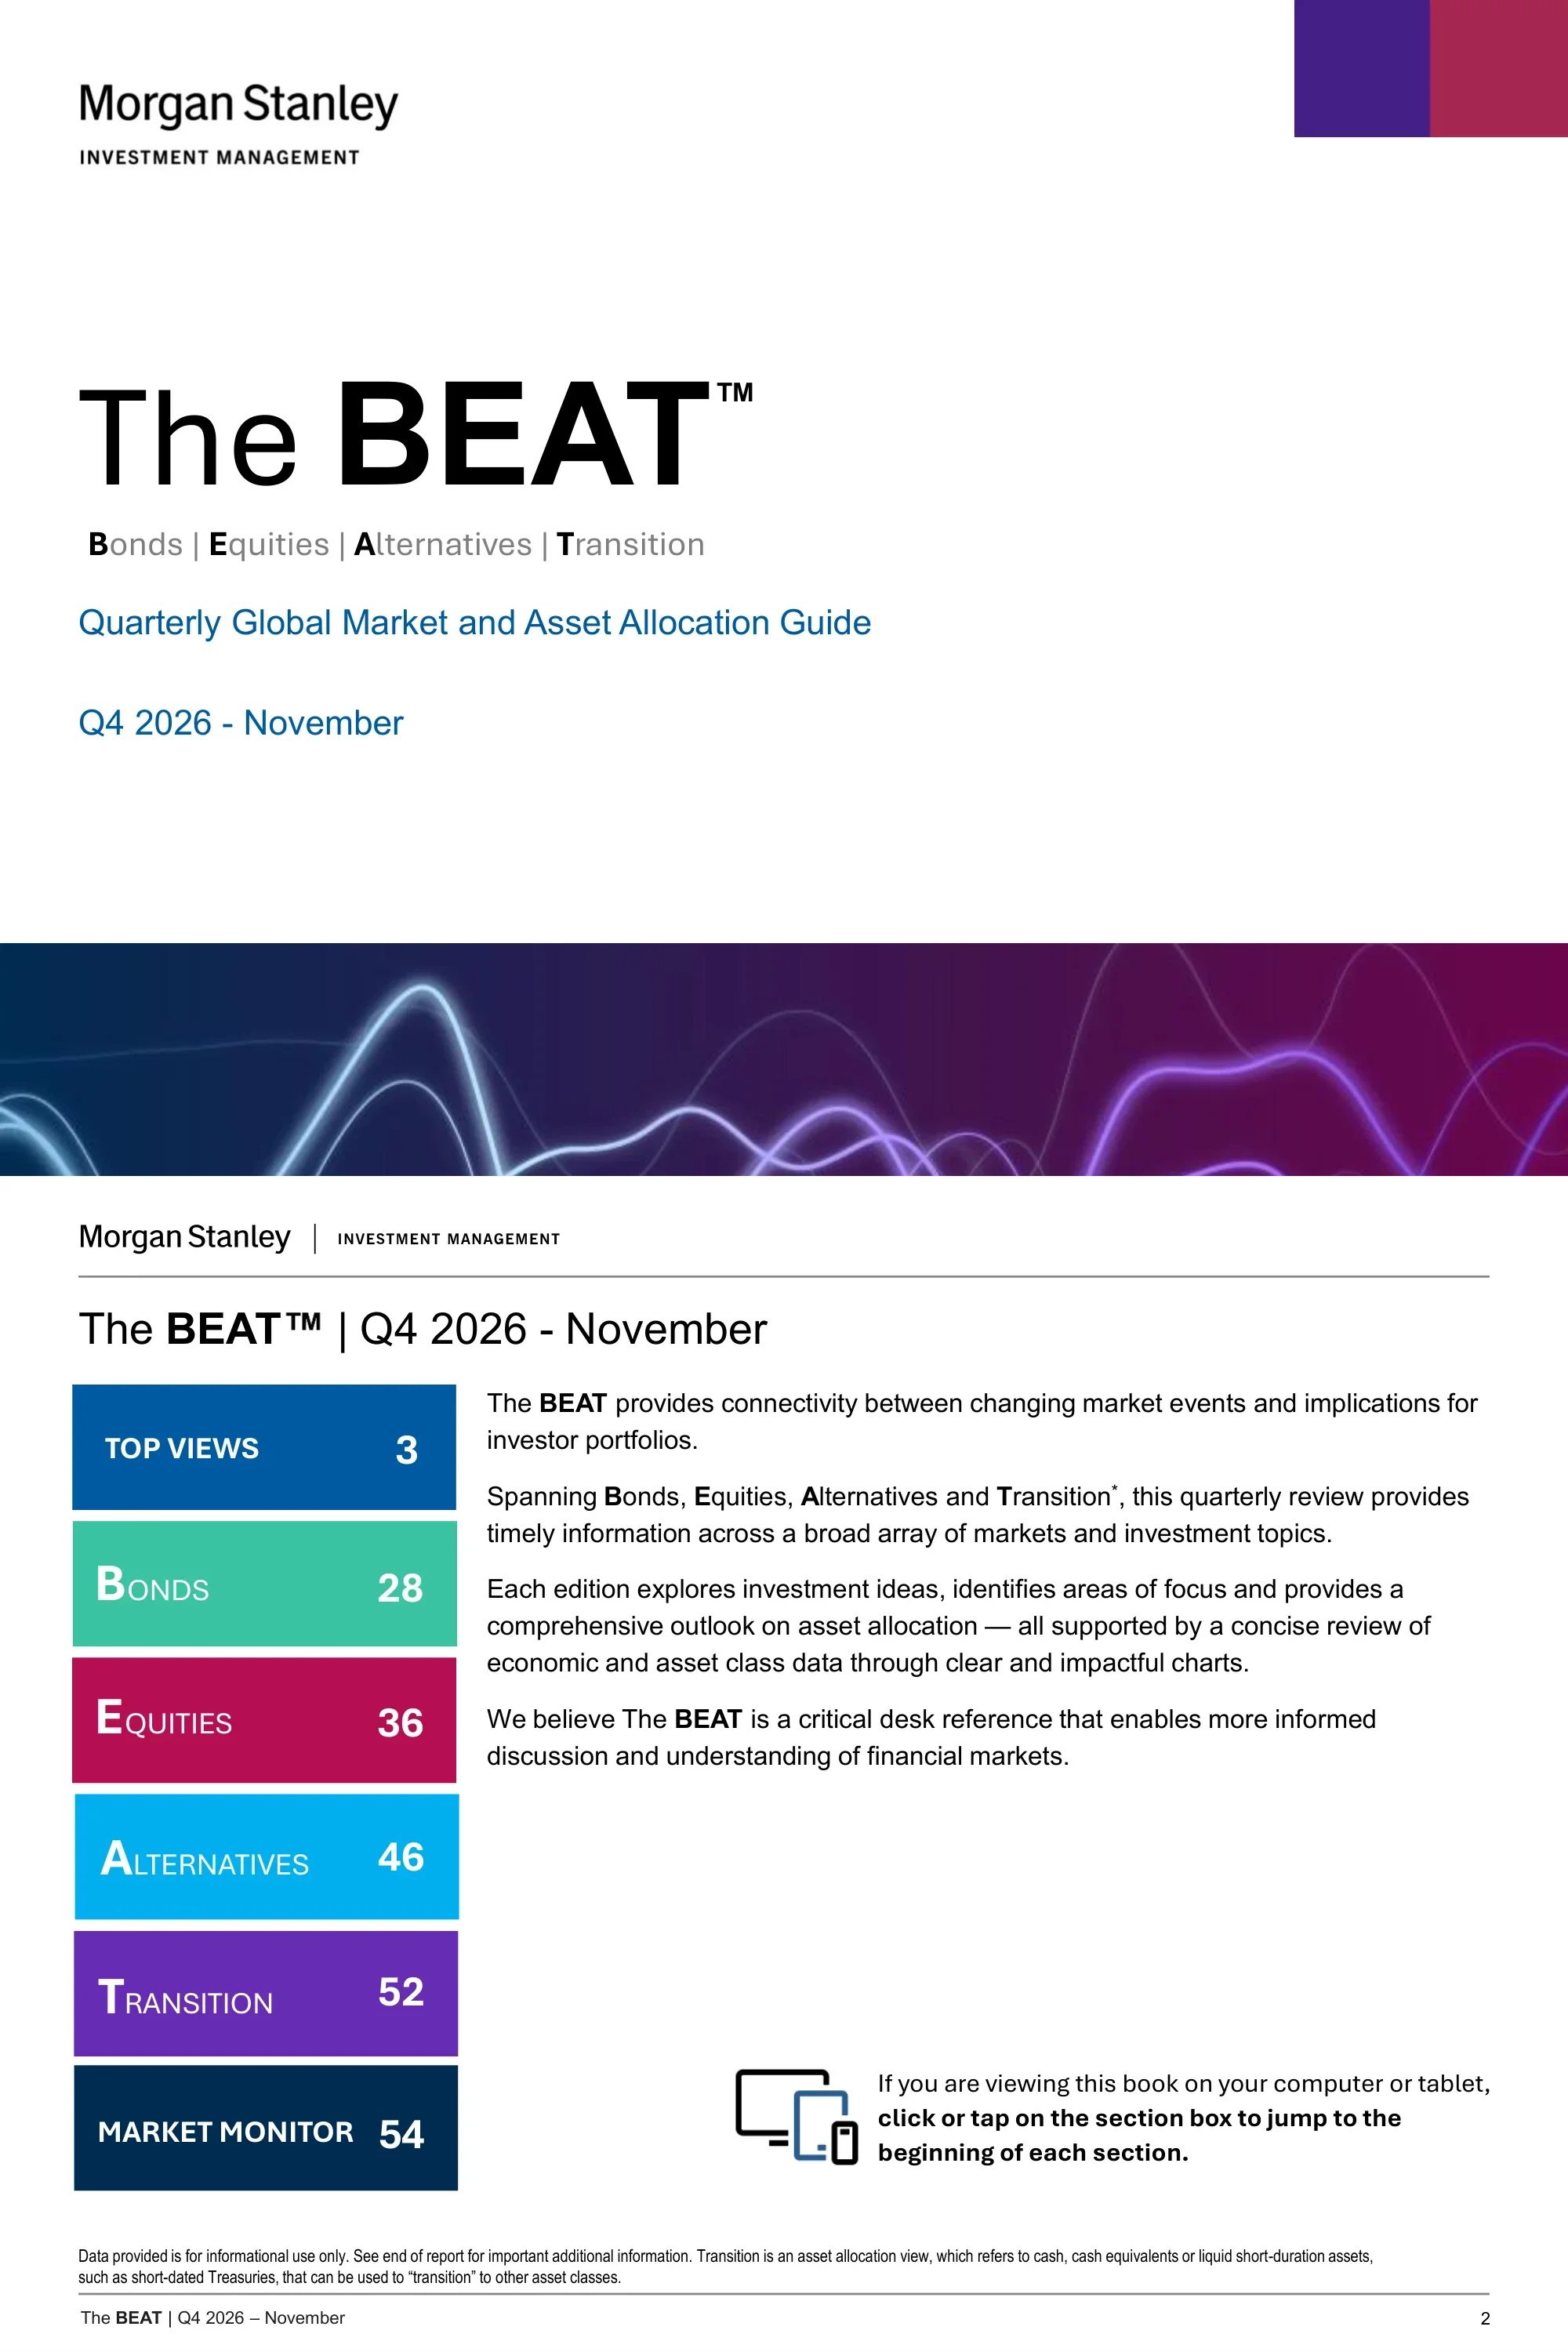
Morgan Stanley Investment Management's The BEAT (Bonds | Equities | Alternatives | Transition), a 92-page quarterly global market and asset allocation guide for Q4 2026 (November edition). It pairs Top Views and tactical allocation grids with chart-driven sections on bonds, equities and alternatives, a data-heavy Market Monitor and full disclosures.
Usa la copertina di questa presentazione come riferimento di stile per slide create con i tuoi contenuti. Oppure scegli una pagina qui sotto per usarne il layout come riferimento.
Navigazione Rapida
Tag
Condividi le slide
Morgan Stanley Investment Management's The BEAT (Bonds | Equities | Alternatives | Transition), a 92-page quarterly global market and asset allocation guide for Q4 2026 (November edition). It pairs Top Views and tactical allocation grids with chart-driven sections on bonds, equities and alternatives, a data-heavy Market Monitor and full disclosures.
Vista dettagliata di ogni pagina di slide, inclusi layout, contenuto chiave ed elementi visivi.
Cover for the Quarterly Global Market and Asset Allocation Guide, Q4 2026 - November, expanding BEAT as Bonds | Equities | Alternatives | Transition.
Left-aligned title block with bottom banner
Introduces The BEAT as a desk reference and indexes its sections: Top Views (p.3), Bonds (28), Equities (36), Alternatives (46), Transition (52) and Market Monitor (54).
Colour-box contents list beside intro text
Section divider opening the Top Views part of the guide.
Title-only divider
Summarises the constructive stance: yields are rising largely because nominal growth is strong, with eight themes from equities to EM external debt.
Intro paragraph above two-column theme list
Lists seven ranked active views, from overweight global equities versus fixed income to MBS/residential non-agency as the highest-conviction bond overweight.
Numbered list of seven views
Allocation grid placing duration, corporate credit, equity risk level, private markets, hedge funds, commodities and cash on an underweight-to-overweight scale, with three points of focus.
Signal grid with side panel
Commentary beside the asset allocation grid, noting U.S. 10-year yields back near 5% and a slightly underweight duration view.
Mini grid with commentary column
Views grid for Treasuries, TIPS, eurozone government bonds, EM debt, municipals, IG, MBS/ABS, high yield and bank loans, with MBS/ABS as the highest-conviction fixed income overweight.
Signal grid with side panel
Written rationale for each fixed income view, including slightly underweight U.S. duration and an overweight to inflation-linked bonds.
Row labels with commentary text
Views grid for U.S., eurozone, Japan, EM and style tilts such as growth versus value, with four points of focus including overweight U.S. and small/mid-cap.
Signal grid with side panel
Region-by-region commentary: overweight U.S. on earnings strength, underweight Europe on energy headwinds, neutral Japan and neutral EM.
Row labels with commentary text
Maps top views into themes such as U.S. Productivity Boom, EU Renaissance, Japan's Revival, Global Power/Electrification and AI Winners.
Themed card grid
Backdrop of resilient growth, sticky inflation, gradual Fed tightening and expansionary fiscal policy, leading to overweight equities, underweight duration and an oil supply shock as key risk.
Two stacked summary panels
Line chart of consensus nominal GDP growth for 2025, 2026 and 2027, with the 2026 estimate rising toward roughly 5.8%.
Headline, subtitle and full-width line chart
Compares Fed funds with nominal growth, noting that nominal growth is nearly 3% above the policy rate and past recessions followed over-tightening.
Headline, subtitle and line chart
Shows S&P Global World Services and Manufacturing PMIs, with activity accelerating rather than slowing despite higher energy prices and rates.
Headline, subtitle and line chart
Real core retail sales (control group, 3M moving average) keep growing despite the energy shock, with August sales beating expectations.
Headline, subtitle and line chart
Monthly net change in nonfarm payrolls, with headline prints choppy but trends firming once one-off impacts are excluded.
Paired bar charts with callouts
Atlanta Fed wage growth and JOLTS-quit-rate-modelled wages show wage growth has stabilised even as labor demand firms.
Headline, subtitle and line chart
U.S. nonfarm productivity YoY stays healthy, supporting growth without reigniting inflation.
Headline, subtitle and multi-year line chart
The Citi Inflation Surprise Index shows recent U.S. inflation releases have been in line with or slightly better than consensus.
Headline, subtitle and line chart
Core PCE has surged to 3.3%, but trimmed mean inflation points to persisting disinflationary pressure, with inflation concentrated in AI and tariff-related categories.
Two side-by-side charts
Forwards price rate hikes from all four major central banks (Fed, ECB, BoJ, BoE) by mid-2027, driven by the energy shock.
Clustered column chart
Crude prices have been rangebound while inventories decline, with the main risk in refined products due to lost refining capacity.
Two side-by-side charts
E.U. versus U.S. economic surprise moves with oil prices, and unusually low gas storage leaves Europe vulnerable entering winter.
Dual-chart page
AI and tech exports account for roughly 70% of Asia's export growth, led by Taiwan packaging, Korean memory and Chinese optical modules.
Stacked column chart with line
China's manufacturing exports accelerate while imports lag, widening the trade surplus and marking a China Shock 2.0 period.
Long-run line chart with era labels
Section divider opening the Bonds part of the guide.
Title-only divider
Rolling 10-year annualised returns of the 10-year UST are near their lowest since the 1800s, but higher yields offer a more attractive starting point.
Headline, subtitle and long-history line chart
The UST 10-year term premium has moved sideways over the past year, while Japan's has risen and the U.S. and Germany stay broadly stable.
Headline, subtitle and multi-line chart
Two charts show 10-year UST yields reconnecting with nominal GDP running near 6% and nominal growth supporting S&P 500 EPS growth.
Two side-by-side line charts
EM sovereign spreads are near historical tights, while Brazil's high real rates stand out across local bond markets.
Two charts side by side
U.S. IG option-adjusted spreads are near historical tights, creating poor risk/reward versus MBS if growth slows.
Two charts side by side
Spain and Portugal are expected to keep outgrowing EU peers while running a primary surplus, supporting continued peripheral spread tightening.
Scatter or bar chart with commentary
High yield spreads remain tight relative to expected credit losses, leaving little margin of safety.
Dual-axis line chart
Section divider opening the Equities part of the guide.
Title-only divider
MSCI ACWI forward EPS is up 30% YTD while the forward P/E is down 14%, so returns reflect earnings rather than multiples.
Stacked column chart with line
Growth/Tech leads EPS revisions up about 29% for CY2026 and about 19% for CY2027, with upgrades widening into cyclicals.
Two side-by-side bar charts
OpenRouter token demand reached 113 trillion per week at end of August, up 25x YoY and 2x MoM.
Headline, subtitle and growth chart
Nvidia's revenue guidance of 70% growth for fiscal 2028 beat consensus expectations of 45%.
Combo column and line chart
Cyclicals have underperformed defensives since July after the U.S.-Iran MOU unraveled, though manufacturing data remains supportive.
Dual-axis line chart
European equities show weaker EPS growth and are the only market more expensive since the start of the Iran war.
Chart set with headline and subtitle
The forward market is warming to a 2% BoJ policy rate era, with higher rates and capital reforms expected to drive re-rating and ROE uplift.
Two charts with callout labels
EM semiconductor forward P/E is back roughly in line with the rest of EM even as earnings continue to soar.
Two stacked line charts
India's forward EPS growth looks subpar versus EM while its P/E premium remains close to 100%.
Column chart with premium line
Section divider opening the Alternatives part of the guide.
Title-only divider
Rates private equity Neutral to Positive and private credit Neutral, noting AI takes over two-thirds of U.S. VC dollars but under half of deals.
Rating labels with bulleted commentary
Stable view as valuations reset and distributions lag, with AI accounting for 70% of VC deal value and PE distribution yield at 13.2% versus 5.4% for VC.
Rating grid, focus panel and two charts
Direct lending concerns are receding as the tech maturity wall extends and defaults stay concentrated in 2021 and 2022 vintages.
Rating grid, focus panel and two charts
Positive on Energy, selective on Digital and Transport, with a potential 38 GW shortage between 68 GW of power needed and grid supply for U.S. datacenters.
Rating grid, focus panel and two charts
Healthy fundamentals with selective sector and financing exposure: pipelines are declining and residential rent growth is reaccelerating.
Rating grid, focus panel and two charts
Section divider opening the Transition part of the guide, covering cash and short-duration assets.
Title-only divider
Correlation matrix across nine asset classes for the 5 and 10 years ended Oct 31, 2026, for example S&P 500 versus International at 0.83 over ten years.
Full-slide correlation matrix
Section divider titled Market Monitor - November 2026, opening the data appendix.
Title-only divider
Bar charts compare 10-year yields for developed and emerging markets now, one month ago and 12 months ago.
Two side-by-side bar charts
Table of money market and sovereign rates, with the 10-year Treasury at 4.91 versus 4.09 twelve months earlier.
Full-width data table
Central bank policy rates: Fed 4.00%, BOE 3.75%, BOJ 1.25% and ECB 2.65%, alongside market expectations and long-run history.
Charts with summary table
Treasury yield curve and a yields-and-total-return table, with the 10-year at 4.91% and the 30-year at 5.29%.
Curve chart above data table
Table of spot returns versus USD and EUR plus local interest rates for eleven currencies, with a long-run U.S. Dollar Index chart.
Matrix table with chart
Bond index table: the Bloomberg U.S. Aggregate shows a 5.24% yield to worst, 32 bps spread and 5.8-year duration, with returns from 1 month to 10 years.
Grouped data table
Spread ranges for Aggregate, MBS, ABS, CMBS, Corporate, Preferred, Loans, EM and High Yield, with most maximum spreads dated March 2020.
Range chart with date table
Corporate index table by rating: U.S. IG yields 5.79% at a 90 bps spread, while U.S. High Yield yields 8.30% at 344 bps.
Grouped data table
HY corporate spread is 344 bps versus 294 a year ago, with the HY annual default rate at 1.95% and loans at 0.55%.
Bar charts with summary tables
Municipal table showing the Bloomberg Municipal Bond Index at a 4.21% yield to worst, with rating, maturity and high yield sub-indices.
Grouped data table
AAA muni-to-Treasury yield ratios of 63, 69 and 91 for 5Y, 10Y and 30Y, plus credit quality spreads versus AAA.
Two charts with data tables
EM debt table and charts: the EMBI Global Diversified yields 7.09% with a 208 bps average spread, versus a 352 bps median.
Index table above three charts
Bar charts of one-year local interest rates, current versus one year prior, for eleven developed and fourteen emerging market currencies.
Two side-by-side bar charts
Annual return rankings for bond asset classes from 2016 to YTD 2026, from high yield and EM local to Treasuries and bank loans.
Ranked quilt chart by year
Heat maps of 1-month, 1-year and 3-year returns by size and style, for example Large Cap Value at 28.67% over one year versus Large Cap Growth at -2.59%.
Three heat-map grids with legend
Historical and current dividend yields for equity indices versus the 10-year Treasury at 4.91%, with S&P 500 correlation and VIX history.
Four-panel chart grid
Current NTM P/E versus 10-year high, low and average for major regional and style indices, with high and low dates.
Range bars with date table
Current NTM P/E versus 10-year high, low and average for each S&P 500 sector, shown with high and low dates.
Range bars with date table
Expected versus 2025 EPS growth by region, style and S&P 500 sector, shown as paired horizontal bars.
Two paired bar charts
Breakdown of the S&P 500's -0.9% one-month return by earnings growth, market cap, P/E, beta, ROE and dividend yield buckets.
Six small bar charts
The same six factor breakdowns applied to the S&P 500's 11.8% year-to-date return.
Six small bar charts
Sector return bars for the S&P 500 and MSCI World over 1 month and 1 year.
Two side-by-side bar charts
Comparison table of ten equity indices (e.g. 503 S&P 500 holdings, 18.35 NTM P/E) with sector weights such as Information Technology at 30% of the S&P 500.
Characteristics table with weights
Return table for U.S., global and sector equities, e.g. S&P 500 +11.77% YTD, Russell 1000 Value +24.50% and Russell 1000 Growth -0.17%.
Grouped return table
Annual equity style and region return rankings from 2016 to YTD 2026.
Ranked quilt chart by year
Commodity sub-index returns: the Bloomberg Commodity Index is up 32.75% YTD and 36.57% over one year, with Brent crude up 151.52% YTD.
Grouped return table
Annual return rankings for hedge fund strategies, MLPs and commodities from 2016 to YTD 2026, as of 9/30/2026 with a one-month lag on YTD data.
Ranked quilt chart by year
Growth of $10K for Bitcoin, Ethereum and Solana indices from 7/1/2021, with a correlation table across S&P 500, Nasdaq, Gold, DXY, U.S. Agg and Bitcoin.
Bar chart beside correlation matrix
Hypothetical comparison of a 60/40 portfolio with 1% and 3% Bitcoin added, across return, volatility and Sharpe ratio for 1 to 10 years.
Three comparison tables
Top and bottom ten mutual fund and ETF categories by monthly flows, with Nontraditional Bond leading mutual fund inflows at $1,647MM and Large Blend seeing -$23,027MM.
Four ranked flow tables
Annual return rankings for major asset classes and a diversified Asset Allocation portfolio (25% S&P 500, 25% U.S. Aggregate and others), 2016 to YTD 2026.
Ranked quilt chart by year
Introduces the multi-asset Portfolio Solutions Group, led by CIO Jim Caron, and its ten-person team.
Intro text beside headshot grid
Describes the independent Asset Allocation Committee of senior MSIM and Eaton Vance professionals that vets the Portfolio Solutions Group's ideas.
Description with name roster
Glossary defining indices used in the guide, from the Bloomberg Commodity Index to the Bloomberg U.S. Aggregate Index.
Text-only glossary
Continues index definitions with MSCI, Morningstar LSTA, Nikkei 225, Russell and S&P indices.
Text-only glossary
Standard risk disclosures covering equity, foreign, EM, fixed income and alternative investment risks, stating that diversification does not eliminate the risk of loss.
Two-column disclosure text
Copyright, redistribution restrictions and issuing-entity notices for MSIM affiliates, including the EMEA section.
Text-only disclosure
Closing regional disclosures for Hong Kong, Singapore and Australia.
Text-only disclosure
Domande comuni su questa slide e il contenuto della presentazione sottostante.
It is Morgan Stanley Investment Management's The BEAT, a Quarterly Global Market and Asset Allocation Guide for Q4 2026 - November. It spans Top Views, Bonds, Equities, Alternatives, Transition and a Market Monitor of data tables and charts.
The deck has 92 pages in 4:3 (720x540) format, made in PowerPoint.
It suits investment strategists, wealth managers, advisors and research teams who produce market outlooks or asset allocation reviews. It is also a useful study example for analysts and presentation designers.
Most commentary pages use a headline, a one-sentence subtitle, a titled chart and a source footnote. The Market Monitor uses full-width tables, heat maps and ranked quilt charts of annual returns.
Yes. Pages 6, 8 and 10 show grids that rate assets from high conviction underweight to high conviction overweight, with dot markers, a change-from-previous arrow and numbered Points of Focus.
Yes. The contents page, section dividers, colour-coded section tags, chart pages, data tables and closing disclosure pages can be swapped for your own content and data.
Yes. Pages 88 to 92 contain index definitions, risk considerations, distribution notices and Asia Pacific notices, and most chart pages carry source and disclaimer footnotes.
No. The slides state the views are those of the portfolio management team, may change, and are not an investment or research recommendation. Treat the deck as an example of structure and design.
Publisher's series page for this quarterly market and asset allocation guide.

Create Your Own Slides
Turn your ideas into professional presentations in seconds with 2slides AI.
Fai riferimento a design professionali, scegli il tuo stile e genera slide con rendering del testo perfetto. Alimentato da Nano Banana—inizia a creare la tua presentazione ora.
Il Tuo Agente IA per le slide. Risparmia tempo, brilla più velocemente con la creazione intelligente di presentazioni.


© 2026 2slides. Tutti i diritti riservati.