
Honeywell Q2 2026 Earnings Presentation
Navigazione Rapida
Tag
Condividi le slide
Honeywell Q2 2026 Earnings Presentation
Vista dettagliata di ogni pagina di slide, inclusi layout, contenuto chiave ed elementi visivi.
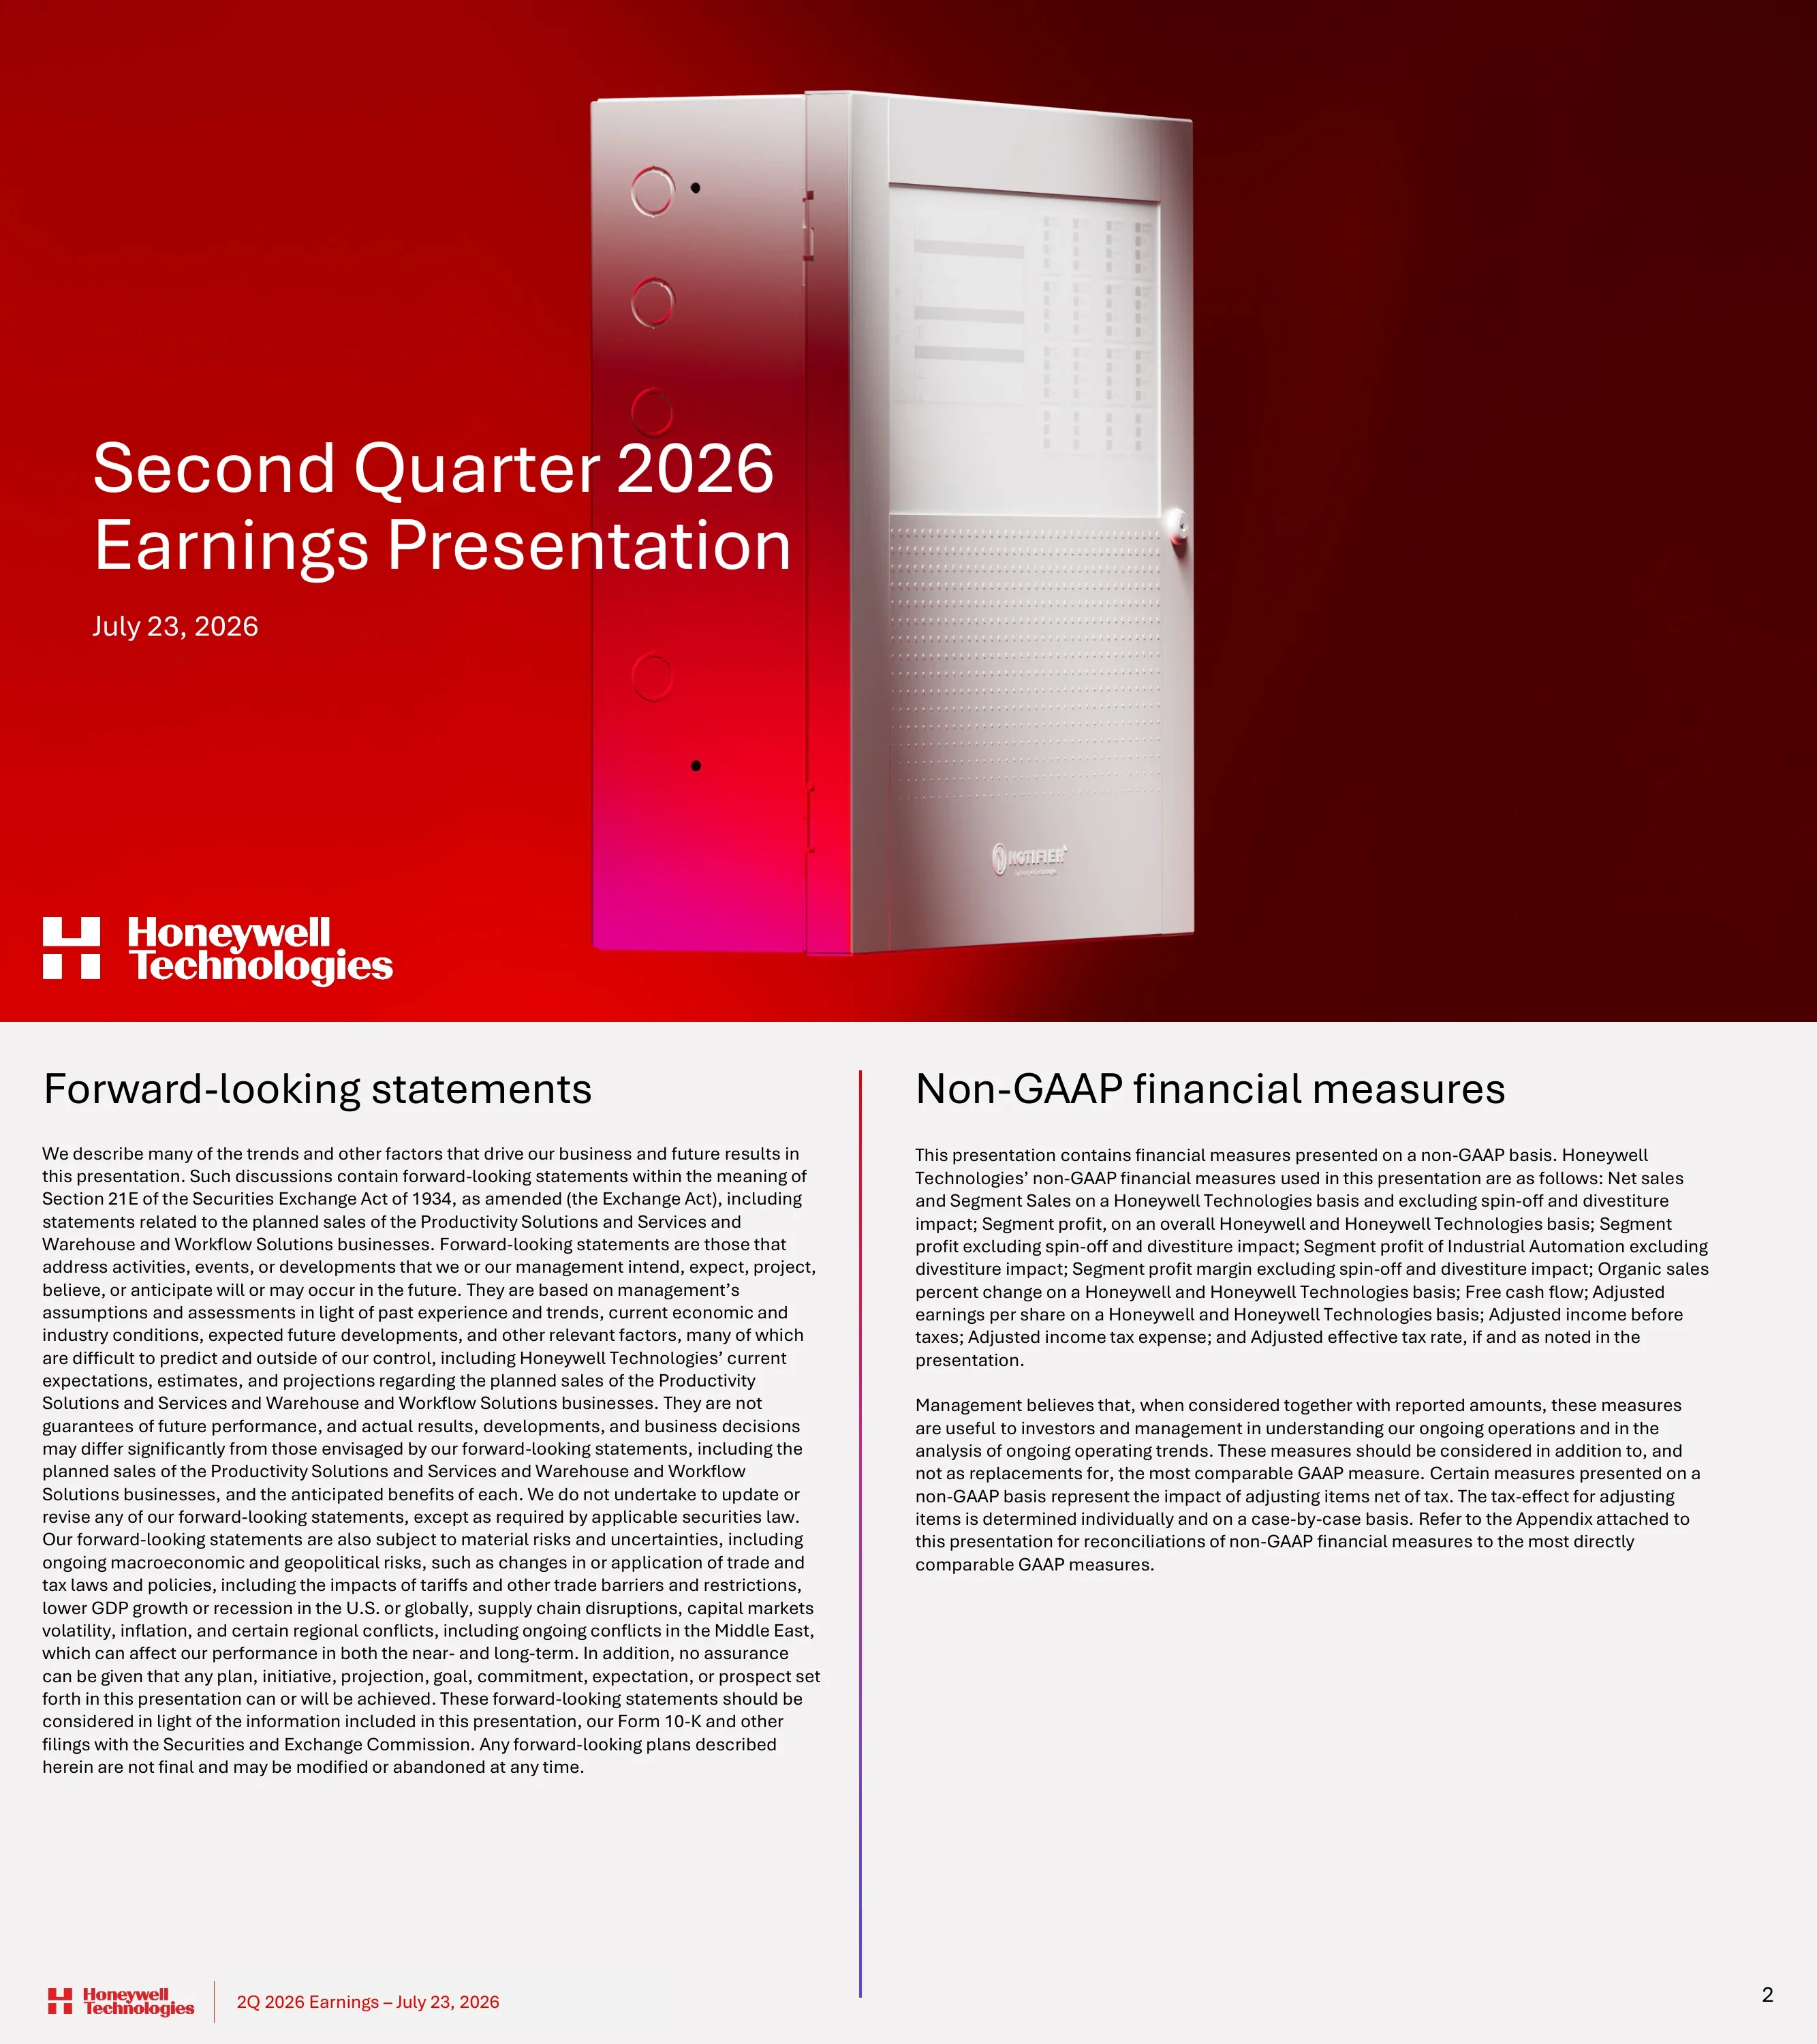
Cover slide for Honeywell Technologies' second quarter 2026 earnings presentation, dated July 23, 2026.
Full-bleed hero image on a deep red-to-maroon gradient with a magenta glow. White product render of a Notifier fire-alarm control panel sits center-right; large white two-line title with date left-aligned; white Honeywell Technologies 'H' logo bottom-left.
Legal disclaimers. On the left, Section 21E forward-looking statements, including risks related to the planned sales of the Productivity Solutions and Services and Warehouse and Workflow Solutions businesses, tariffs and Middle East conflicts. On the right, the list of non-GAAP measures used, such as organic sales, segment profit, adjusted EPS, free cash flow and adjusted effective tax rate.
Two text columns on a light grey background separated by a vertical red-to-violet gradient rule; large black headings; standard footer with logo, red date label and page number.
Six statements define the reporting basis. Former Aerospace Technologies results are excluded, and adjusted results are recast to remove Quantinuum. 2026 guidance includes Johnson Matthey Catalyst Technologies from its July 17, 2026 close and assumes the PSS/WWS divestitures close by early August. Adjusted EPS reflects the 1:2 reverse stock split effective June 29, 2026.
Single-column list of six one-line statements, each separated by a thin horizontal blue-violet-to-red gradient rule; white background; generous spacing.
Five numbered takeaways: (01) launched the 2029 three-year financial targets; (02) strong 2Q with an improved second half driven by PA&T and IA; (03) raising full-year organic sales, segment margin and EPS guidance; (04) closed the Johnson Matthey Catalyst Technologies acquisition on July 17; (05) concluded the portfolio transformation with the Aerospace spin, the Quantinuum IPO and the pending productivity/warehouse divestitures.
Vertical numbered list with oversized black numerals 01-05, each followed by a short red-to-violet vertical accent bar and one-line message; white background.
Investor Day takeaways: the company is now a pure-play automation leader moving 'from automation to autonomy'. Growth comes from growing and activating the installed base, a cycle of shared value creation, and AI through the Honeywell Technologies Forge solution, supported by the Accelerator operating system and a strong balance sheet.
Left column stacks three event photos (Forge demo wall, executive panel on stage, audience Q&A); right column has a 'Key Takeaways' heading with a gradient underline and bulleted and sub-bulleted text; full-width red takeaway banner at the bottom.
Four three-year targets: organic growth of 4%-6% (about 15% annual recurring software revenue growth), segment margin of about 24% (about 60 bps average annual expansion), adjusted EPS of about $12.00 (10%+ annual growth) and free cash flow above $3B (90%+ conversion). These rest on three pillars: durable growth acceleration, operational excellence and strategic capital deployment.
Row of four equal tiles with dark crimson-to-maroon gradients and white KPI text; below them, three pillar labels separated by vertical gradient rules; red banner reading 'Clear roadmap for shareholder value creation'.
The acquisition closed July 17 for £1.325 billion in an all-cash transaction. The rationale: complementary technology for end-to-end solutions, alignment with verticals in growing energy markets, and incremental ARR from an expanded installed base. A capability map shows how the two companies' technologies combine across refining/chemicals/gas, integrated low-carbon solutions (blue hydrogen, e-methanol) and future fuels (SAF and e-SAF).
Top-left Johnson Matthey logo and deal note; top-right 'Strategic rationale' gradient header bar with three bold-highlighted statements; lower grey panel holds a three-section flow diagram of outlined boxes (Honeywell) and navy-filled boxes (JM) linked by arrows and plus signs, with a legend; red bottom banner.
LTM organic orders growth rose from 1% (3Q25) to 3%, 6% and 11% (2Q26), and short-cycle orders growth jumped from 2%, 2% and 3% to 17%. Commentary: total orders were up 16% organically (PA&T +24%, BA +13%, IA +10%), Middle East orders grew more than 50%, and orders reached $5.7B with book-to-bill above 1.1x and backlog up 9%, supporting a 2H organic growth outlook of 4%-6%.
Two halves under gradient header bars ('Orders by quarter', '2Q commentary'). Left: combo chart with grey columns labeled with values and a teal line overlay for short-cycle growth. Right: six bullets. Red banner: 'Broad-based, double-digit order growth across all segments'.
Four KPIs compared 2Q25 vs 2Q26: sales of $5.0B to $5.2B (up 4% organic), segment margin of 18.0% to 19.0% (up 100 bps), adjusted EPS of $1.77 to $1.95 (up 10%) and free cash flow of $0.1B to $0.5B (about 4x). Plus and minus bullets explain the drivers, such as the seventh straight quarter of high-single-digit growth in BA, productivity, lower interest expense and Middle East collections headwinds.
Four equal columns separated by thin vertical rules; each has a bold KPI header with the growth figure in red, a paired bar chart (grey prior year, red current year) with value labels, and green-plus / red-minus driver bullets; red banner at the bottom.
Waterfall from 2Q25 adjusted EPS of $1.77 to 2Q26 of $1.95: segment profit +$0.21 (BA growth, pricing and productivity, lower corporate costs), below the line and other +$0.12, share count +$0.01 (319M vs 320M) and tax -$0.16 (higher adjusted effective tax rate). Total growth was 10%.
Horizontal waterfall chart: black start and end columns with a diagonal white axis-break stripe, mint-green floating bars for positives and a dark maroon bar for the negative, with bold value labels above and driver notes below; a mint circular 'Up 10%' badge; red banner.
2026 guidance was raised to sales of $19.8B-$20.0B (organic growth 3%-4%, up from 2%-3%), segment margin of 20.1%-20.5% (250-290 bps expansion, from 19.8%-20.3%), adjusted EPS of $8.05-$8.35 (from $7.90-$8.30) and free cash flow of about $2.0B. 3Q26 guidance is $4.9B-$5.0B sales and $2.05-$2.20 EPS; 4Q26 is $5.0B-$5.1B sales, 22.0%-22.7% margin and $2.28-$2.43 EPS.
Guidance matrix with row labels (Sales, Segment Margin, Adjusted EPS, FCF) and column headers colored grey (Prior), solid red (2026 Guidance) and outlined (3Q26, 4Q26); a violet chevron arrow marks the revision; a vertical gradient line separates annual from quarterly columns; right-hand grey 'Commentary' panel with a gradient header; footnotes; red banner.
Bridge from the prior FY26 guidance midpoint of $8.10 to the revised $8.20: 2Q outperformance +$0.17, improved 2H outlook +$0.03, PSS and WWS divestitures -$0.13 (lost operating income from the earlier close) and lower 2H interest expense +$0.03 (debt paydown from divestiture proceeds). The revised midpoint is up 27% year over year.
Same waterfall style as page 10: black anchor columns with axis-break stripes, mint positive bars, a maroon negative bar, annotations under each step and a mint 'Up 27% YoY' circle; red banner 'Raising guide on 2Q outperformance'.
Five investment-thesis points: a transformed and simplified portfolio; a differentiated pure-play global automation leader with secular tailwinds; a business model enabling 10%+ annual adjusted earnings growth with 90%+ FCF conversion; the option to compound growth through an annual recurring revenue focus using AI; and an execution culture built on the Accelerator operating system.
Same numbered-list template as page 4: oversized numerals 01-05 with red-to-violet vertical accent bars and one- or two-line statements on white.
Section divider that introduces the appendix.
Full-bleed solid Honeywell red with large white 'Appendix' title top-left; abstract geometric gradient blocks in magenta, pink and violet on the right; white footer logo.
A global pure-play automation company with about $17B in sales, about $4B in segment profit and about a 22% segment margin (2025, excluding PPE/PSS/WWS). Sales by segment: BA 42%, PA&T 37%, IA 21%. By business model: Products about 40%, Aftermarket Services about 30%, Projects about 20%, Software above 10%. By region: Americas 43%, Europe 21%, Middle East and Africa 15%, Asia Pacific 14%, China 7%.
Bold subheading, then three large KPI numbers across the top; a light grey panel holds three donut charts (red shades by segment, magenta/purple shades by business model with 'Monetize/Grow installed base' arcs, indigo/lavender shades by region), each with a legend; footnotes; red banner.
Building Automation: $2,002M sales (up 9% organic) and a 27.1% margin (up 90 bps), with orders up 13%. Process Automation & Technology: $1,679M (down 1% organic) and a 22.1% margin (down 180 bps), with orders up 24% on LNG demand. Industrial Automation: $1,501M (up 4% organic) and a 17.2% margin (up 90 bps), with orders up 10%.
Table with dark maroon header cells (Sales, Segment Margin change, Commentary), grey segment-name column on the left, large centered figures, and three to four commentary bullets per row separated by thin rules; red banner 'Strong growth and margin expansion in BA and IA, offsetting headwinds in process'.
Reported vs organic growth by segment and sub-line: BA 10%/9% (Products 11%/10%, Solutions 8%/7%); PA&T 4%/(1%) (Aftermarket (2%)/(6%), Projects 13%/5%); IA (5%)/4% (Products (11%)/1%, Solutions 11%/10%).
Clean data table with two solid red column headers (2Q Reported, 2Q Organic); segment rows are bold on light grey bands and sub-rows are plain on white; negatives shown in parentheses.
Below-the-line modeling inputs: 2026E total corporate about ($605M) vs prior guidance about ($620M) and 2025 actual ($884M); net interest about ($465M); total below the line about ($765M); adjusted effective tax rate about 19%; share count 319M. Also 2Q26 results (total corporate $187M, below the line $179M, tax about 21%) and 3Q26/4Q26 guidance.
Wide two-block table: left block has black/grey column headers (2025, Prior 2026 guide, 2026E); right block has red-outlined headers (2Q26 Results, 3Q26, 4Q26 Guidance), separated by a violet chevron; bold subtotal rows on grey; footnotes.
Quarterly sales and organic growth from FY23 to 2Q26 for each segment and sub-line. Examples: BA grew from $6,031M (FY23) to $7,367M (FY25) and $2,002M in 2Q26 (+9%); PA&T was $6,437M in FY25 and $1,679M in 2Q26 ((1%)); IA fell from $7,659M (FY23) to $6,111M (FY25) and was $1,501M in 2Q26 (+4%).
Dense 13-column data grid with black quarter headers and maroon-highlighted fiscal-year columns shaded pale pink; bold segment totals and organic-growth rows, lighter sub-rows for Products/Solutions/Aftermarket/Projects.
Brand interstitial slide showing the Honeywell Technologies logo and the tagline 'At the heart of it'. It separates the summary appendix from the non-GAAP reconciliations.
Full-bleed aerial city skyline photo at dawn, split into quadrants; red logo top-left of center; lower-right quadrant has a red-to-violet translucent gradient overlay with white tagline text.
Introductory text on the non-GAAP reconciliations. It explains the Separation Adjustments related to the Honeywell Aerospace separation (unaudited best estimates), the usefulness and limitations of non-GAAP measures, and why some forward-looking measures are not reconciled.
Centered bold 'Appendix' label, left bold subheading and four justified full-width text paragraphs on white; standard footer.
2Q26 reconciliation from reported to organic sales change. Total Honeywell: 4% reported, (2)% divestitures, 1% FX, 1% acquisitions, 4% organic, and 4% for Honeywell Technologies. BA 10% to 9%; PA&T 4% to (1)% after a 5% acquisition impact; IA (5)% to 4% after a (9)% divestiture impact.
Four small reconciliation schedules arranged in a 2x2 grid (Total Honeywell, PA&T, BA, IA) with single and double accounting underlines; footnote and definitional paragraphs below.
Quarterly 1Q24-1Q26 reconciliations for BA, PA&T and IA. BA organic growth was 8% in 2025 and 8% in 1Q26; PA&T was flat in 2025 and (6)% in 1Q26; IA was (1)% in 2025 and 1% in 1Q26 after divestiture impacts of up to (16)%.
Three stacked 11-column tables, one per segment, with grey-shaded full-year columns (2024, 2025) and accounting underlines.
2Q26 net sales of $9,719M less Separation Adjustments of $4,532M gives Honeywell Technologies net sales of $5,187M, compared with $9,322M less $4,307M = $5,015M in 2Q25.
Small three-row table placed center-right with double underlines on totals; one footnote; mostly white space.
2025 Honeywell net sales of $37,442M less Quantinuum, Aerospace ($17,510M), PSS ($1,132M), WWS ($933M) and PPE ($382M) gives segment sales of $17,455M excluding spin-off and divestitures. IA falls from $6,098M to $3,651M, IA Products from $4,284M to $2,999M, and IA Solutions from $1,814M to $652M.
Single-column, four-block reconciliation schedule ($M) centered on the page with subtotal underlines; footnote and definition paragraph at the bottom.
Operating income to segment profit for 2Q25, 3Q25, 4Q25 and FY2025, split into Honeywell, Separation Adjustments and Honeywell Technologies. FY2025 Honeywell Technologies segment profit was $3,507M on $19,915M of sales (17.6% margin), including add-backs for a $724M goodwill impairment and a $270M impairment of assets held for sale. 2Q25 margin was 18.0%.
Wide 12-column financial table grouped by period with three sub-columns each; itemized adjustment rows followed by margin calculations; nine numbered footnotes.
2Q26 Honeywell Technologies operating income of $662M plus adjustments (including $92M amortization, $74M repositioning, $55M Quantinuum loss and $48M impairment) gives segment profit of $985M on $5,182M of sales, a 19.0% margin (operating margin 12.8%). Total Honeywell segment profit was $2,240M (23.1%).
Centered three-column table (Honeywell, Less Separation Adjustments, Honeywell Technologies) with itemized add-backs and margin rows; footnotes below.
2025 operating income of $5,573M gives segment profit of $8,314M. Removing $4,434M of spin-off and divestiture impact leaves $3,880M on $17,455M of sales, a 22.2% margin. This figure supports the '~$4B segment profit / ~22% margin' on page 15.
Right-aligned three-column table for 2025 with itemized adjustments and margin rows; seven footnotes and several paragraphs of definitions.
2Q26 Honeywell Technologies GAAP EPS was $16.65, inflated by a ($15.87) gain on the deconsolidation of Quantinuum. Adjusting for that and other items gives adjusted EPS of $1.95, compared with 2Q25 GAAP EPS of $1.21 and adjusted EPS of $1.77. Total Honeywell adjusted EPS was $4.52 vs $4.72.
Six-column table (two periods x Honeywell / Separation Adjustments / Honeywell Technologies) with 13 adjustment rows; 14 numbered footnotes in small type.
3Q25 Honeywell Technologies GAAP EPS of $2.99 reconciles to adjusted EPS of $1.70 after a ($2.51) Resideo agreement termination gain and other items. 3Q26 guidance is $1.75-$1.90 GAAP EPS and $2.05-$2.20 adjusted EPS.
Four-column table (three 3Q25 columns plus a 3Q26E guidance column showing 'No Forecast' entries); 12 footnotes below.
4Q25 Honeywell Technologies GAAP EPS of ($1.77) reconciles to adjusted EPS of $1.83, driven by add-backs of $2.27 for goodwill impairment and $0.61 for impairment of assets held for sale. 4Q26 guidance is $1.93-$2.08 GAAP EPS and $2.28-$2.43 adjusted EPS.
Same four-column format as page 30 with 13 numbered footnotes.
FY2025 Honeywell Technologies GAAP EPS of $3.24 reconciles to adjusted EPS of $6.46, while total Honeywell adjusted EPS was $18.46. 2026E guidance is GAAP EPS of $21.05-$21.35, including a ($15.85) Quantinuum deconsolidation gain, and adjusted EPS of $8.05-$8.35.
Four-column table with 20 adjustment rows and double-underlined totals; no footnotes on this page (they continue on page 33).
Twenty footnotes supporting the FY2025/2026E EPS reconciliation. Examples: 2026E weighted shares of about 319.0M, expected 2026 debt restructuring costs of $228M, the $802M Resideo gain, and a $724M IA goodwill impairment. The page also defines adjusted EPS.
Full-page numbered footnote list in small type, followed by two definition paragraphs.
2025 Honeywell Technologies income before taxes of $1,305M adjusts to $2,646M, and income tax expense of $291M adjusts to $518M. That gives a 22.3% effective tax rate and a 19.6% adjusted rate, compared with 18.4% and 18.8% for total Honeywell.
Three-column table in two stacked blocks (pre-tax income adjustments, tax expense adjustments) followed by rate calculations; single footnote.
Defines adjusted income before taxes, adjusted income tax expense and adjusted effective tax rate. It explains that GAAP effective tax rate guidance is not given because pension income, the Quantinuum equity loss and one-off items cannot be reliably predicted.
Heading plus two short justified paragraphs at the top; the rest of the slide is white space.
2Q26 Honeywell Technologies operating cash flow of $563M, less $187M capex, plus $49M of separation payments and $31M Quantinuum, gives FCF of $456M, compared with $114M in 2Q25. Total Honeywell FCF was $1,252M vs $878M. The 2026E Honeywell Technologies FCF range is about $1.8B-$2.1B.
Seven-column table (2Q26 and 2Q25 by entity, plus a 2026E column) with double-underlined FCF totals; footnote and two definition paragraphs below.
Domande comuni su questa slide e il contenuto della presentazione sottostante.
The deck has 36 landscape (16:9) slides. It opens with a cover, disclaimers, basis of presentation and key messages. Next come the 2026 Investor Day strategy and three-year targets, the Johnson Matthey Catalyst Technologies acquisition, orders growth, the 2Q financial summary, an adjusted EPS bridge, revised 2026 guidance, a full-year EPS bridge and an investment thesis. The appendix covers the company profile, segment results, sales growth tables, 2026 modeling inputs, historical sales by business model and about 15 pages of non-GAAP reconciliations.
According to the slides, Honeywell Technologies reported 2Q26 sales of $5.2B (up 4% organically), a segment margin of 19.0% (up 100 bps), adjusted EPS of $1.95 (up 10% from $1.77) and free cash flow of about $0.5B ($456M), roughly 4x the prior year. Orders were $5.7B, up 16% organically, with book-to-bill above 1.1x.
The revised 2026 guidance on slide 11 is sales of $19.8B-$20.0B with 3%-4% organic growth (previously $19.9B-$20.2B and 2%-3%), segment margin of 20.1%-20.5% (previously 19.8%-20.3%), adjusted EPS of $8.05-$8.35 (previously $7.90-$8.30) and free cash flow of about $2.0B. Total sales are lower because the PSS and WWS divestitures closed earlier than planned. Slide 12 bridges the EPS midpoint from $8.10 to $8.20.
The Investor Day slide lists four targets: 4%-6% organic growth with about 15% annual recurring software revenue growth; a segment margin of about 24% with about 60 bps average annual expansion; adjusted EPS of about $12.00 with 10%+ annual growth; and free cash flow above $3B with 90%+ conversion.
The deck puts the story up front in about 13 slides and moves detail to the appendix. Each content slide makes one point, stated in a full-width red takeaway banner at the bottom. Colors stay consistent throughout: grey for the prior year and red for the current year in bar charts, and mint for positive and maroon for negative steps in the waterfalls. Guidance is shown as a prior-vs-new table with a chevron marking the revision. Numbered 01-05 lists with gradient accent bars carry the narrative slides, and every page shares one footer with logo, event date and page number.
The style is modern and corporate. It uses a strong Honeywell red with deep crimson-to-bright-red gradient header bars, thin red-to-violet gradient divider lines and clean black sans-serif titles on white. The cover and divider slides are full-bleed: a product render on a crimson gradient, a solid-red appendix divider with magenta and violet light shapes, and a skyline photo with the tagline 'At the heart of it'. Donut charts in red, magenta and indigo palettes add variety in the appendix.
Yes. The gallery page offers the original PDF and an editable PPTX. The PPTX was machine-converted from the PDF, so check fonts, charts and table alignment before reusing it as a template. The official source is the Honeywell investor relations site.
Honeywell reports many non-GAAP measures, including organic sales, segment profit, adjusted EPS, adjusted effective tax rate and free cash flow. After the Aerospace spin-off and the Quantinuum deconsolidation, each figure must be reconciled from consolidated Honeywell through 'Separation Adjustments' to Honeywell Technologies. Slides 21-36 provide these reconciliations. For example, 2Q26 GAAP EPS of $16.65 includes a $15.87 Quantinuum gain and reconciles to adjusted EPS of $1.95.
Official source of the Second Quarter 2026 Earnings Presentation (July 23, 2026), published by Honeywell Technologies.

Create Your Own Slides
Turn your ideas into professional presentations in seconds with 2slides AI.
Fai riferimento a design professionali, scegli il tuo stile e genera slide con rendering del testo perfetto. Alimentato da Nano Banana—inizia a creare la tua presentazione ora.
Your AI Agent for slides. Save time, shine faster with intelligent presentation creation.




© 2026 2slides. All rights reserved.