
Fa parte di Esempi di presentazioni per investitori
Gerdau Q3 2026 Earnings Presentation: the 20-slide '3Q26 Earnings Release' deck from Brazil's largest long-steel producer, dated October 27, 2026 and filed with the SEC as an exhibit to Form 6-K. Figures are in Brazilian reais (R$) unless stated otherwise. It covers adjusted EBITDA of R$3.8 billion (+10% vs. 2Q26), adjusted net income of R$1.5 billion (R$0.79 per share), free cash flow of R$1.4 billion and leverage of 0.58x net debt/EBITDA, with North America contributing 76% of consolidated EBITDA at a 27.7% margin, the highest in four years. The appendix breaks down Brazil, North America and South America by shipments, net sales, EBITDA and utilization, plus steel import penetration and trade-defense measures in Brazil, cash flow bridges, debt maturities, shareholder returns, capex guidance of R$4.7 billion and progress on the Miguel Burnier mining, Pindamonhangaba recycling and Midlothian expansion projects. Because the 6-K exhibit was filed as rasterised slide images, the deck is image-based; some footnotes are small print.
Usa la copertina di questa presentazione come riferimento di stile per slide create con i tuoi contenuti. Oppure scegli una pagina qui sotto per usarne il layout come riferimento.
Navigazione Rapida
Tag
Condividi le slide
Gerdau Q3 2026 Earnings Presentation: the 20-slide '3Q26 Earnings Release' deck from Brazil's largest long-steel producer, dated October 27, 2026 and filed with the SEC as an exhibit to Form 6-K. Figures are in Brazilian reais (R$) unless stated otherwise. It covers adjusted EBITDA of R$3.8 billion (+10% vs. 2Q26), adjusted net income of R$1.5 billion (R$0.79 per share), free cash flow of R$1.4 billion and leverage of 0.58x net debt/EBITDA, with North America contributing 76% of consolidated EBITDA at a 27.7% margin, the highest in four years. The appendix breaks down Brazil, North America and South America by shipments, net sales, EBITDA and utilization, plus steel import penetration and trade-defense measures in Brazil, cash flow bridges, debt maturities, shareholder returns, capex guidance of R$4.7 billion and progress on the Miguel Burnier mining, Pindamonhangaba recycling and Midlothian expansion projects. Because the 6-K exhibit was filed as rasterised slide images, the deck is image-based; some footnotes are small print.
Vista dettagliata di ogni pagina di slide, inclusi layout, contenuto chiave ed elementi visivi.
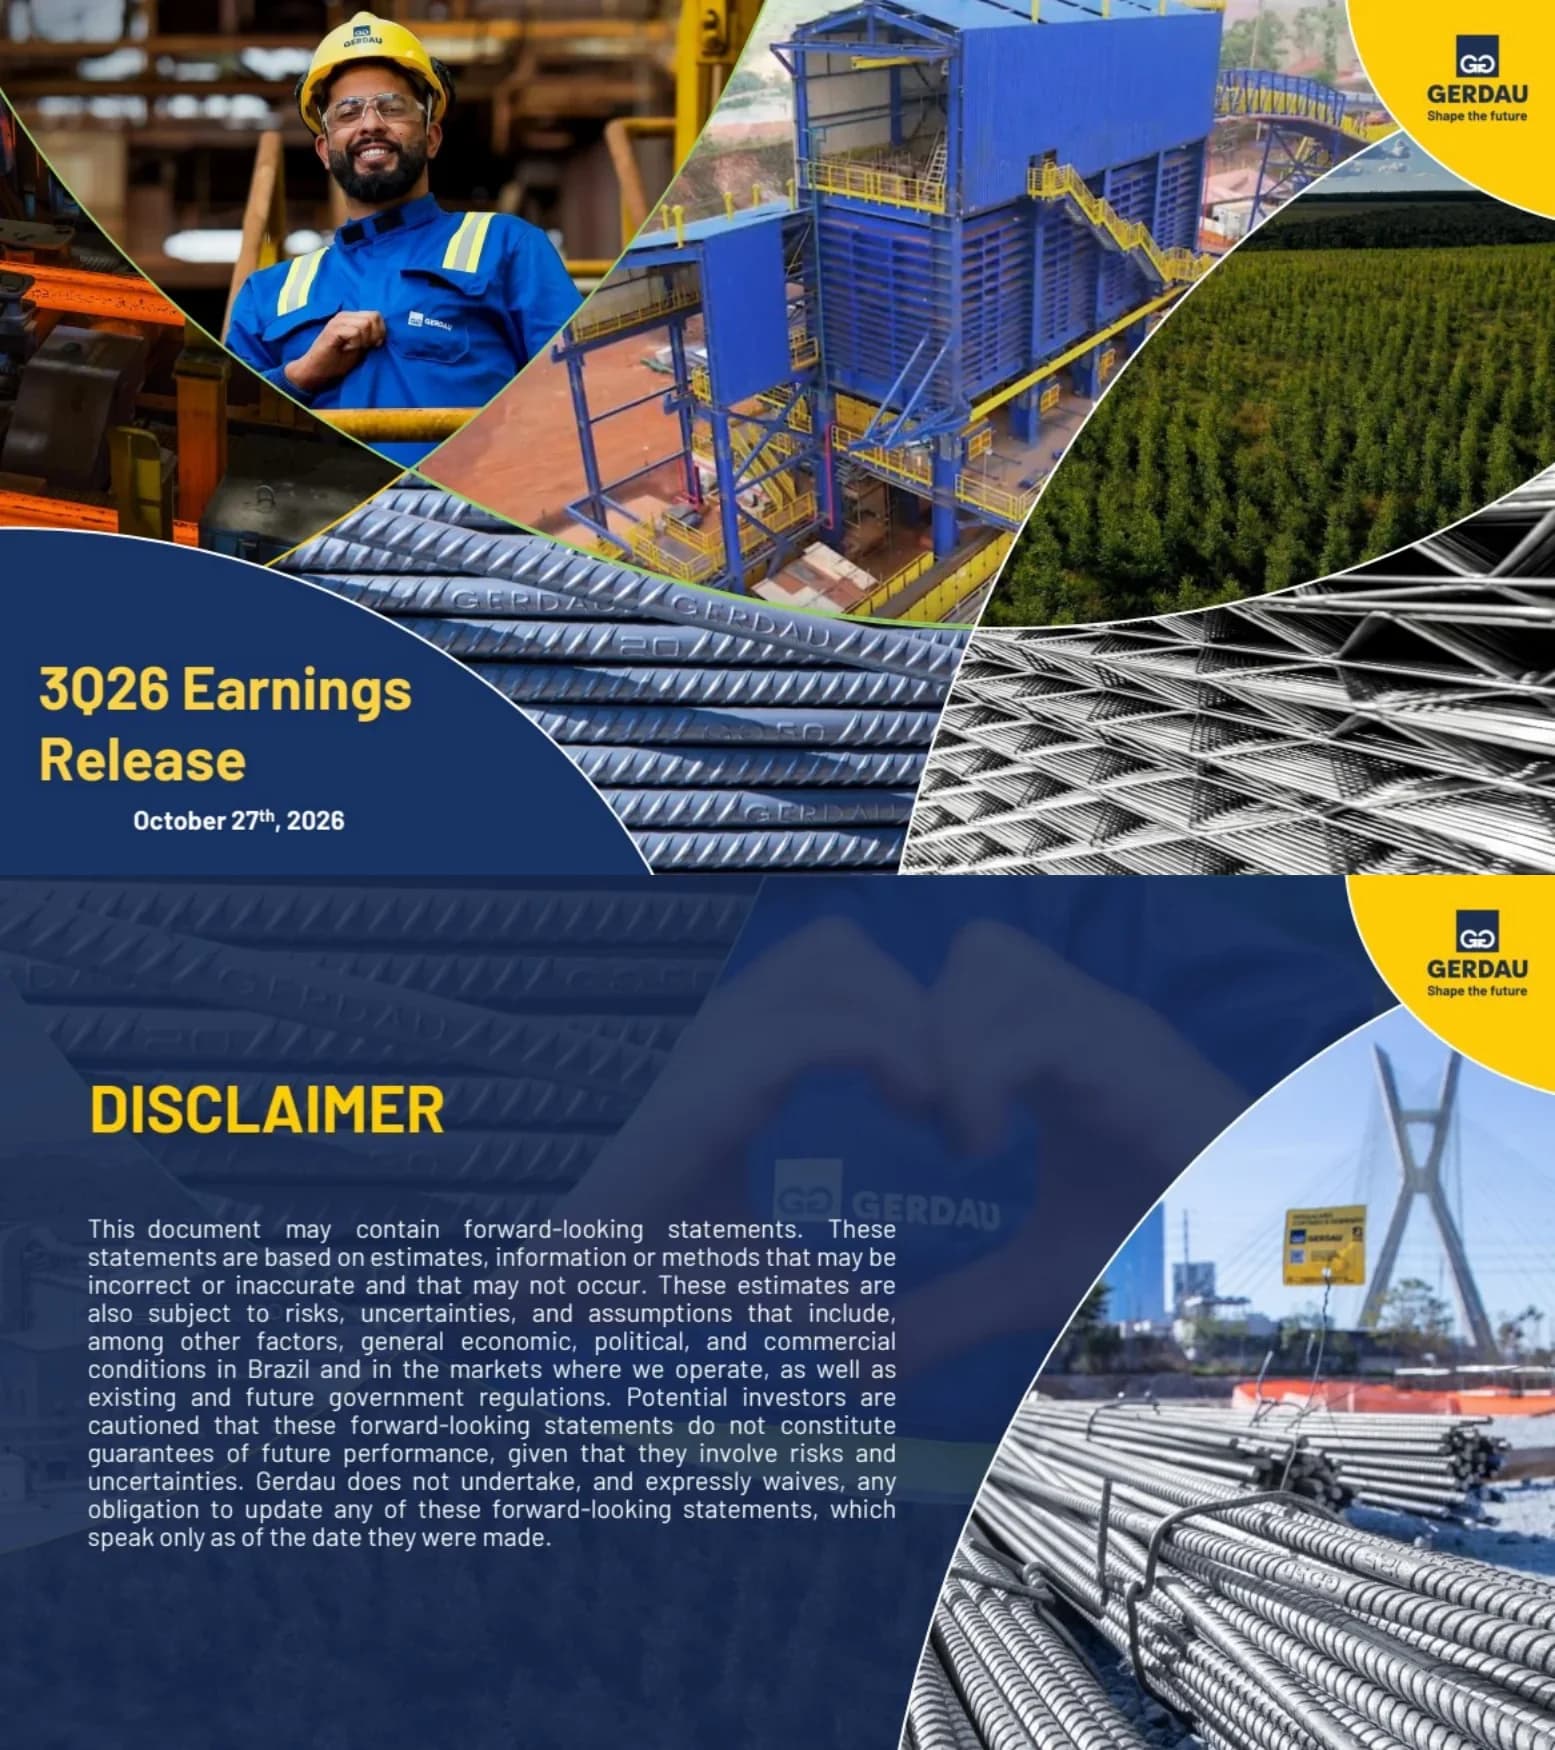
Cover slide titled '3Q26 Earnings Release', dated October 27th, 2026, with the Gerdau logo and 'Shape the future' tagline in a yellow corner badge.
Full-bleed photo collage split by curved dividers (worker in hard hat, blue industrial plant, eucalyptus forest, rebar bundles, steel mesh), with a navy curved panel bottom-left holding the yellow title and white date.
Forward-looking statements disclaimer: statements rely on estimates subject to risks including economic, political and commercial conditions in Brazil and other markets and government regulation; they do not guarantee future performance and Gerdau waives any obligation to update them.
Yellow 'DISCLAIMER' heading and justified white paragraph on a translucent navy overlay at left; curved photo of rebar at a São Paulo construction site with the Octávio Frias cable-stayed bridge at right.
Four highlights: shipments of 2.9 Mt of steel, stable vs. 2Q26 on resilient demand; strong North America results, with EBITDA at 76% of consolidated EBITDA and a 27.7% margin, the highest in four years; gradual improvement in Brazil, a slight recovery despite pressure from imports and high steel supply; and project progress, with the Pindamonhangaba recycling center now operating and Miguel Burnier in final integrated testing with start-up expected in 4Q26.
2x2 grid of navy cards, each with a photo on the left and a yellow uppercase headline plus short body text on the right; yellow vertical band with the slide title on the far left.
KPI summary: adjusted EBITDA of R$3.8 billion (+10% vs. 2Q26, on better results in North America and Brazil); adjusted net income of R$1.5 billion (+4%) and EPS of R$0.79 vs. R$0.74 in 2Q26; leverage of 0.58x net debt/EBITDA; RCF renewed and expanded to US$1.125 billion (+29% availability, maturing 2031); 9M26 capex of R$3.1 billion (66% of the year's plan); 3Q26 free cash flow of R$1.4 billion on lower working capital consumption; 3Q26 dividends of ~R$667 million (R$0.34/share) at Gerdau S.A. and ~R$212 million (R$0.16/share) at Metalúrgica Gerdau S.A., payable December 15, 2026; Fitch (Jul/26) and S&P (Oct/26) revised outlook from Stable to Positive.
Two columns of eight yellow-outlined dark boxes, each with a line icon, an uppercase label, a large yellow figure and a one-line explanation; footnote notes EPS is based on corporate net income.
Qualitative 4Q26 outlook (not guidance). North America, stable margin: lower volumes and higher scrap costs on seasonality, a solid backlog driven by renewable energy and data center demand, higher prices, a scheduled maintenance shutdown at Midlothian, ongoing USMCA negotiations with no concrete sign of tariff changes, and U.S. election developments as a volatility source. Brazil, margin compression: seasonal domestic slowdown and higher exports hurting mix, price pressure with elevated input costs (mainly coal), start-up of the Miguel Burnier mining project, progress on antidumping duties for hot-rolled coils and wire rod, and apparent consumption pressured by high inflation and interest rates. Closing line: continued discipline in capital allocation and operational efficiency.
Two side-by-side dark panels (North America, Brazil), each with a yellow region header, a yellow margin verdict and a bullet list; a yellow tagline spans the bottom.
Q&A divider with instructions for the videoconference: raise a hand with name and institution, wait to be announced, then accept the prompt to enable microphone and camera.
Navy left half with the large Gerdau logo, tagline, instructions and a yellow 'Q&A' block; close-up photo of tied rebar cages on the right behind a curved divider.
Section divider introducing the appendix (with a faint 'ANEXOS' watermark from the Portuguese version).
Same split layout as the Q&A slide: navy panel with logo and a yellow 'Appendices' label at left, photo of flat-steel coils branded Gerdau at right.
Accident frequency rate (accidents per million hours worked) of 0.69 in 3Q26. Annual history: 0.99 (2015), 1.16, 1.28 (2017 peak), 1.10, 1.08, 0.87, 0.83, 0.76, 0.70, 0.59 (2024), 0.73 (2025); quarterly 0.84 (1Q26), 0.57 (2Q26), 0.69 (3Q26).
Yellow left half with title, subtitle and a photo of two smiling employees in hard hats; navy right half with a white bar chart and the current quarter highlighted in yellow.
Brazil division: utilization 67% rolled steel, 77% crude steel. Shipments 1,351 kt (-0.1% vs. 2Q26; 1,582 in 3Q25), with a 5.9% domestic increase mainly in flat steel offsetting lower exports. Net sales R$6,948 million (+3.9%; 6,686 in 2Q26, 7,697 in 3Q25) on better mix and some domestic price gains. EBITDA R$741 million (+5.2%), margin 10.7% (10.5% in 2Q26, 9.9% in 3Q25). COGS +2.4% on value-added mix, shutdowns and coal. Steel imports +19.8% vs. 2Q26, flat imports +33.8%; apparent consumption +6.3%. Portfolio ~70% long / 30% flat (rebar 30%, bars/beams/SBQ 40%, HRC and plates 20%, slabs 10%); markets ~45% industry/agriculture, ~40% civil construction, ~15% automotive.
Navy left sidebar with the region flag tag and four bullets; upper right has a yellow utilization banner and three three-bar charts (shipments, net sales, EBITDA with margin line); a yellow lower band holds a product donut and market-split icons.
Brazil steel imports (Mt, Comexstat): 2.2 (2019), 2.0, 4.0, 3.1, 4.4, 4.8, 5.8 (2025) and 5.0 estimated for 2026 (Jan–Sep annualized), split by within/outside the Gerdau portfolio; quarterly 1.6 (1Q26), 1.0 (2Q26), 1.2 (3Q26), with origin pies showing China at 65%, 41% and 28% and new origins rising to 40% in 3Q26. Import penetration (Brazil Steel Institute): flat 24.0% in 2025 to 21.6% in 9M26, total 20.8% to 18.5%, long 15.8% to 13.5%, all above pre-COVID levels. Trade defense: quota plus 25% tariff on 17 NCMs (10 in Gerdau's portfolio) renewed until Jun/2027; 25% rate on drawn products; antidumping on flat bar valid through 2027 and plate through 2030; hot-rolled coils positive preliminary decision and wire rod final decision by Dec/2026; production-chain mobilization on trade defense.
Upper-left stacked bar chart plus three origin pie charts; upper-right navy line chart of import penetration; full-width blue lower band with a four-column trade-defense table using green check marks.
North America division (US, Canada, Mexico): utilization 87% rolled steel, 83% crude steel. Shipments 1,313 kt (-2.5% vs. a record 1,347 in 2Q26; 1,293 in 3Q25). Net sales R$10,512 million (+3.8%; 10,126 in 2Q26, 9,185 in 3Q25), with net sales per ton in U.S. dollars up 4.7%. EBITDA R$2,912 million (+12.0%), margin 27.7% (25.7% in 2Q26, 19.8% in 3Q25). Backlog above historical averages on non-residential construction, data centers and renewable energy; COGS -0.4%. Portfolio 100% long steel (shapes 50%, bars 45%, downstream 5%); markets ~60% manufacturing, energy and automotive, ~40% non-residential construction and infrastructure.
Same segment template as the Brazil slide: navy bullet sidebar with US, Canada and Mexico flags, utilization banner, three bar charts with change bubbles, and a yellow lower band with donut and market icons.
South America division (Uruguay, Argentina, Peru): utilization 78% rolled steel, 54% crude steel. Shipments 309 kt (+9.7% vs. 282 in 2Q26), driven by Peru's civil construction market, which posted record sales in August. Net sales R$1,440 million (+12.6%) on Peru volumes and a 1.7% USD/BRL appreciation. Adjusted EBITDA R$160 million (-22.0% vs. 205), margin 11.1% (16.0% in 2Q26, 17.0% in 3Q25) due to scheduled shutdowns and lower fixed-cost dilution; COGS +17.7%, mainly from maintenance in Argentina. Portfolio 100% long steel (bars and beams 80%, downstream and others 20%); markets ~70% distribution, ~20% civil construction, ~10% industry.
Third instance of the segment template with Uruguay, Argentina and Peru flags; the EBITDA chart uses a red negative change bubble.
Adjusted EBITDA bridges (R$ million): 2Q26 3,430 (19.2% margin) to 3Q26 3,771 (20.2%), +10%, with North America +312, Brazil +36, South America (45), eliminations +38; 3Q25 2,737 (15.2%) to 3,771, +38%, led by North America +1,092. Net sales bridges: 2Q26 17,871 to 3Q26 18,691 (+5%), North America +386, Brazil +262, South America +161, eliminations +11; 3Q25 17,983 to 18,691 (+4%), North America +1,328, Brazil (748), South America +63, eliminations +65. Net sales include iron ore and co-products.
Four waterfall charts in a 2x2 grid (EBITDA left, net sales right; quarter-on-quarter top, year-on-year bottom) with stacked start and end bars colored by division and green percentage callouts.
Cash flow (R$ million): 3Q26 adjusted EBITDA 3,771, less working capital (272), income tax (548), capex (1,101), interest (69), JV proportional EBITDA (189), intangibles and leasing (179), plus other 27, giving free cash flow of 1,439. Net cash variation: 2Q26 cash 5,440 plus FCF 1,439, financing (127), dividends (426), share buyback (32), M&A (292), FX and other +40, ending 3Q26 cash at 6,043. Footnotes explain each line item in small print.
Two horizontal waterfall charts stacked vertically on a white and light-grey background, navy start/end bars, yellow deduction blocks and a green free-cash-flow bar.
Cash, debt and leverage (R$ billion): gross debt 18.6 (3Q25), 14.2, 13.8, 13.6, 13.7 (3Q26); cash 6.0 and net debt 7.7 in 3Q26; net debt/adjusted EBITDA 0.81x, 0.76x, 0.74x, 0.69x, 0.58x. Liquidity of R$11.8 billion (6.0 cash, 4.5 RCF plus 1.3 from the +29% RCF renewal) against a maturity schedule with 0.9 bonds and 0.9 bank loans in 2027, debentures in 2028–2032, 3.4 bonds plus 0.3 in 2035 and 2.8 plus 0.3 from 2036. Average term 7.5 years; average cost CDI -0.21% for BRL and 6.13% for USD. Financial policy: gross debt below R$12 billion (not yet met), average term over 6 years and net debt/EBITDA of 1.5x or lower (both met). Ratings: Fitch BBB Positive, S&P BBB Positive, Moody's Baa2 Stable.
Left stacked bar chart with leverage line overlay; right liquidity bar with dashed RCF segment and a debt amortization bar chart joined by dotted lines and an average term/cost callout; navy footer with financial policy icons and rating agency logos.
Dividends plus buybacks (R$ million): 769 in 3Q25 (555 + 213), 381 in 4Q25, 560 in 1Q26, 556 in 2Q26 and 699 in 3Q26 (667 dividends + 32 buyback); payout 74.9%, -30.9%, 58.8%, 40.3% and 47.3%. 3Q26 dividends: Gerdau S.A. R$667 million (R$0.34/share), Metalúrgica Gerdau R$212 million (R$0.16/share). 2026 buyback: Gerdau S.A. up to 56.4 million shares, R$344.1 million repurchased by October 9, 2026 (GGBR4/GGBR3), 32% of the program done, 84% of repurchased shares cancelled; Metalúrgica Gerdau up to 10 million preferred shares, R$21.4 million repurchased (GOAU4), 22% done, 100% cancelled.
White left side with a stacked bar chart plus payout line and a dark rounded dividend table; navy right panel with two buyback program summaries, each with a progress donut.
2026 capex guidance of R$4.7 billion, 66% executed in 9M26 (about 55% in US$ and 45% in R$ by currency exposure). 3Q26 capex R$0.9 billion (about R$0.5 billion competitiveness, R$0.4 billion maintenance); 9M26 capex R$3.1 billion (R$1.7 billion competitiveness, R$1.4 billion maintenance). Excludes jointly controlled entities and associates. Photo shows the grinding area of the Miguel Burnier sustainable mining platform.
Curved photo strip on the left; navy content area with a yellow-outlined guidance banner and two donut charts with totals in the center.
Miguel Burnier mining: 99% physical / 92% financial progress, start-up 2H26, potential EBITDA ~R$1.1 billion, capex ~R$3.6 billion. Pindamonhangaba recycling center: 98% / 89%, start-up 2H26, potential EBITDA ~R$100 million, capex ~R$400 million. Midlothian expansion Phase 1: 93% / 96%, start-up 2H26, potential EBITDA ~R$275 million, capex ~R$1.2 billion.
Three light-grey project cards side by side, each with a title, two progress rings, start-up, potential EBITDA and capex lines, and a captioned photo at the bottom (grinding, scrap yard, Midlothian unit).
Save-the-date for the Gerdau Investor Day 2026 on December 4th in São Paulo, held with APIMEC Brasil.
Blue background with large abstract diagonal stripes; centered event wordmark, yellow date and white city; APIMEC and Gerdau logos at bottom right.
Closing slide with IR contacts (inform@gerdau.com, ri.gerdau.com), the 4Q26 earnings release date of February 16, 2027 and videoconference on February 17, 2027, and links to Gerdau's social media channels.
Translucent navy overlay on the brand photo collage, with contacts across the top, two date blocks left and right, and a row of social icons at the bottom.
Domande comuni su questa slide e il contenuto della presentazione sottostante.
It is the 20-slide '3Q26 Earnings Release' deck Gerdau S.A. presented on October 27, 2026 for its third-quarter 2026 results. It covers highlights, consolidated financials, the 4Q26 outlook, and an appendix with safety, Brazil, North America and South America segment results, steel imports, cash flow, debt, shareholder returns and capex projects.
Gerdau is a Brazilian company listed on B3 and on the NYSE (GGB). As a foreign private issuer it filed this presentation with the SEC as an exhibit to Form 6-K, and it is also published on its investor relations site, ri.gerdau.com. The filed slides are rasterised images, so some small footnotes are hard to read at normal resolution.
Almost all figures are in Brazilian reais (R$), including North America and South America results, which are translated into reais. The exceptions are the revolving credit facility (US$1.125 billion) and the USD average cost of debt.
Adjusted EBITDA was R$3.8 billion (R$3,771 million, 20.2% margin), up 10% vs. 2Q26; adjusted net income was R$1.5 billion with EPS of R$0.79; free cash flow was R$1.4 billion; shipments were 2.9 Mt; and leverage fell to 0.58x net debt/EBITDA. North America generated 76% of EBITDA at a 27.7% margin.
Yes. The page offers the original PDF and a PPTX version converted from it. Because the source slides are images, the PPTX is best used as a visual reference or as backgrounds; rebuild the charts and text in your own template for full editing.
It suits investor relations teams, CFO offices and analysts at industrial, steel or commodity companies that report several geographic segments, as well as students learning how quarterly earnings decks are structured.
The financial performance KPI tiles (page 4), the repeated segment template for Brazil, North America and South America (pages 9, 11 and 12), the EBITDA and net sales waterfall bridges (page 13), the cash flow waterfall (page 14) and the project progress tracker (page 18).
Imports slowed from 5.8 Mt in 2025 to an annualized 5.0 Mt estimate for 2026 but remain high, with total import penetration at 18.5% in 9M26 versus 10.4% in 2019, before COVID. The slide lists trade-defense measures: quotas with 25% tariffs renewed until June 2027 and antidumping actions on flat bar, plate, hot-rolled coils and wire rod.
The original filing of this presentation by Gerdau S.A.
Official investor relations site listed on the deck's closing slide.

Create Your Own Slides
Turn your ideas into professional presentations in seconds with 2slides AI.
Fai riferimento a design professionali, scegli il tuo stile e genera slide con rendering del testo perfetto. Alimentato da Nano Banana—inizia a creare la tua presentazione ora.
Il Tuo Agente IA per le slide. Risparmia tempo, brilla più velocemente con la creazione intelligente di presentazioni.


© 2026 2slides. Tutti i diritti riservati.