
Fa parte di Esempi di presentazioni per investitori · Esempi di presentazioni agli investitori indiane
GAIL (India) Limited Investors' & Analysts' Presentation for H1 FY 2026-27 (Q2 FY27 earnings), filed with BSE/NSE: physical volumes in gas transmission and marketing, petrochemicals and liquid hydrocarbons, sector-wise gas supply, standalone and consolidated financials in ₹ crore, the 30 September 2026 balance sheet, key ratios and H1 capex.
Usa la copertina di questa presentazione come riferimento di stile per slide create con i tuoi contenuti. Oppure scegli una pagina qui sotto per usarne il layout come riferimento.
Navigazione Rapida
Tag
Condividi le slide
GAIL (India) Limited Investors' & Analysts' Presentation for H1 FY 2026-27 (Q2 FY27 earnings), filed with BSE/NSE: physical volumes in gas transmission and marketing, petrochemicals and liquid hydrocarbons, sector-wise gas supply, standalone and consolidated financials in ₹ crore, the 30 September 2026 balance sheet, key ratios and H1 capex.
Vista dettagliata di ogni pagina di slide, inclusi layout, contenuto chiave ed elementi visivi.
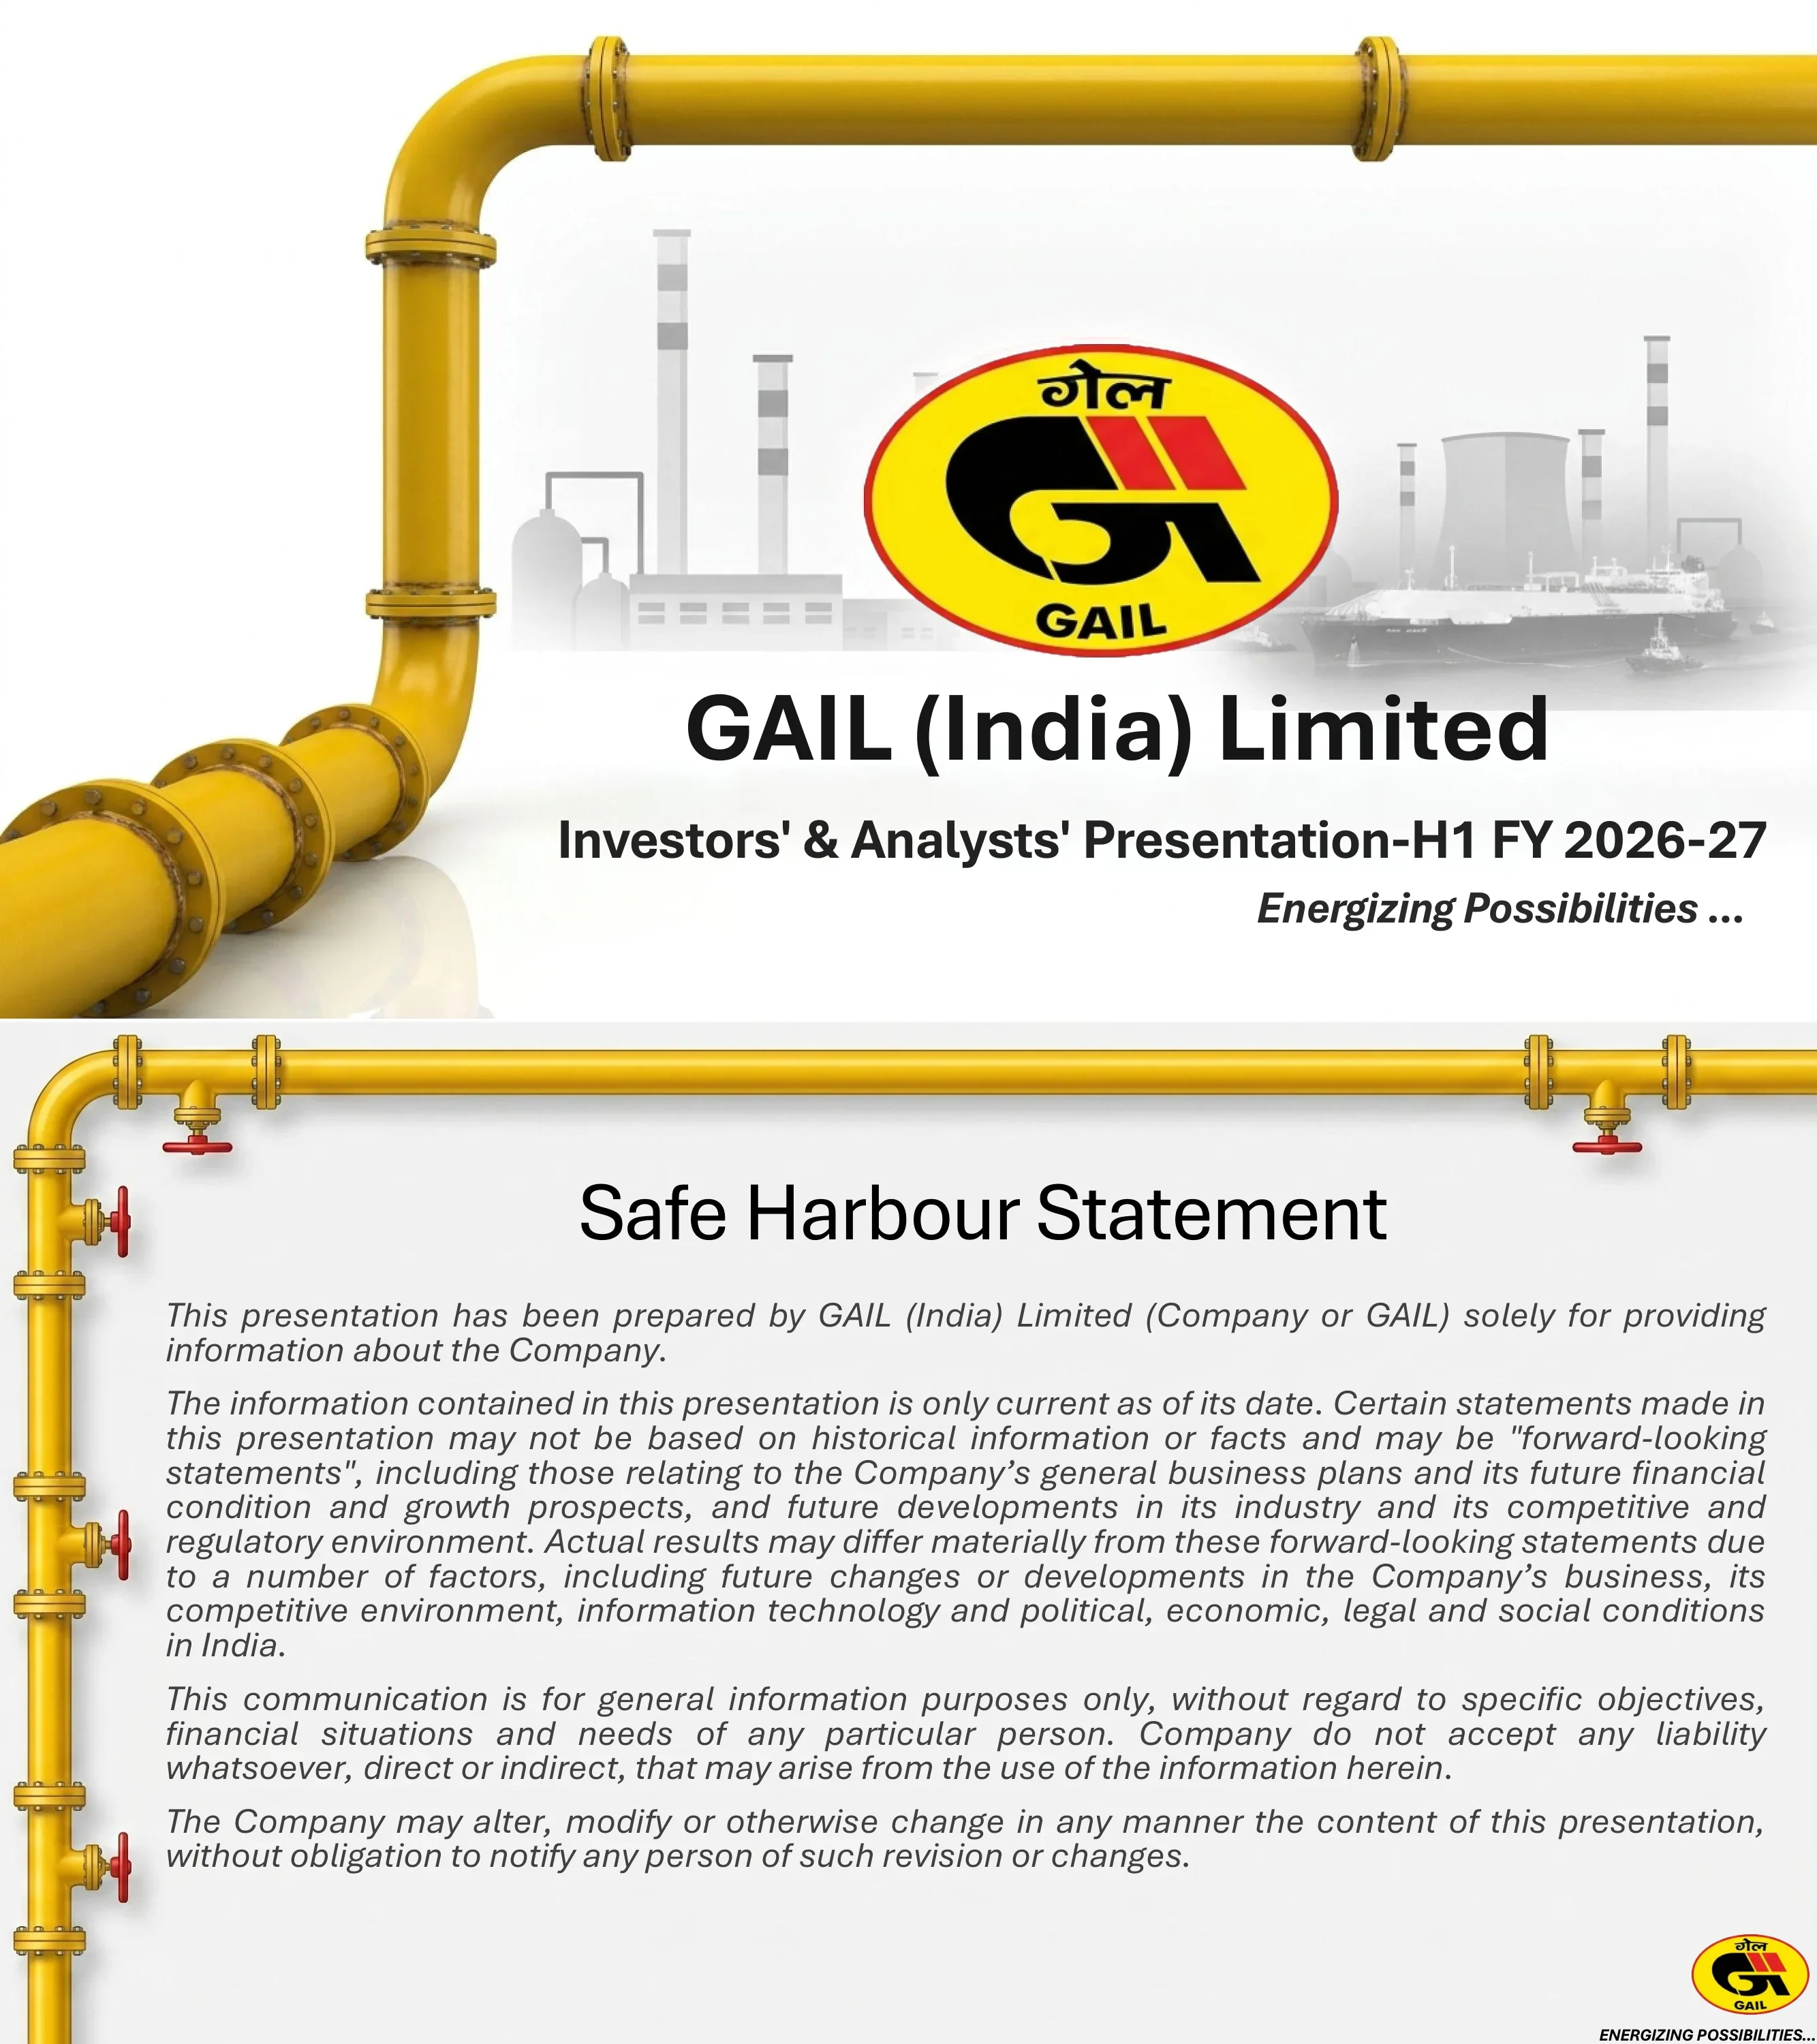
Cover slide naming GAIL (India) Limited and the Investors' & Analysts' Presentation for H1 FY 2026-27, with the tagline 'Energizing Possibilities...'.
Full-bleed illustration: a large yellow pipeline sweeps in from the left and across the top, with grey industrial plant, stacks and an LNG carrier in the background; the GAIL logo sits centre and the title text is stacked below right.
Standard disclaimer: the presentation is prepared by GAIL solely to inform about the company, is current only as of its date, contains forward-looking statements whose actual results may differ due to business, competitive, technology, political, economic, legal and social conditions in India, is for general information only with no liability accepted, and may be changed without notice.
Pipeline frame (yellow pipe along the left and top edges with red valves) around a centred title and four justified italic paragraphs; GAIL logo and tagline bottom right.
Five bar charts for FY23 / FY24 / FY25 / FY26 / H1 FY27: natural gas transmission 107 / 120 / 127 / 122 / 126 MMSCMD; natural gas marketing 95 / 98 / 101 / 104 / 96 MMSCMD; petrochemical sales 399 / 787 / 845 / 785 / 226 TMT; liquid hydrocarbons sales 929 / 998 / 951 / 815 / 483 TMT; LPG transmission 4,335 / 4,396 / 4,478 / 4,600 / 2,207 TMT.
Two charts on the top row and three on the bottom row, each a five-bar column chart with data labels above bars and period labels below, colour-coded per metric (gold, orange, green, pink).
Total supply fell from 105.47 MMSCMD in H1 FY26 to 95.53 MMSCMD in H1 FY27. Source mix: domestic 39.62 → 36.78 MMSCMD (38% both periods), RLNG 52.27 → 51.33 MMSCMD (49% → 54%), overseas 13.58 → 7.42 MMSCMD (13% → 8%). By sector (H1 FY26 → H1 FY27): fertilisers 34.78 → 31.18 (33% → 32%), power 10.92 → 10.68 (10% → 11%), city gas distribution 28.86 → 32.19 (27% → 34%), overseas sales 13.58 → 7.42 (13% → 8%), others 17.33 → 14.06 (17% → 15%).
Split-screen comparison divided by a dashed vertical line: each half has a pie chart of domestic / RLNG / overseas with callout boxes, above stacked columns per sector showing domestic and RLNG components, orange share badges and total labels; a colour legend runs along the bottom.
₹ crore, FY23 / FY24 / FY25 / FY26 / H1 FY27: gross turnover 143,976 / 130,284 / 136,960 / 138,328 / 84,783; gross margin (EBITDA) 9,384 / 15,583 / 19,168 / 13,119 / 13,999; PBT 6,584 / 11,555 / 14,825 / 8,964 / 11,611; PAT 5,302 / 8,836 / 11,312 / 6,968 / 8,943. Half-year EBITDA, PBT and PAT already exceed full-year FY26.
2×2 grid of five-bar column charts (turnover, EBITDA, PBT, PAT) with data labels and a small '(in Rs. crore)' unit note at top right.
₹ crore: total assets ₹1,35,986 crore = non-current assets 1,08,990 (PPE 52,849, CWIP 16,138, investments 19,191, others 20,813) + current assets 26,996. Equity and liabilities ₹1,35,986 crore = equity 81,277 (share capital 6,575, other equity 74,702 incl. retained earnings 68,277, CRR 127, OCI 6,298) + liabilities 54,709 (non-current 29,958, current 24,752). Capital employed ₹1,08,978 crore, net worth ₹74,979 crore, long-term loans outstanding ₹13,393 crore. Note that figures are rounded.
Two hierarchical tree diagrams (assets left, equity and liabilities right) built from yellow-shadowed boxes with connector lines and breakdown tables beneath; three yellow summary bars across the bottom and a rounding footnote.
FY23 / FY24 / FY25 / FY26 / H1 FY27: PAT to net worth 10 / 16 / 18 / 10 / 24%; ROCE 10 / 14 / 17 / 10 / 22%; debt-equity 0.22 / 0.29 / 0.26 / 0.28 / 0.29; share price ₹105 / 181 / 183 / 138 / 171; EPS ₹8 / 13 / 17 / 11 / 27; market capitalisation ₹69,203 / 119,108 / 120,160 / 90,539 / 112,237 crore. Footnotes: ratios include exceptional items and are annualised; share price and EPS adjusted for bonus issue and buyback; values as on period closing date.
Six line charts in a 3×2 grid separated by thin vertical rules, each with yellow lines, diamond markers and data labels; three footnotes along the bottom.
₹ crore, FY23 / FY24 / FY25 / FY26 / H1 FY27: gross turnover 145,531 / 133,130 / 141,949 / 141,716 / 88,521; gross margin (EBITDA) 10,323 / 16,986 / 20,643 / 14,524 / 15,009; PBT 7,256 / 12,595 / 16,096 / 9,725 / 12,368; PAT 5,616 / 9,899 / 12,450 / 7,582 / 9,385.
Same 2×2 column-chart grid as the standalone slide, with a different colour set (gold, light green, sky blue, pink) and an '(in Rs. crores)' unit note.
H1 capex of ₹7,600 crore: operational capex including ship chartering 4,776 (63%), petrochemicals 748 (10%), pipelines 655 (9%), equity contributions to JVs/subsidiaries 442 (6%), CGD projects 389 (5%), net zero/renewables 356 (4%), exploration & production 234 (3%). This is against annual planned capex of ~₹12,900 crore for FY2026-27.
Large pie chart on the left with percentage labels; on the right a banded table (Capex Breakup / Rs in Crores / %) with orange rules and a bold total row; a one-line note along the bottom.
Closing slide with contact details for the Investor Relations Cell, GAIL (India) Limited, irc@gail.co.in.
Pipeline frame with a red vertical bar and a horizontal yellow pipe crossing at the GAIL logo; italic 'Thank You' and centred contact lines in the upper right area.
Domande comuni su questa slide e il contenuto della presentazione sottostante.
It is GAIL (India) Limited's 'Investors' & Analysts' Presentation – H1 FY 2026-27', released with its results for the quarter and half-year ended 30 September 2026 and filed with BSE and NSE. In 10 slides it covers physical volumes, sector-wise gas supply, standalone and consolidated financials, the balance sheet, key ratios and H1 capex.
Indian companies use an April–March fiscal year, so FY27 runs from April 2026 to March 2027. The Q2 results meeting presents cumulative half-year (H1, April–September 2026) figures rather than the quarter alone, and compares them with full-year FY23–FY26.
Standalone gross turnover was ₹84,783 crore, EBITDA ₹13,999 crore and PAT ₹8,943 crore; consolidated PAT was ₹9,385 crore. Natural gas transmission averaged 126 MMSCMD and gas marketing 96 MMSCMD. Annualised ROCE was 22% and EPS ₹27 (the ratio footnote says these include exceptional items).
Financial figures are in ₹ crore (1 crore = 10 million rupees), written in the Indian digit grouping on the balance sheet (for example 1,35,986). Gas volumes are in MMSCMD (million metric standard cubic metres per day) and petrochemical, liquid hydrocarbon and LPG volumes in TMT (thousand metric tonnes).
Slide 4 splits supply into fertilisers, power, city gas distribution (CGD), overseas sales and others. In H1 FY27 CGD became the largest segment at 32.19 MMSCMD (34%), ahead of fertilisers at 31.18 MMSCMD (32%), while overseas sales fell from 13.58 to 7.42 MMSCMD.
Yes. The page offers the original PDF and a PPTX version converted from it, so you can reuse the chart layouts, the balance-sheet tree diagram or the capex table. Charts in the converted file may come through as images rather than native chart objects.
GAIL filed the presentation with the BSE and the National Stock Exchange of India as part of its Q2 FY27 investor and analyst meet disclosures. The version here has the exchange cover letter removed so the deck starts at the title slide.
Yes. Its structure — physical performance, segment supply comparison, standalone and consolidated financials, balance sheet, ratios and capex — is a tight 10-slide format for any half-year or quarterly results deck, and the five-period trend charts work for any company reporting against prior full years.
Company website with financial results and investor presentations.

Create Your Own Slides
Turn your ideas into professional presentations in seconds with 2slides AI.
Fai riferimento a design professionali, scegli il tuo stile e genera slide con rendering del testo perfetto. Alimentato da Nano Banana—inizia a creare la tua presentazione ora.
Il Tuo Agente IA per le slide. Risparmia tempo, brilla più velocemente con la creazione intelligente di presentazioni.


© 2026 2slides. Tutti i diritti riservati.