
Fa parte di Esempi di presentazioni per investitori
bpx Energy Investor Update - Strategic Growth and Value Creation in US Oil & Gas Exploration
Navigazione Rapida
Tag
Condividi le slide
bpx Energy Investor Update - Strategic Growth and Value Creation in US Oil & Gas Exploration
Vista dettagliata di ogni pagina di slide, inclusi layout, contenuto chiave ed elementi visivi.
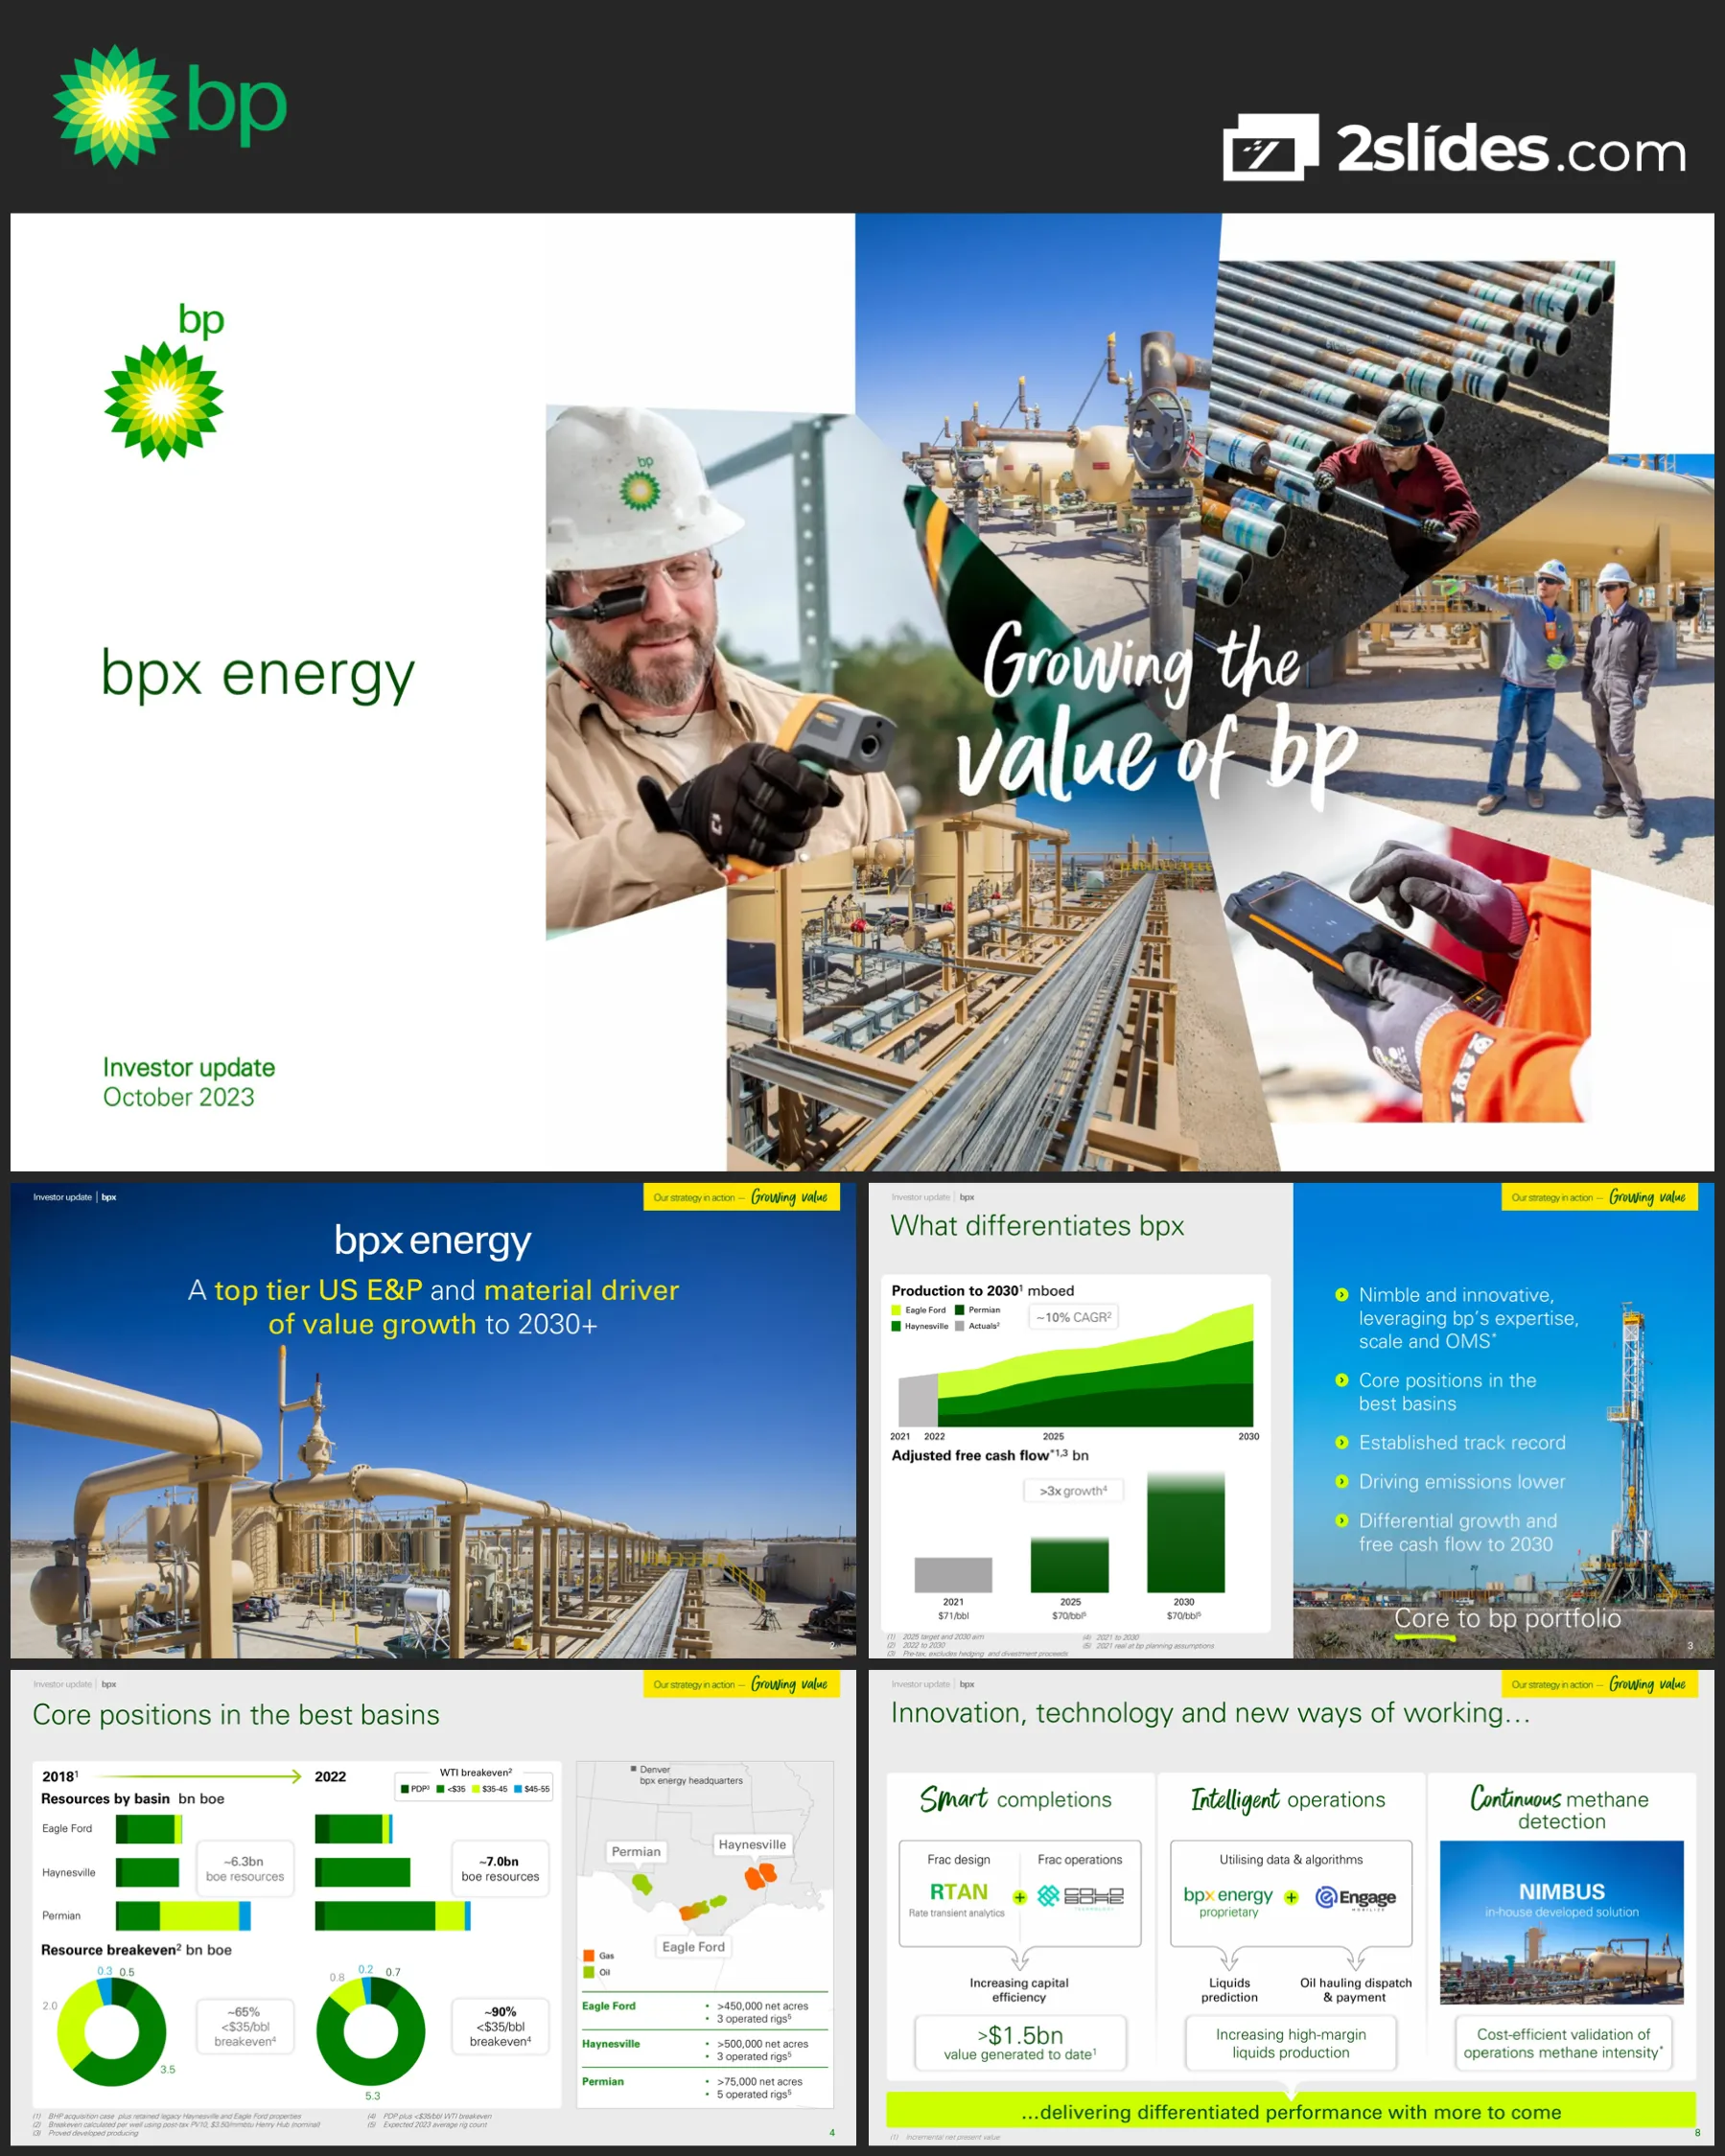
Title slide featuring bpx energy branding with collage of operational photos including workers, facilities, and equipment, emphasizing the tagline 'Growing the value of bp'
Professional cover design with BP logo, bpx energy branding, date (October 2023), and photographic montage showing diverse operational activities
Core positioning statement establishing bpx energy as a top tier US E&P company and material driver of bp's value growth to 2030+, with dramatic facility background image
Full-width hero image with centered text overlay, BP branding in top left, yellow accent banner top right with 'Our strategy in action - Growing value'
Overview of bpx's competitive advantages with production and free cash flow projections showing ~10% CAGR and >3x growth respectively, plus five key differentiators and basin positioning
Split layout with data visualizations on left (stacked area chart for production, bar chart for cash flow) and five bullet points on right, with 'Core to bp portfolio' callout and drilling rig image
Detailed resource breakdown showing growth from 6.3bn boe (2018) to 7.0bn boe (2022), with resource quality analysis by breakeven price and geographic map of operations
Complex multi-panel layout with horizontal bar charts (resources by basin), pie charts (resource breakeven analysis), geographic map, and detailed acreage/rig count statistics
Competitive benchmarking showing bpx leads peers in EUR (Estimated Ultimate Recovery) per 1,000ft lateral length across all three basins, with cost and liquids content advantages
Three-column layout with bar charts comparing bpx to anonymous competitors, plus key metrics callouts below each chart
Historical performance data showing improvements in process safety (Tier 1/2 incidents declining), 30% reduction in development costs, and synergy achievement 15% above target delivered 1 year early
Three-panel horizontal layout with bar charts and metric callouts, green checkmarks indicating achievement
Environmental performance showing 40% reduction in operated emissions vs 2019, 60% reduction in methane intensity vs 2020, and 99% reduction in Permian flaring intensity since acquisition, plus Grand Slam electrified facility
Split design with emissions data charts on left and large facility photograph on right showcasing electrified infrastructure
Overview of three innovation pillars: Smart completions (RTAN + SolidO), Intelligent operations (proprietary tools + Engage platform), and Continuous methane detection (NIMBUS), delivering >$1.5bn value to date
Three-column equal layout with icons, technology logos, and outcome callouts, connected by arrows to show value creation pathway
Three key operational improvement trends from 2022 to 2030: ~80% increase in liquids production, ~20% reduction in unit costs, and ~35% increase in capital productivity (lateral length)
Three-column layout with bar charts showing baseline, 2025 target, and 2030 aim for each metric, using gradient green bars for future projections
Comprehensive financial roadmap showing production growth (325 to >650 mboed), capital expenditure (~$2.5bn average annual), and adjusted free cash flow growth (>$1bn to >$4bn) from 2022 through 2030
Three-column card layout overlaid on facility background photograph, each showing 2022 baseline, 2025 target, and 2030 aim with large numbers and growth arrows
Concluding statement emphasizing three success factors: Hybrid model, Quality assets, and Innovation culture, with tagline 'This team delivers......growing the value of bp'
Simple three-element equation layout overlaid on facility photograph showing workers and infrastructure, with handwritten-style 'delivers' text for emphasis
Required legal disclaimer and forward-looking statements notice per PSLRA requirements, covering risks, uncertainties, IFRS reconciliations, and SEC filing references
Text-heavy legal page with multi-paragraph format, green highlighted footer note about asterisk definitions
Domande comuni su questa slide e il contenuto della presentazione sottostante.
bpx energy has an exceptionally advantaged resource portfolio with approximately 90% of its 7.0 billion boe resources having breakeven economics below $35/bbl WTI. This dramatically improved from ~65% in 2018 following strategic acquisitions and portfolio optimization. This means the vast majority of bpx's production remains profitable even in lower oil price environments, providing significant downside protection and cash flow resilience compared to peers.
bpx has achieved outstanding emissions performance with a 40% reduction in operated emissions since 2019 and a 60% reduction in methane intensity since 2020. Most dramatically, Permian operated flaring intensity has been reduced by 99% since acquisition, dropping from 15.7% in 2019 to just 0.2% in 2023. Key initiatives include the Grand Slam electrified central processing facility and the proprietary NIMBUS continuous methane detection system that provides cost-efficient validation of operations methane intensity.
bpx energy is targeting substantial growth with production expected to reach more than 650 thousand barrels of oil equivalent per day (mboed) by 2030, representing more than double the 325 mboed baseline in 2022. This represents approximately 10% compound annual growth rate (CAGR) from 2022 to 2030. The growth is particularly focused on high-margin liquids production, which is expected to increase by approximately 80% from 2022 to 2030, significantly enhancing the value and margin profile of the business.
bpx energy's innovation and technology initiatives have generated more than $1.5 billion in value to date (measured as incremental net present value). This value creation comes from three main areas: Smart completions using RTAN rate transient analytics and SolidO technologies increasing capital efficiency, Intelligent operations using proprietary algorithms and the Engage platform for liquids prediction and oil hauling optimization, and Continuous methane detection through the in-house developed NIMBUS solution providing cost-efficient emissions monitoring.
For 2025, bpx targets production growth of 30-40% compared to 2022 and adjusted free cash flow of approximately $2 billion. By 2030, the company aims for production exceeding 650 mboed (more than double 2022 levels) and adjusted free cash flow exceeding $4 billion (more than 4x the 2022 baseline of >$1 billion). These projections assume Brent crude at $70/bbl in 2021 real terms. The company plans average annual capital expenditure of approximately $2.5 billion from 2023-2030, operating an average of 12-15 rigs.
bpx energy leads its peer group across all three tier 1 basins in terms of Estimated Ultimate Recovery (EUR) per 1,000 feet of lateral length. In the Permian, bpx achieves approximately 200 mboe per 1,000ft versus competitors at 100-180, with ~70% liquids content and $7/boe development cost. In Eagle Ford, bpx reaches ~150 mboe per 1,000ft compared to peers at 70-95, with ~50% liquids and $9/boe cost. In Haynesville, bpx delivers approximately 2.0 bcfe per 1,000ft versus competitors at 1.5-1.9, with location-advantaged dry gas and $1/mcfe development cost.
bpx energy operates as a nimble, innovative independent operator while leveraging bp's expertise, global scale, and Operating Management System (OMS). This hybrid model combines the agility and entrepreneurial culture of an independent E&P company with the resources, technical capabilities, safety systems, and best practices of a major integrated energy company. This unique structure allows bpx to move quickly on opportunities and innovations while benefiting from bp's decades of upstream experience, financial strength, and commitment to operational excellence and safety.
bpx energy has significantly exceeded its synergy targets from integrating BHP's onshore US assets. The company originally targeted $350-400 million in synergies but has delivered approximately 15% above this target, and achieved the full synergy target one year earlier than planned. Key synergy areas include a 30% reduction in Permian development costs from 2019 to 2022, improved process safety performance with substantial reductions in Tier 1 and Tier 2 incidents, and dramatic improvements in flaring intensity. This track record demonstrates bpx's ability to integrate acquisitions effectively and capture operational improvements.

Create Your Own Slides
Turn your ideas into professional presentations in seconds with 2slides AI.
Fai riferimento a design professionali, scegli il tuo stile e genera slide con rendering del testo perfetto. Alimentato da Nano Banana—inizia a creare la tua presentazione ora.
Il Tuo Agente IA per le slide. Risparmia tempo, brilla più velocemente con la creazione intelligente di presentazioni.




© 2026 2slides. Tutti i diritti riservati.