
Fa parte di Esempi di presentazioni per investitori
Ares Management Q3 2026 Earnings Presentation: the third-quarter 2026 results deck of Ares Management Corporation (NYSE: ARES), a global alternative asset manager. Ares filed it with the SEC as Exhibit 99.2 to a Form 8-K. It covers the quarter ended September 30, 2026: GAAP results, Fee Related Earnings, Realized Income, fundraising, AUM and FPAUM, perpetual capital, capital deployment, segment results for the Credit, Real Assets, Secondaries and Private Equity groups, fund performance tables, the balance sheet, GAAP-to-non-GAAP reconciliations and a glossary.
Usa la copertina di questa presentazione come riferimento di stile per slide create con i tuoi contenuti. Oppure scegli una pagina qui sotto per usarne il layout come riferimento.
Navigazione Rapida
Tag
Condividi le slide
Ares Management Q3 2026 Earnings Presentation: the third-quarter 2026 results deck of Ares Management Corporation (NYSE: ARES), a global alternative asset manager. Ares filed it with the SEC as Exhibit 99.2 to a Form 8-K. It covers the quarter ended September 30, 2026: GAAP results, Fee Related Earnings, Realized Income, fundraising, AUM and FPAUM, perpetual capital, capital deployment, segment results for the Credit, Real Assets, Secondaries and Private Equity groups, fund performance tables, the balance sheet, GAAP-to-non-GAAP reconciliations and a glossary.
Vista dettagliata di ogni pagina di slide, inclusi layout, contenuto chiave ed elementi visivi.
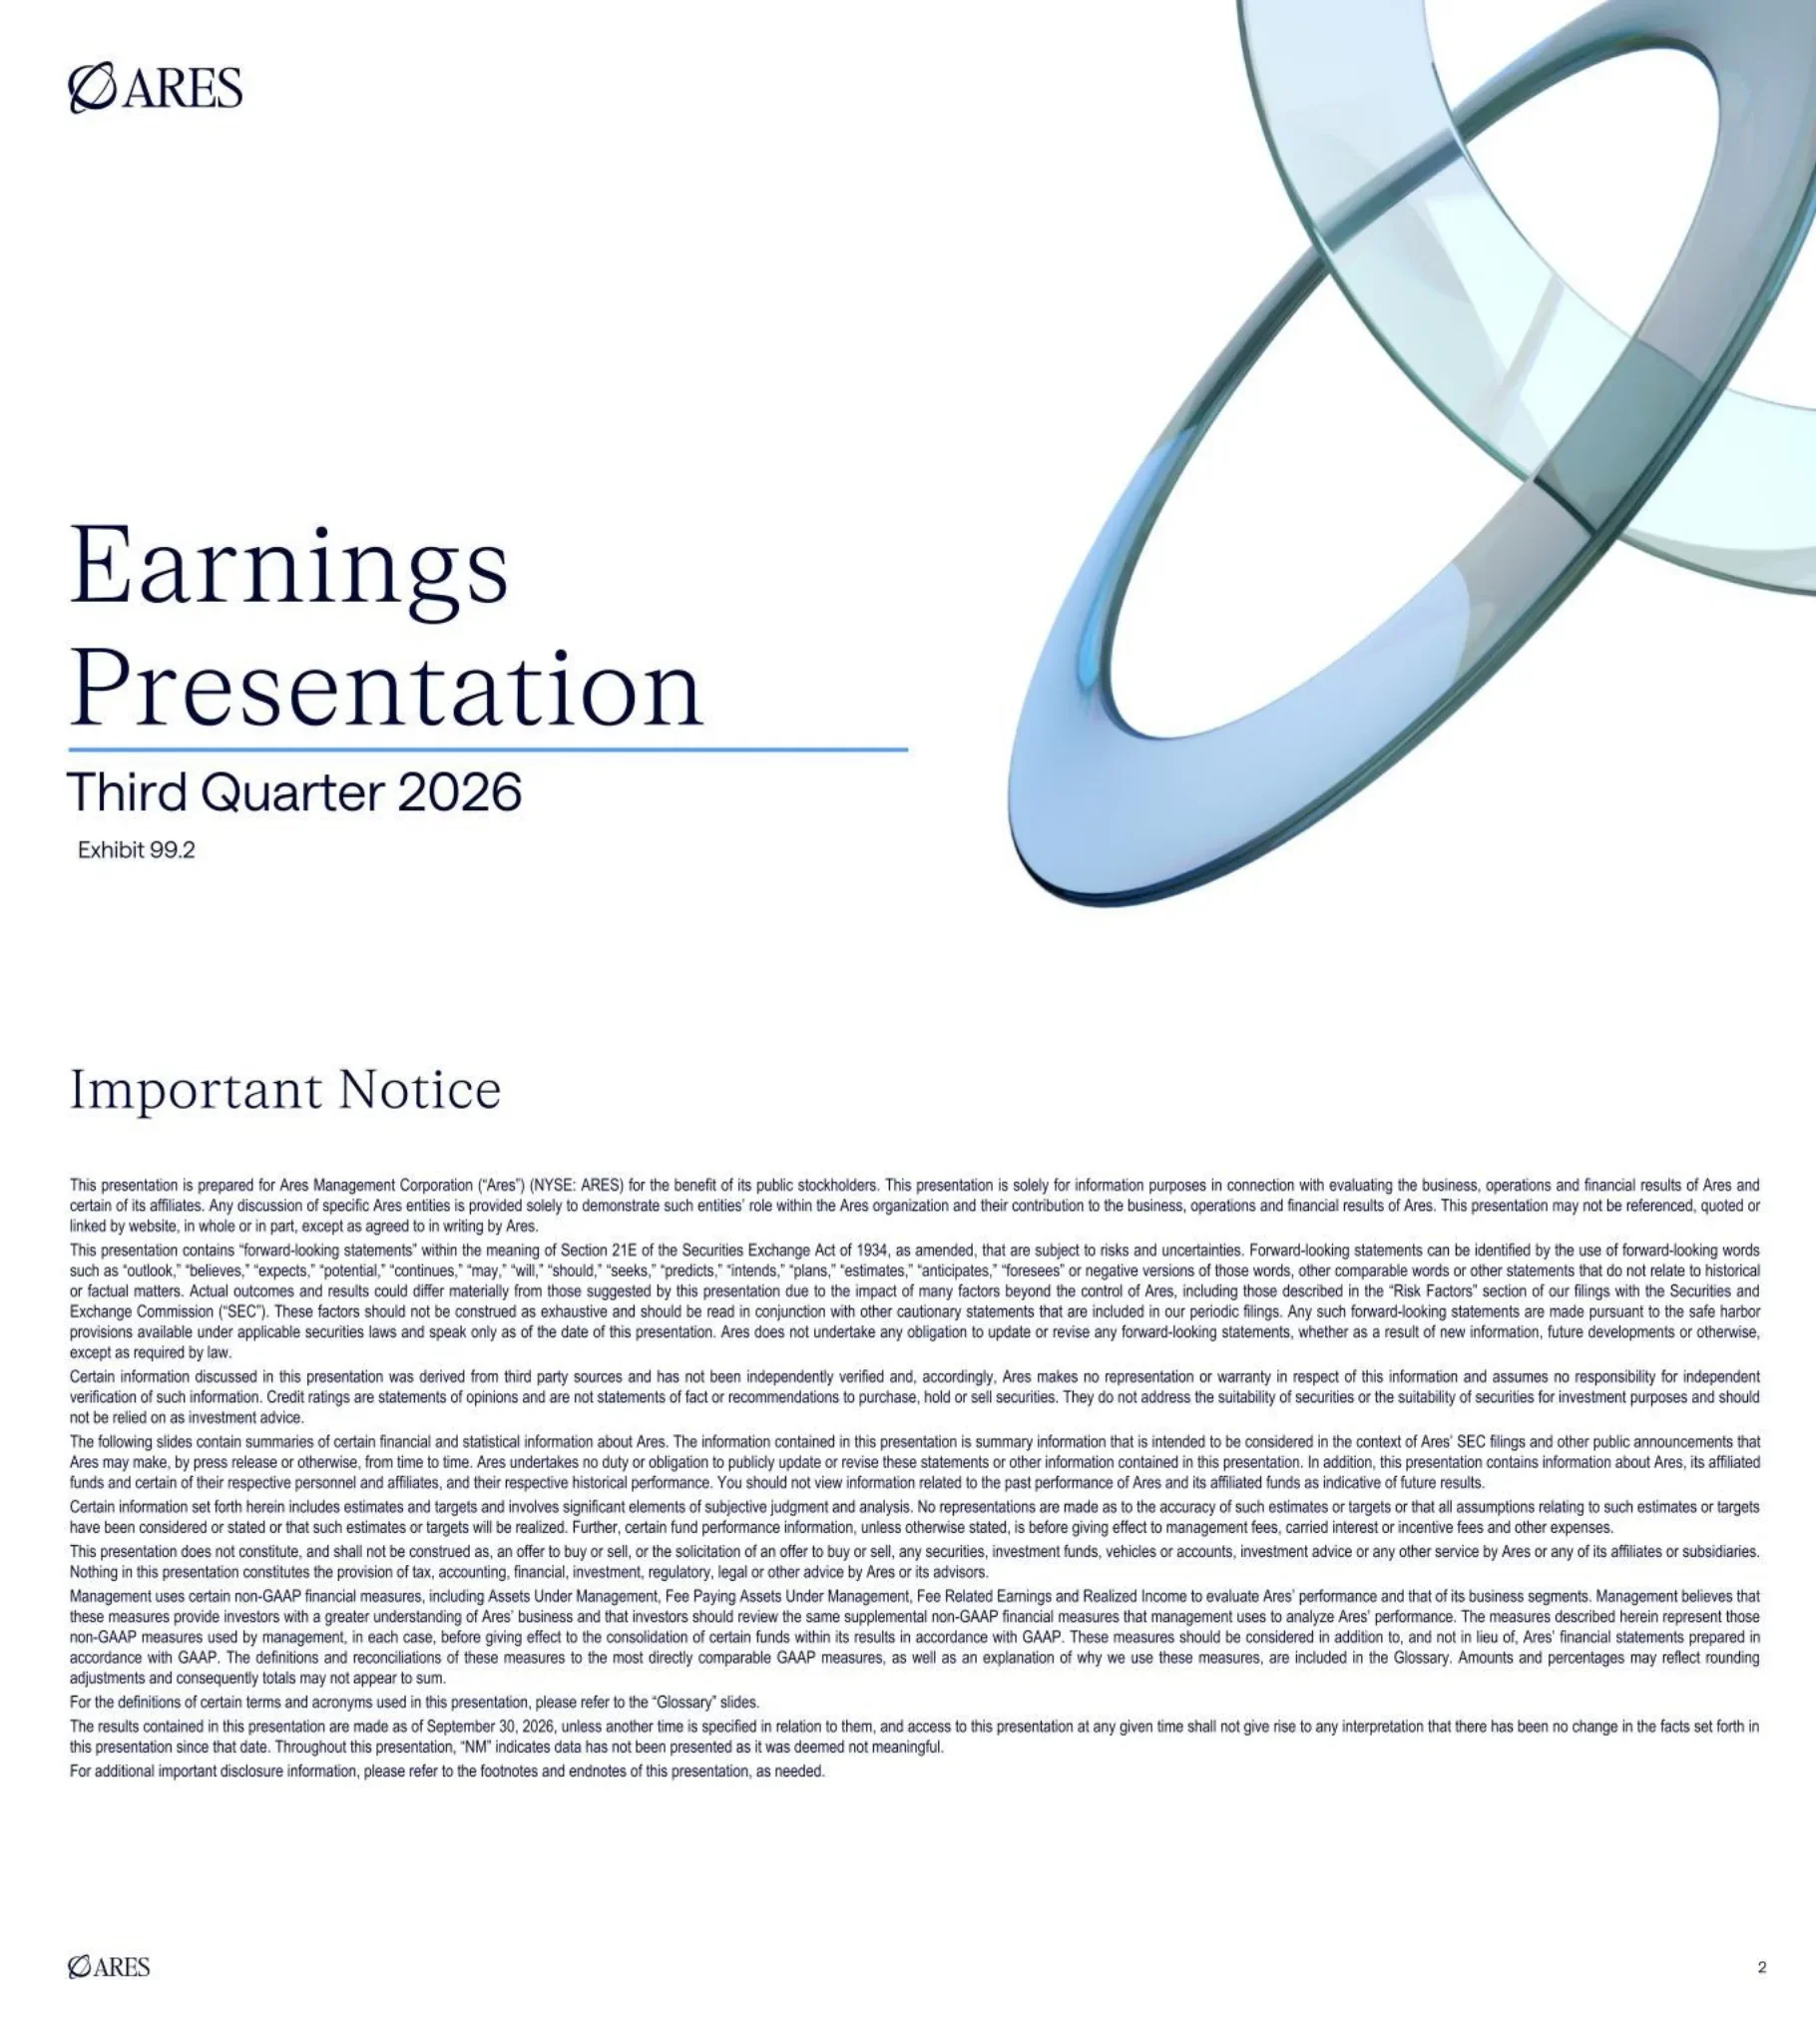
Cover slide for Ares Management's Third Quarter 2026 Earnings Presentation, labelled Exhibit 99.2 (the SEC filing exhibit number).
White background with the Ares logo at top left, a large serif title at lower left over a thin blue rule, and a 3D translucent glass ring graphic filling the right half.
Legal disclaimer. It covers forward-looking statements under Section 21E of the Exchange Act, third-party data, management's use of non-GAAP measures (AUM, FPAUM, Fee Related Earnings, Realized Income), and states that results are as of September 30, 2026 and that 'NM' means not meaningful.
Full-width body text in multiple justified paragraphs under a serif headline, with the logo and page number in the footer.
Q3-26 GAAP net income attributable to Ares was $85.3 million ($0.21 per share), with GAAP management fees of $1,057.1 million, unconsolidated management and other fees of $1,155.5 million, FRE of $524.2 million, Realized Income of $490.1 million and after-tax RI of $1.26 per share. AUM was $690.6 billion, FPAUM $416.4 billion and available capital $173.8 billion. Ares raised $31.0 billion (net inflows $28.6 billion) and deployed $34.8 billion. It declared a $1.35 quarterly common dividend and a $0.84375 Series B preferred dividend. On October 26, 2026, ARCC agreed to acquire MidCap Financial Investment Corporation (MFIC) for about $2.6 billion in enterprise value.
Four-row table. Shaded left cells hold the category labels (Financial Results, AUM, Corporate Actions, Recent Developments) and the right cells hold bullet lists. Footnotes run along the bottom.
GAAP income statement for the three and nine months ended September 30, 2026 vs 2025. Q3-26 total revenues were $1,433.4 million (vs $1,657.6 million), with management fees of $1,057.1 million and carried interest allocation of $161.7 million (vs $464.7 million). Total expenses were $1,148.5 million, net income $205.4 million, and net income attributable to Ares Management Corporation $85.3 million (vs $288.9 million). Diluted EPS was $0.21 (vs $1.15). Nine-month diluted EPS was $1.15 (vs $1.64).
Full-page financial table with a navy header row, light-blue section bands (Revenues, Expenses, Other income, Net income per share) and bold subtotal rows. Four numeric columns.
Non-GAAP summary. Q3-26 management fees were $1,069.3 million (+10%), FRE $524.2 million (+11%), Realized Income $490.1 million (+8%), after-tax RI $449.6 million and after-tax RI per Class A share $1.26 (vs $1.19). Year-to-date FRE was $1,479.7 million (+19%) and RI $1,514.4 million (+20%). FRE margin was 42.5% (vs 41.4%) and the effective management fee rate 0.99%. Footnotes cover Part I fees, supplemental distribution fees and tax items.
Wide table with six numeric columns (Q3 2026, Q3 2025, % change, YTD 2026, YTD 2025, % change), blue highlight bands on FRE, RI and per-share lines, and an 'Other Data' block below.
Gross returns by strategy for Q3-26 and the last twelve months. Credit: Alternative Credit 3.6% (LTM 15.2%), U.S. Senior Direct Lending 3.3% (12.0%), APAC Credit 5.0% (17.0%), European Direct Lending 2.2% (8.1%). Real Assets: Infrastructure Equity 3.7% (10.7%), Americas Real Estate Equity 2.8% (4.3%). Secondaries: APMF net (1.9)% (10.1%), Infrastructure Secondaries 4.9% (14.6%), Private Equity Secondaries (1.2)% ((5.8)%). Corporate Private Equity (0.8)% ((0.4)%).
Two-column returns table grouped by light-blue section headers (Credit, Real Assets, Secondaries, Private Equity) under a navy header.
Q3-26 gross fundraising was $31.0 billion: Credit Group $15.2 billion (U.S. Direct Lending $7.2 billion, including $3.3 billion from BDCs, of which $2.5 billion came from ARCC), Real Assets $11.2 billion (Real Estate $5.9 billion, Infrastructure $5.3 billion, including $2.7 billion for the open-ended infrastructure fund), Secondaries $2.6 billion (including $1.4 billion to AGSS) and Other Businesses $2.0 billion (Insurance $1.6 billion, plus a $0.4 billion IPO for the third SPAC, Ares Acquisition Corporation III).
Three-column table (strategy, Q3-26 amount, primary activities bullets) with group subtotal bands and a grand total row.
AUM reached $690.6 billion, up 16% from $595.7 billion a year earlier, driven by drawdown fund commitments, perpetual vehicle fundraising and insurance assets. FPAUM was $416.4 billion, up 13% from $367.6 billion. Credit AUM was $446.2 billion, Real Assets $161.6 billion, Secondaries $46.3 billion, Private Equity $24.5 billion and Other Businesses $12.0 billion.
Two side-by-side commentary blocks on top, a mint divider line, then two stacked bar charts (AUM and FPAUM across Q3-25, Q2-26 and Q3-26) with a shared five-color legend.
Perpetual capital was $233.9 billion, up 23% from $190.3 billion, helped by the credit BDCs, the open-ended infrastructure and European direct lending funds, the non-traded REIT and APMF. By type: perpetual wealth funds $81.7 billion, private commingled funds $65.6 billion, publicly traded funds $47.2 billion and managed accounts $39.4 billion.
Commentary header followed by two stacked bar charts: perpetual capital AUM by group, and by vehicle type.
84% of AUM and 93% of management fees came from perpetual capital or long-dated funds. Long-dated funds were 50% of AUM and 39% of fees. Perpetual wealth funds were 12% of AUM and 22% of fees, and publicly traded funds 7% of AUM and 19% of fees.
Two donut charts side by side, each with a headline percentage in the center (84% and 93%), above a six-item legend.
Available capital (dry powder) was $173.8 billion, up 16% from $149.5 billion, of which Credit was $109.9 billion. AUM not yet paying fees was $117.1 billion, up 14% from $103.0 billion, of which Credit was $82.0 billion and Real Assets $27.0 billion.
Two commentary blocks over two stacked bar charts comparing Q3-25, Q2-26 and Q3-26.
Of the $117.1 billion in shadow AUM, $93.8 billion is available for future deployment and $2.3 billion is development assets not yet stabilized. Together they could generate about $826.9 million of potential incremental annual management fees. The $93.8 billion includes $29.2 billion in U.S. direct lending, $17.0 billion in alternative credit and $13.3 billion in European direct lending. By group it splits Credit $68.2 billion, Real Assets $19.4 billion, Secondaries $5.7 billion and Private Equity $0.5 billion.
Bold summary sentence and bullet on top, then two donut charts linked by a mint arrow, showing the total and then the breakdown of deployable capital. Long footnotes at the bottom.
Incentive eligible AUM was $364.0 billion (+15%) and incentive generating AUM $168.6 billion (+14%). Of the $251.1 billion of invested IEAUM, 67% is generating incentives, or 83% excluding Part II fee AUM. A reconciliation table bridges IGAUM to IEAUM by group, adding uninvested IEAUM ($112.9 billion), IEAUM below hurdle ($35.5 billion) and Part II fees below hurdle ($47.0 billion).
Bulleted commentary across the top. On the left, a stacked bar chart of IEAUM; on the right, a reconciliation table with highlighted first and last rows, linked by an arrow.
Gross capital deployment was $34.8 billion in Q3-26, down from $41.7 billion in Q3-25. Drawdown funds deployed $18.4 billion (vs $20.2 billion) and perpetual vehicles $18.7 billion (vs $21.2 billion). By group: Credit $22.3 billion, Real Assets $9.7 billion, Other $1.3 billion, Secondaries $1.1 billion and Private Equity $0.4 billion.
Commentary bullets above a donut chart of Q3-26 deployment (center $34.8) on the left and a stacked bar chart of drawdown fund deployment over three quarters on the right.
Credit Group management and other fees were $731.0 million (+10%), FRE $521.4 million (+11%) and Realized Income $518.0 million (+9%). YTD RI was $1,604.7 million (+20%). Gross deployment was $22.3 billion, down 33%, including $9.1 billion in U.S. direct lending and $5.3 billion in European direct lending. AUM was $446.2 billion (+14%) and FPAUM $271.2 billion (+13%).
Five bullet points on top, then a 'Financial Summary and Highlights' table (in $ thousands) and a smaller table of deployment, AUM and FPAUM (in $ billions).
Real Assets management fees rose 29% to $229.5 million, driven by the open-ended core infrastructure fund, the diversified non-traded REIT and US XI. FRE rose 32% to $166.6 million and Realized Income 33% to $149.1 million. Fee related performance revenues rose 57% to $9.3 million, from the Japanese open-ended industrial real estate fund. Deployment was $9.7 billion (+80%). AUM was $161.6 billion (+22%) and FPAUM $91.6 billion (+14%).
Same segment template as page 15: bullets, a $ thousands summary table and a $ billions KPI table.
Secondaries management and other fees fell 19% to $73.9 million, because Q3-25 included $27.2 million of ASIS III catch-up fees. Fee related performance revenues fell 67% to $5.7 million on lower APMF incentive fees. FRE was $50.7 million (-32%) and RI $50.0 million (-31%), while YTD FRE was up 1%. Deployment was $1.1 billion. AUM was $46.3 billion (+21%) and FPAUM $32.0 billion (+14%).
Segment template: bullet commentary and two summary tables.
Private Equity management and other fees rose 3% to $34.9 million, as ACOF VII fees offset the ACOF VI fee step-down. FRE rose 25% to $16.4 million and Realized Income 32% to $14.0 million. Deployment was $0.4 billion. AUM was $24.5 billion (-2%) and FPAUM $13.5 billion (+14%).
Segment template: bullet commentary and two summary tables.
Section divider that opens the supplemental financial detail section.
White slide with the Ares logo at top left, a large serif section title at bottom left, and a glass ring graphic sweeping across the top right.
Segment-by-segment FRE and Realized Income build for the three months ended September 30, 2026 and 2025. Columns cover the Credit, Real Assets, Secondaries and Private Equity groups, Other, and the Operations Management Group. Q3-26 total FRE was $524.2 million and RI $490.1 million, after OMG costs of $(236.1) million in FRE. Real Assets carried $(35.3) million of interest expense.
Two stacked dense tables (Q3 2026 and Q3 2025), each with seven numeric columns, highlighted FRE, realized net performance income and RI rows.
The same segment build for the nine months ended September 30. YTD-26 FRE was $1,479.7 million and RI $1,514.4 million, vs $1,247.6 million and $1,259.2 million in YTD-25. Credit Group YTD RI was $1,604.7 million, and realized net performance income totaled $138.0 million.
Mirror of page 20 with nine-month figures in two stacked tables.
Bridge from Realized Income to after-tax RI. Q3-26 RI before taxes was $490.1 million, less $17.4 million of entity-level taxes and $23.2 million of corporate income taxes, giving after-tax RI of $449.6 million ($1.30 per total share). Applying a 68.89% average ownership of the Ares Operating Group gives $302.5 million attributable to Class A and non-voting stockholders, or $1.26 per share (YTD $3.79). Footnotes explain tax deductions from RSU vesting and the Tax Receivable Agreement.
Two-section table with four numeric columns and highlighted after-tax rows, followed by a long block of footnotes.
Share count used for Realized Income. In Q3-26 there were 227.5 million Class A and non-voting shares, 102.8 million exchangeable AOG units, 9.78 million dilutive shares from the Series B mandatory convertible preferred and 5.4 million from unvested restricted units. That totals 345.5 million shares, or 241.0 million on the common-shares-as-adjusted basis.
Short single table with four numeric columns (total shares and as-adjusted shares, for Q3-26 and Q3-25), with footnotes below.
Cash was $597.7 million, term debt $2,963.2 million and $1,815.0 million was drawn on the $2.5 billion revolver. The corporate investment portfolio was $1,429.4 million GAAP ($3,068.1 million unconsolidated), with net accrued performance income of $1,027.1 million GAAP. Ares is rated BBB+/A- by S&P and Fitch and has $1,282.7 million of available liquidity. Net accrued performance income was 76% Credit and 22% Real Assets. The rollforward goes from $1,021.4 million to $1,027.1 million.
Balance table at top left with three KPI callout boxes at right. Below are two donut charts (December 31, 2025 vs September 30, 2026) and a waterfall bar chart of the accrued performance income rollforward.
Unconsolidated balance sheet investments of $3,068.1 million at September 30, 2026, vs $2,824.8 million at December 31, 2025. Credit was $93.7 million (down from $231.0 million), Real Assets $459.4 million, Secondaries $186.2 million and Private Equity $509.4 million. Other was $1,699.4 million, including $628.3 million in insurance and $1,071.1 million in other investments. A new Operations Management Group line holds $120.0 million.
Single two-column table grouped by strategy with light-blue section headers and subtotals.
Quarterly and LTM AUM rollforwards by group. AUM went from $671.3 billion to $690.6 billion in the quarter (+$19.3 billion), with $18.8 billion of new equity commitments and $12.3 billion of new debt commitments offset by $8.6 billion of distributions. Over the LTM it went from $595.7 billion (+$95.0 billion), including $5.5 billion of acquisitions. Commentary boxes explain the YoY change for each group: Credit +14%, Real Assets +22%, Secondaries +21%, Private Equity -2%, Other +43%.
Two stacked rollforward tables (quarter and LTM) with five group columns plus total, and a row of five beige commentary boxes at the bottom.
FPAUM went from $409.9 billion to $416.4 billion in the quarter (+$6.5 billion), on $10.2 billion of commitments and $11.3 billion of deployment, less distributions and a $(1.7) billion change in fee basis. Over the LTM it rose $48.8 billion from $367.6 billion. Group commentary: Credit +13%, Real Assets +14%, Secondaries +14%, Private Equity +14% (ACOF VII fees), Other +15%.
Same structure as page 26: two rollforward tables and five commentary cards.
AUM and FPAUM by strategy at September 30, 2026. U.S. Direct Lending had $199.7 billion of AUM (45% of Credit), European Direct Lending $88.7 billion, Liquid Credit and Alternative Credit $62.2 billion each, Real Estate $126.4 billion, Infrastructure $35.2 billion, Private Equity Secondaries $26.0 billion, Corporate Private Equity $21.4 billion and Insurance $11.4 billion. Total AUM was $690.6 billion and FPAUM $416.4 billion.
Single long table with four numeric columns (AUM, % AUM, FPAUM, % FPAUM), grouped by section with subtotals.
Returns for the perpetual credit vehicles: ARCC ($36.4 billion AUM, 11.8% net since inception), CADC, the open-ended core alternative credit fund, ASIF ($26.3 billion, 9.9% net) and the open-ended European direct lending fund. Drawdown funds deploying capital include ACE VI (levered net IRR 12.2%), SDL III (levered net IRR 12.9%) and Pathfinder II (1.3x gross MOIC, 15.6% net IRR).
Two tables: a perpetual vehicle returns grid (QTD, YTD and since-inception gross/net), and a drawdown fund table with commitments, invested capital, realized/unrealized value, MOIC and IRR.
Credit funds harvesting investments, including SSF IV (1.7x net MOIC, 8.0% net IRR), ACE III, SSG IV, PCS I, SSG V (25.0% gross / 15.7% net IRR), ACE IV, ASOF I (13.5% net IRR), Pathfinder I, ACE V, PCS II, SDL II and ASOF II ($8.3 billion AUM, 11.3% net IRR).
Single wide drawdown fund performance table continuing the format of page 29.
Returns for the perpetual real assets vehicles: the diversified non-traded REIT ($8.6 billion), J-REIT, the industrial non-traded REIT, the U.S. and Japanese open-ended industrial real estate equity funds, and the open-ended core infrastructure fund ($8.5 billion, 10.2% net since inception). Drawdown funds include IDF V (9.8% net IRR) and harvesting funds EPEP II, EIF V, US IX, EF V, IDF IV, AREOF III and EIP II.
Perpetual vehicle returns table on top and drawdown fund table below, in the same format as the credit pages.
APMF ($5.9 billion AUM) returned (1.9)% net for the quarter, 8.1% YTD and 13.7% since inception. Harvesting drawdown funds: LEP XV (10.1% net IRR), LEP XVI (6.1%) and LREF VIII (6.3%). A note explains that secondaries returns use a three-month lag.
One-row perpetual vehicle table and a three-row drawdown table, leaving white space below.
Private equity drawdown funds: ACOF VI ($9.0 billion AUM, 1.8x gross / 1.5x net MOIC, 14.0% net IRR), ACOF VII (NM, early stage), ACOF IV (2.3x gross MOIC, 13.4% net IRR), ACOF V (3.5% net IRR) and AEOF (0.7x MOIC, (7.4)% net IRR).
Single drawdown fund table split into 'Funds Deploying Capital' and 'Funds Harvesting Investments' bands.
Ares board of directors, including Co-Founder and CEO Michael Arougheti, Executive Chairman Antony Ressler, Chairman of Snap Inc. Michael Lynton, and former Google Chief People Officer Eileen Naughton. Also lists the executive officers, including CFO Jarrod Phillips and Co-Presidents Kipp deVeer and Blair Jacobson, and the investor relations contacts.
Grid of beige name cards in six columns under three section labels (Board of Directors, Executive Officers, Investor Relations Contacts).
Lists the sell-side research coverage: 20 brokers, including Goldman Sachs, JP Morgan, Morgan Stanley, BofA, Wells Fargo and UBS. Also gives the Los Angeles headquarters at 1800 Avenue of the Stars, corporate counsel Kirkland & Ellis, auditor Ernst & Young, the NYSE: ARES listing and transfer agent Equiniti.
Six-column card grid of analyst names and phone numbers, with a second row of corporate information cards.
Section divider that opens the GAAP to non-GAAP reconciliations, endnotes and glossary.
White slide with a large serif title at the bottom and a glass ring graphic at the top right, matching page 19.
Reconciles GAAP income before taxes ($241.6 million in Q3-26) to Realized Income ($490.1 million) and FRE ($524.2 million). Add-backs include $48.2 million of amortization of intangibles and $150.7 million of equity compensation, and it removes unrealized performance income and investment results. Footnotes cite the GCP International earnout and a $37.3 million bargain purchase gain from the BlueCove acquisition.
Single full-width reconciliation table with four numeric columns and highlighted RI and FRE rows, with a note and footnotes below.
Reconciles carried interest and incentive fees ($244.0 million) to realized performance income ($31.3 million), and total consolidated other income of $(43.2) million to the realized net investment loss of $(45.9) million.
Two-section reconciliation table with highlighted totals and an explanatory note.
Credit Group endnotes defining the composite returns behind page 6. Examples: alternative credit net 2.3% for the quarter and 10.0% LTM, and U.S. senior direct lending net 2.4% and 8.3%. Also covers the methodology for ARCC, CADC and ASIF returns and the MOIC and IRR definitions. The Credit Group had about 685 investment professionals and about 340 active funds.
Three columns of small-print numbered endnotes under a serif headline.
Continues the Credit Group endnotes with the fund structures and currency-class returns for ACE VI, SDL III, ACE III, ACE IV and ACE V. Begins the Real Assets endnotes: composite definitions, about 945 professionals and about 4,300 properties, and the J-REIT and non-traded REIT return methodology.
Three-column small-print endnotes.
Real Assets endnotes 7–18: the methodology for realized and unrealized value, MOIC and IRR, plus currency-class details for IDF V, EPEP II and EF V.
Three-column small-print endnotes.
Real Assets endnotes for IDF IV and EIP II, followed by the Secondaries Group endnotes: APMF return methodology, composite returns (private equity secondaries net (1.2)% for the quarter), about 120 professionals and about 105 active funds, and the MOIC and IRR definitions.
Three-column small-print endnotes.
Private Equity Group endnotes: composite methodology (corporate private equity net (1.1)% for the quarter), about 85 professionals and about 60 active funds, and the MOIC and IRR definitions, including bridge-financing-inclusive net IRRs (ACOF VI 13.6%, AEOF (7.4)%).
Two columns of small-print endnotes, leaving the right third blank.
Defines AOG entities and units, AUM, AUM Not Yet Paying Fees (shadow AUM), Available Capital (dry powder), Consolidated Funds, the common stock dividend policy, Effective Management Fee Rate, Fee Paying AUM, Fee Related Earnings and FRE margin.
Two-column definition table, with the term in a shaded left cell and the definition on the right.
Defines fee related performance revenues, gross capital deployment, incentive eligible and incentive generating AUM, management fees, net inflows of capital, the Operations Management Group (including Ares Wealth Management Solutions), Our Funds, Part I and Part II fees, and performance income.
Continuation of the two-column definition table.
Defines perpetual capital (including its managed-account and private-commingled subtypes) and Realized Income and after-tax Realized Income, including how the current income tax provision is applied.
Two long definition rows, leaving the lower half empty.
Lists the full legal names of the funds cited in the deck, e.g. ACE III–VI (Ares Capital Europe), ACOF IV–VII (Ares Corporate Opportunities Fund), APMF (Ares Private Markets Fund), ARCC (Ares Capital Corporation), ASIF (Ares Strategic Income Fund), the Landmark LEP and LREF funds, SDL II/III (Ares Senior Direct Lending) and US IX–XI (U.S. Real Estate Fund).
Three side-by-side acronym/fund-name tables.
Domande comuni su questa slide e il contenuto della presentazione sottostante.
It is the 47-page results deck Ares Management Corporation (NYSE: ARES) released for the quarter ended September 30, 2026. Ares filed it with the SEC as Exhibit 99.2 to a Form 8-K. It covers GAAP and non-GAAP results, fundraising, AUM, segment performance, fund returns, the balance sheet and reconciliations.
Fee Related Earnings were $524.2 million (+11% YoY), Realized Income $490.1 million (+8%) and after-tax Realized Income $1.26 per share. GAAP net income attributable to Ares was $85.3 million ($0.21 per share). AUM reached $690.6 billion (+16%) and FPAUM $416.4 billion (+13%).
Ares raised $31.0 billion gross, with net inflows of $28.6 billion. The Credit Group raised $15.2 billion and Real Assets $11.2 billion. Gross capital deployment was $34.8 billion, of which $22.3 billion was in Credit.
No. Ares is an alternative asset manager (GICS sub-industry Asset Management & Custody Banks) that runs private credit, real estate, infrastructure, secondaries and private equity funds. Its revenue comes mainly from management fees and performance income, not lending spreads on deposits.
It was filed on SEC EDGAR as an exhibit to Ares Management's Form 8-K. The slides are images rasterized at filing, so the very smallest footnote text can be hard to read. This page's page-by-page notes give the figures shown on each slide.
Yes. The page offers the original PDF and an editable PPTX converted from it. Because the filed slides are images, the PPTX is best used as a layout reference rather than as live, editable tables.
It follows a common alternative-manager structure: a highlights page, a GAAP income statement, a non-GAAP FRE and RI summary, AUM and fundraising charts, one page per investment group, then supplemental segment tables, rollforwards, fund performance metrics, reconciliations, endnotes and a glossary.
On October 26, 2026, ARCC (Ares Capital Corporation) agreed to acquire MidCap Financial Investment Corporation (NASDAQ: MFIC) in a stock-and-cash deal valued at about $2.6 billion of enterprise value. A subsidiary of Ares will provide the cash portion of the consideration.
The original filing of this earnings presentation as an exhibit to Ares Management Corporation's Form 8-K.

Create Your Own Slides
Turn your ideas into professional presentations in seconds with 2slides AI.
Fai riferimento a design professionali, scegli il tuo stile e genera slide con rendering del testo perfetto. Alimentato da Nano Banana—inizia a creare la tua presentazione ora.
Il Tuo Agente IA per le slide. Risparmia tempo, brilla più velocemente con la creazione intelligente di presentazioni.


© 2026 2slides. Tutti i diritti riservati.