
Fa parte di Esempi di presentazioni per investitori · Esempi di presentazioni per investitori nei semiconduttori
AMD Q3 2026 Earnings Presentation: Advanced Micro Devices' third quarter 2026 financial results deck, published on ir.amd.com on November 3, 2026, covering record revenue of $13.4 billion (up 45% y/y), record Data Center revenue of $8.5 billion (up 97% y/y), GAAP and non-GAAP P&L, segment results, balance sheet, Q4 2026 outlook of about $17 billion revenue, and GAAP to non-GAAP reconciliations.
Usa la copertina di questa presentazione come riferimento di stile per slide create con i tuoi contenuti. Oppure scegli una pagina qui sotto per usarne il layout come riferimento.
Navigazione Rapida
Tag
Condividi le slide
AMD Q3 2026 Earnings Presentation: Advanced Micro Devices' third quarter 2026 financial results deck, published on ir.amd.com on November 3, 2026, covering record revenue of $13.4 billion (up 45% y/y), record Data Center revenue of $8.5 billion (up 97% y/y), GAAP and non-GAAP P&L, segment results, balance sheet, Q4 2026 outlook of about $17 billion revenue, and GAAP to non-GAAP reconciliations.
Vista dettagliata di ogni pagina di slide, inclusi layout, contenuto chiave ed elementi visivi.
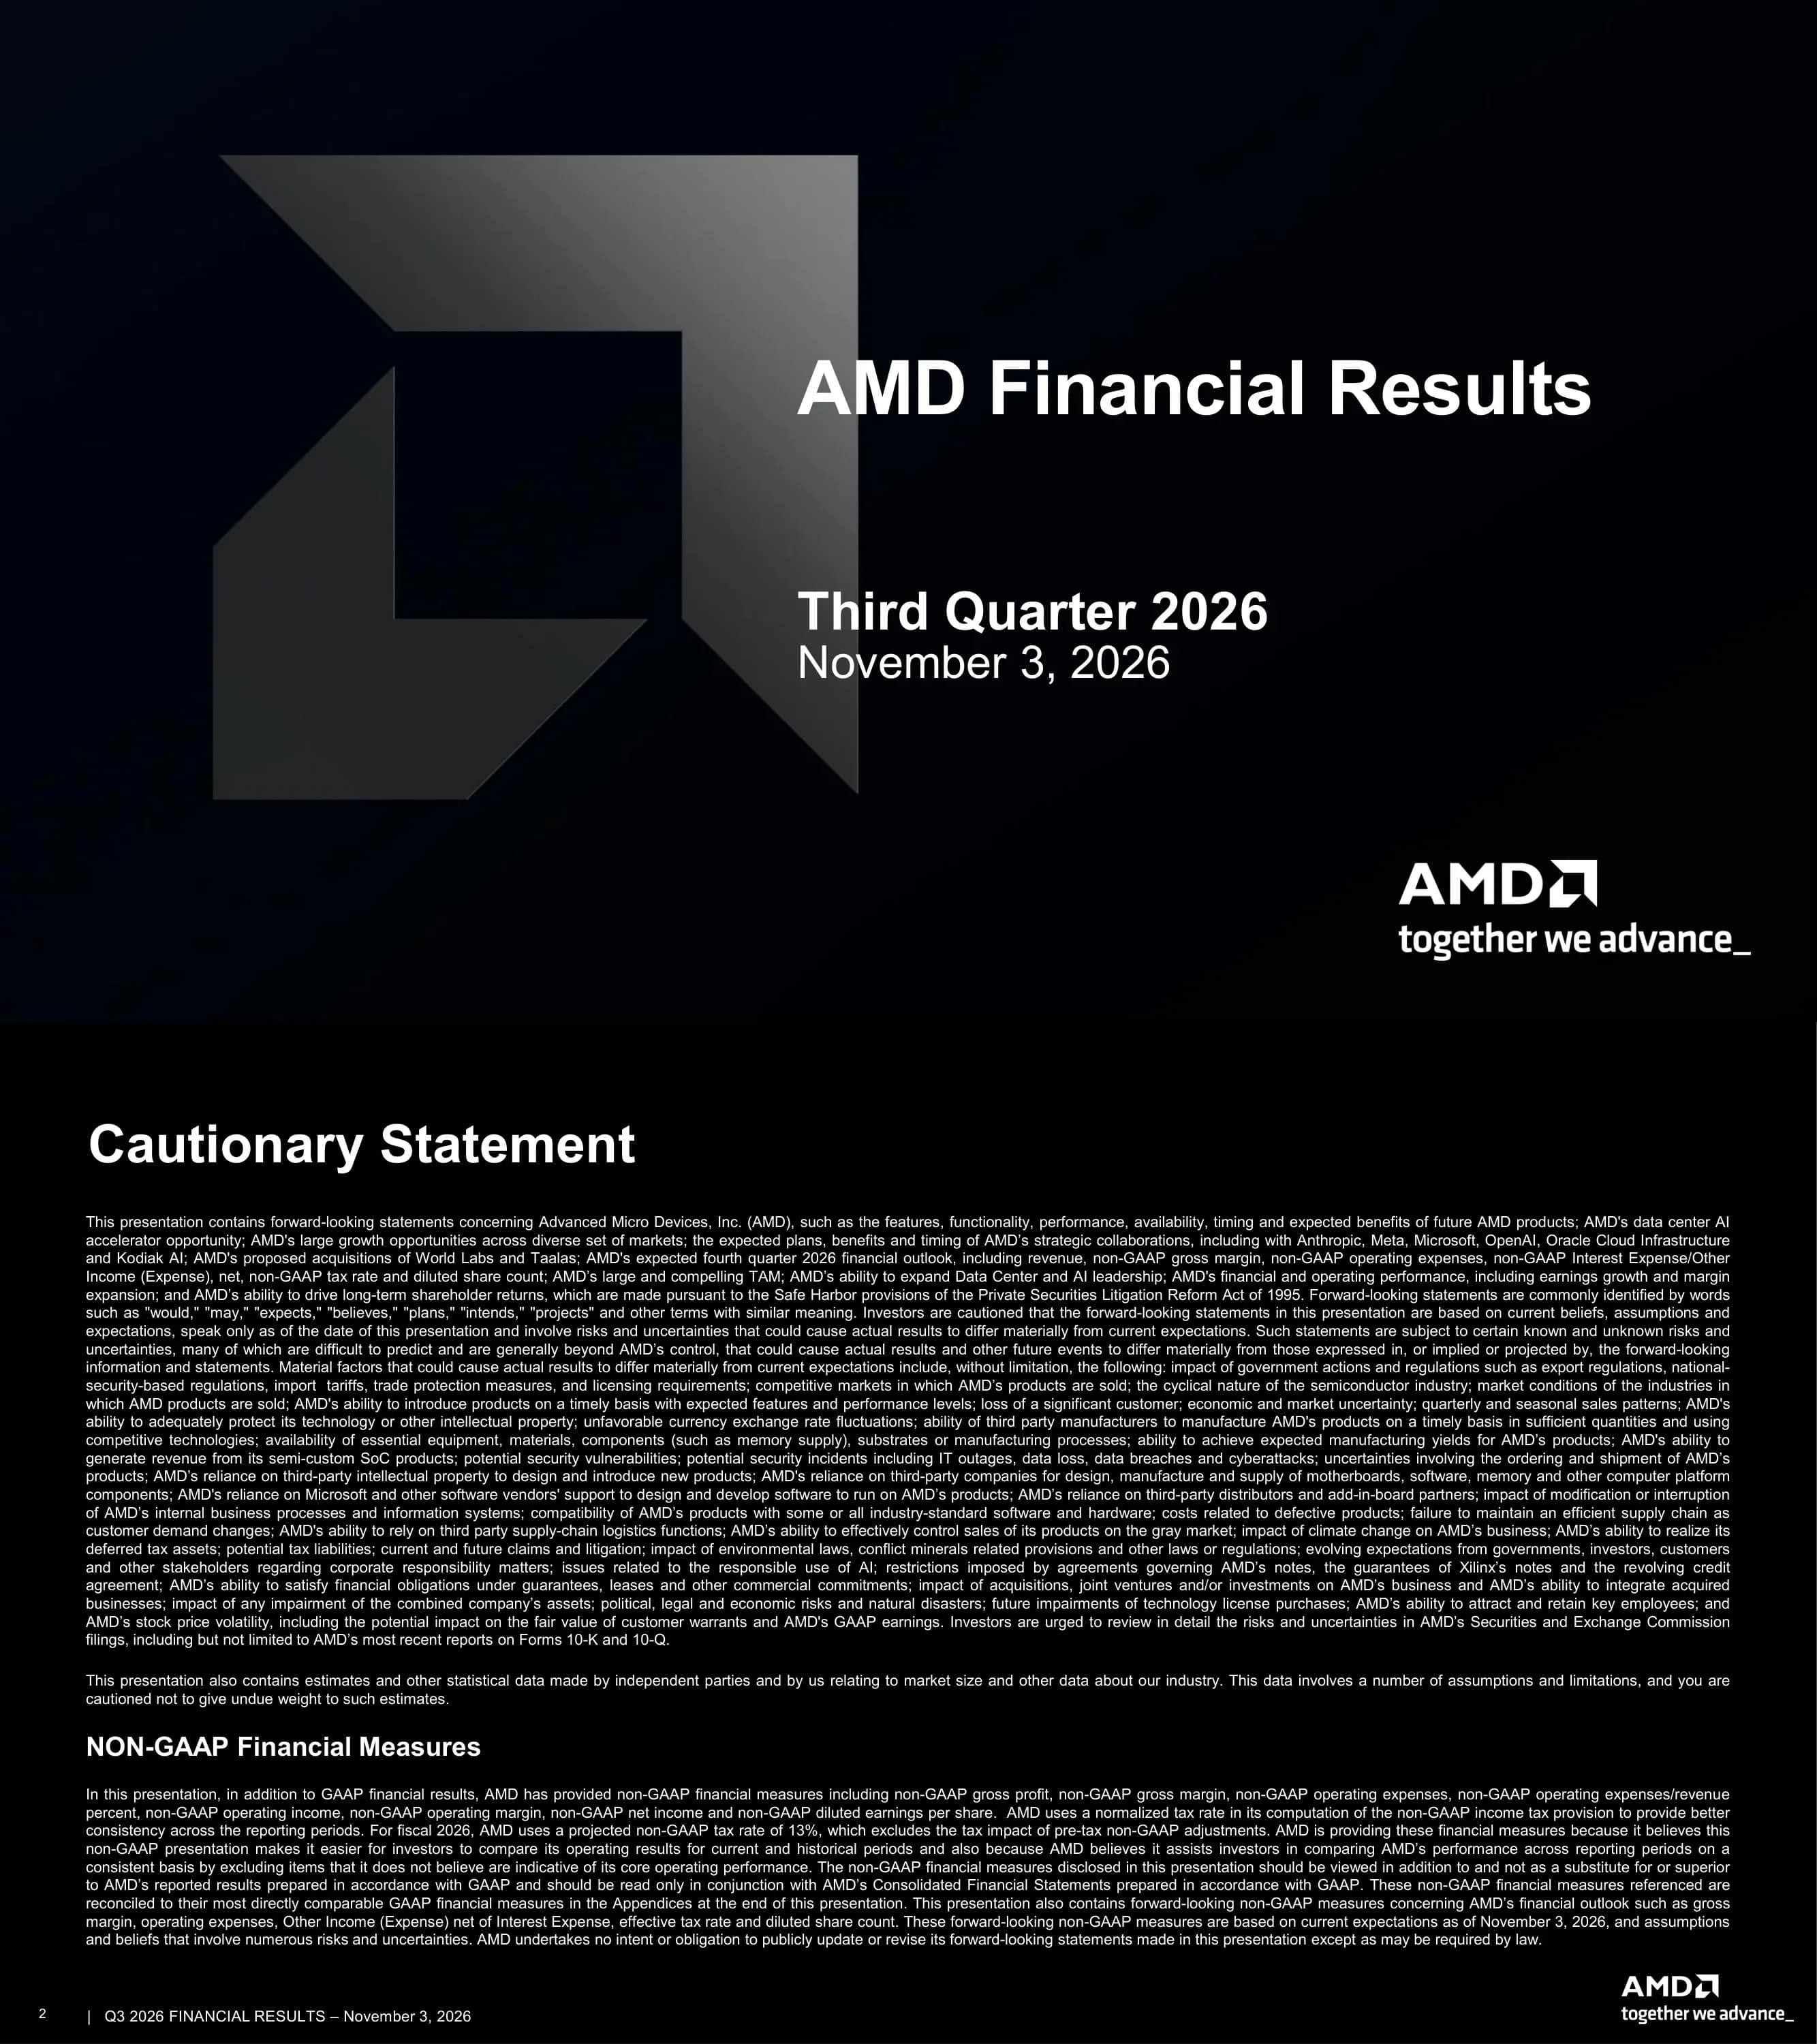
Cover slide titled AMD Financial Results, Third Quarter 2026, dated November 3, 2026, with the AMD logo and the tagline together we advance.
Full-bleed black background with a large grey 3D AMD arrow mark on the left and white title and date text on the right; logo and tagline bottom right.
Safe Harbor forward-looking statement covering products, the data center AI accelerator opportunity, collaborations with Anthropic, Meta, Microsoft, OpenAI, Oracle Cloud Infrastructure and Kodiak AI, the proposed acquisitions of World Labs and Taalas, and Q4 2026 outlook; a non-GAAP section explains the measures used and a projected fiscal 2026 non-GAAP tax rate of 13%.
Dense two-section text slide: Cautionary Statement heading with full-width justified paragraphs, then a NON-GAAP Financial Measures sub-heading and paragraph.
Four strategic themes: Leadership Product Portfolio, Expanding Customer and Partner Ecosystem, Data Center and AI Growth, and Strong Financial Foundation.
AMD logo and Our Journey title on the left, vertical divider, and a stacked list of four rows on the right, each with a gold icon tile and a bold label separated by thin rules.
Powering AI and High-Performance Compute Everywhere through four pillars: Extend Compute Technology Leadership (CPU, GPU, FPGA, networking, SoC, chiplets and packaging), Expand Data Center Leadership (cloud, enterprise and rack-scale solutions), Open Software Platforms and Developer Enablement (production-grade ROCm software stack), and Powering AI Everywhere (high-performance, adaptive and custom AI platforms).
Centered title with gold subtitle, then four equal photo cards in a row, each with a white pillar name and gold descriptor beneath a divider.
Three addressable markets: Data Center (leadership performance and TCO across cloud, enterprise and AI workloads; EPYC, Instinct, Alveo, Virtex, Kintex, Solarflare, Zynq, Versal), Client and Gaming (performance, efficiency and AI for commercial and consumer PCs and gaming; Ryzen and Radeon), and Embedded (broadest portfolio of adaptive and embedded computing platforms; Ryzen Embedded, EPYC Embedded, Alveo, Kria, Spartan, Kintex, Virtex, Zynq, Versal, Artix).
Three vertical columns, each with a photo, a gold header band, a grey description panel and a brand-logo grid footer.
Record revenue of $13.4 billion, up 45% y/y from $9.2 billion in Q3 2025, driven by record Data Center revenue up 97% y/y and strong Embedded growth, partially offset by a decline in Client and Gaming.
Two callout boxes with gold chevron bullets on the left; two-bar column chart on the right comparing Q3 2025 (grey) and Q3 2026 (gold).
GAAP gross margin rose from 52% to 54% and non-GAAP gross margin from 54% to 56% year over year; non-GAAP gross margin was up 190 bps y/y driven by richer product mix.
Two side-by-side panels labelled GAAP and Non-GAAP, each with a two-bar chart, and a full-width grey takeaway banner below.
GAAP operating income grew from $1.3 billion to $2.8 billion and non-GAAP operating income from $2.2 billion to a record $3.9 billion, up 75% y/y, driven by higher revenue.
Same GAAP vs Non-GAAP twin-panel bar chart layout with a takeaway banner.
GAAP diluted EPS rose from $0.75 to $1.46 and non-GAAP diluted EPS from $1.20 to a record $2.09, up 74% y/y, driven by higher revenue and operating income.
GAAP and Non-GAAP twin-panel bar charts with a full-width summary banner.
GAAP table ($ millions): revenue $13,377 vs $9,246 (up 45% y/y) and $11,536 in Q2'26 (up 16% q/q); gross profit $7,210 (54% margin, up 2 ppts y/y, flat q/q); operating expenses $4,378 (33% of revenue); operating income $2,832 vs $1,270 (up 123% y/y), operating margin 21%; net income $2,428 vs $1,243 (up 95%); diluted EPS $1.46 vs $0.75 and $1.38 in Q2'26.
Full-width financial table with gold header row, columns Q3'26 (highlighted grey), Q3'25, Y/Y, Q2'26, Q/Q, and alternating row shading.
Non-GAAP table ($ millions): revenue $13,377; gross profit $7,483 vs $4,992 (up 50% y/y), gross margin 56%; operating expenses $3,560 (27% of revenue, down 3 ppts y/y); operating income $3,923 vs $2,238 (up 75% y/y, up 27% q/q), operating margin 29%; net income $3,471 vs $1,965 (up 77%); diluted EPS $2.09 vs $1.20 and $1.66 in Q2'26.
Identical table layout to the GAAP P&L for easy side-by-side comparison, with a reconciliation footnote.
Data Center net revenue $8,546M (up 97% y/y, up 27% q/q) with operating income $2,882M (up 168% y/y); Client and Gaming net revenue $3,722M (down 8% y/y, down 3% q/q) with operating income $573M (down 34% y/y); Embedded net revenue $1,109M (up 29% y/y, up 14% q/q) with operating income $453M (up 60% y/y).
Grouped table with gold segment sub-headers and net revenue and operating income rows under each, columns Q3'26, Q3'25, Y/Y, Q2'26, Q/Q.
Cash, cash equivalents and short-term investments a record $15,776M (up 20% q/q from $13,111M); accounts receivable $9,209M (up 26%); inventories $11,463M (up 35% from $8,468M); total debt $7,079M (up 119% from $3,226M), including the $4.75 billion senior notes offering completed in August.
Four-row table with Q3'26, Q2'26 and Q/Q columns and a grey commentary banner below.
Revenue $8.5 billion, up 97% y/y from $4.3 billion, driven by strong demand for EPYC processors and the launch of Instinct MI450 Series GPUs; operating margin 34% vs 25% and operating income $2.9 billion vs $1.1 billion. Highlights: Anthropic, Meta, Microsoft, OpenAI and Oracle Cloud Infrastructure running workloads on the first AMD Helios rackscale solutions; the Helion reference architecture for rack-scale agentic systems; agreements to acquire World Labs and Taalas; ROCm 10 with ROCm.AI; OCI Compute E7 instances powered by 6th Gen EPYC CPUs.
Three-column segment template: revenue bar chart with callout box, operating margin bar chart with callout box, and a Strategic Highlights panel with brand logos and bullets.
Revenue $3.7 billion, down 8% y/y from $4.0 billion; Client rose to $2.9 billion from $2.8 billion while Gaming fell to $0.8 billion from $1.3 billion on lower semi-custom and graphics sales. Operating margin 15% vs 21%, operating income $573 million vs $867 million. Highlights: Ryzen AI Halo platform with Ryzen AI Max PRO 400 Series, expanded HP and Lenovo systems, and the Threadripper Halo Station combining Threadripper 9955WX with Instinct-class graphics.
Same three-column segment template, with a stacked bar chart splitting Client and Gaming revenue.
Revenue $1,109 million, up 29% y/y from $857 million, driven by aerospace and defense, automotive, communications and industrial markets; operating margin 41% vs 33%, operating income $453 million vs $283 million. Highlights: sampling Versal AI Core XQRVC1902 space-grade adaptive SoCs, Kodiak AI's next-generation autonomous truck platform powered by EPYC, and AMD Ross, an agentic tool for embedded system design.
Same three-column segment template with revenue and margin bar charts plus a Strategic Highlights panel.
Q4'26 guidance: revenue approximately $17 billion +/- 3%, non-GAAP gross margin ~55%, operating expenses ~$3.75 billion, other income (expense) net of interest expense ~$4 million, effective tax rate 13% of pre-tax income, and diluted share count ~1.67 billion shares; footnotes explain that a GAAP reconciliation of the outlook is not practicable.
Two-column guidance table with a single Q4'26 value column, followed by small-print footnotes.
Recap tiles: revenue $13.4B up 45% y/y; Data Center $8.5B up 97%, Client and Gaming $3.7B down 8%, Embedded $1.1B up 29%; gross margin 54% (non-GAAP 56%); diluted EPS $1.46 (non-GAAP $2.09). Banner: record revenue and record non-GAAP earnings driven by Data Center growth.
Four equal dark tiles with gold top borders and a full-width gold banner beneath.
Environmental, Social and Governance commitments in three columns, plus recognition badges: CDP Climate 2025 A-, 100 Best Corporate Citizens 2025, HRC Equality 100 2025, EcoVadis Gold Top 5% (Dec 2025), MSCI ESG rating AA as of July 2026, and ISS ESG Corporate ESG Performance Prime; MSCI disclaimer in small print.
Three gold-headed text panels over a grey band, a row of six award logos, and a footnote disclaimer.
Five strengths, Large and Compelling TAM, Technology Leadership, Expanding Data Center and AI Leadership, World-Class Execution and Focus, and Strong Balance Sheet, all supporting Driving Long-term Shareholder Returns.
Centered logo and title, a row of five dark tiles with gold top rules, and a full-width gold foundation banner.
GAAP gross profit $7,210M (54%) to non-GAAP $7,483M (56%) after stock-based compensation $9M, amortization of acquisition-related intangibles $257M and loss contingency on legal matters $7M; GAAP operating expenses $4,378M to non-GAAP $3,560M after stock-based compensation $514M, amortization $277M and acquisition-related and other costs $27M, with Q2'26 and Q3'25 comparatives.
Two stacked reconciliation tables with gold headers and columns Q3'26, Q2'26, Q3'25, plus two footnotes.
GAAP operating income $2,832M (21% margin) to non-GAAP $3,923M (29%) after stock-based compensation $523M, amortization of acquisition-related intangibles $534M, acquisition-related and other costs $27M and loss contingency $7M; Q2'26 $1,990M to $3,094M and Q3'25 $1,270M to $2,238M, the latter including a $(67)M recovery of inventory loss at a contract manufacturer.
Single reconciliation table in the upper half of the slide with footnotes at the bottom.
GAAP net income $2,428M ($1.46) to non-GAAP $3,471M ($2.09) after stock-based compensation $523M, amortization $534M, acquisition costs $27M, legal contingency $7M, gains on long-term investments $(67)M, a $1,097M ($0.66) change in fair value of warrant liability for warrants issued to certain customers, equity income $(5)M and income tax provision $(1,073)M; Q2'26 $2,297M to $2,760M and Q3'25 $1,243M to $1,965M; footnote notes ZT Systems' manufacturing business divested in Q4'25.
Wide reconciliation table with paired dollar and per-share columns for each of three quarters, and four footnotes.
Weighted average shares (millions): Q3'26 actual basic 1,636, dilutive employee equity grants 25, diluted 1,661; Q4'26 estimate basic 1,647, dilutive 21, diluted 1,668. Footnotes give the Q3'26 average stock price of $511, the $587 average used for the Q4 estimate, and note the estimate includes shares for the Taalas and World Labs acquisitions and is not expected to be impacted by customer warrants.
Compact table with actual and estimate sub-headers, followed by explanatory paragraphs.
Closing slide showing the white AMD wordmark and arrow logo centered on black.
Single centered logo on a full black background with the standard footer.
Domande comuni su questa slide e il contenuto della presentazione sottostante.
It is AMD's 25-slide deck for third quarter 2026 results, dated November 3, 2026. It covers record revenue of $13.4 billion (up 45% y/y), gross margin, operating income, EPS, GAAP and non-GAAP P&L tables, Data Center, Client and Gaming, and Embedded segment results, balance sheet items, Q4 2026 guidance, ESG recognition, and GAAP to non-GAAP reconciliations.
Data Center revenue was a record $8,546 million, up 97% y/y and 27% q/q, with operating income of $2,882 million and a 34% operating margin. AMD attributes the growth to strong EPYC processor demand and the launch of Instinct MI450 Series GPUs.
AMD guided Q4 2026 revenue to approximately $17 billion, plus or minus 3%, with non-GAAP gross margin of about 55%, non-GAAP operating expenses of about $3.75 billion, a 13% effective tax rate and about 1.67 billion diluted shares.
The reconciliation on slide 23 shows GAAP net income of $2,428 million and non-GAAP of $3,471 million. Besides stock-based compensation ($523 million) and amortization of acquisition-related intangibles ($534 million), the largest adjustment is a $1,097 million change in fair value of warrant liability for warrants issued to certain customers, partly offset by a $(1,073) million income tax provision adjustment.
It is AMD's official earnings presentation, published on the AMD investor relations site (ir.amd.com) alongside its third quarter 2026 results on November 3, 2026. AMD trades on NASDAQ under the ticker AMD.
Yes. The original PDF is available to download from this page, and every slide is described above so you can scan the figures before opening the file.
It is a strong structural reference: cover, cautionary statement, strategy, headline metric charts, GAAP and non-GAAP P&L tables, three-panel segment slides, outlook table, summary tiles and reconciliation appendix. You can recreate the black-and-gold layouts with your own numbers in 2Slides; AMD's logos and brand assets remain AMD's property.
This deck is part of the 2Slides semiconductor investor presentations collection, which gathers earnings and investor day decks from chip designers, memory makers and equipment companies, so you can compare AMD's quarter with its peers.
Official source of AMD quarterly earnings releases, presentations and SEC filings.

Create Your Own Slides
Turn your ideas into professional presentations in seconds with 2slides AI.
Fai riferimento a design professionali, scegli il tuo stile e genera slide con rendering del testo perfetto. Alimentato da Nano Banana—inizia a creare la tua presentazione ora.
Il Tuo Agente IA per le slide. Risparmia tempo, brilla più velocemente con la creazione intelligente di presentazioni.


© 2026 2slides. Tutti i diritti riservati.