
Fa parte di Esempi di presentazioni per investitori · Esempi di presentazioni agli investitori indiane
Adani Enterprises Limited (AEL) Q2 FY27 earnings presentation (quarter ended 30 September 2026), filed with BSE/NSE on 28 October 2026. All amounts are in ₹ crore unless stated; India's FY27 runs from April 2026 to March 2027, so Q2 FY27 is July–September 2026 and H1-27 is April–September 2026. The 46-slide deck reports record half-year EBITDA of ₹11,958 crore (up 56% YoY), H1-27 total income of ₹71,569 crore (up 62%), and walks through AEL's incubation portfolio: Adani New Industries (solar and wind manufacturing), AdaniConneX data centers, Adani Airport Holdings, Adani Road Transport, mining services, IRM, commercial mining and the Mundra copper smelter, followed by debt, capex, ESG and governance detail.
Usa la copertina di questa presentazione come riferimento di stile per slide create con i tuoi contenuti. Oppure scegli una pagina qui sotto per usarne il layout come riferimento.
Navigazione Rapida
Tag
Condividi le slide
Adani Enterprises Limited (AEL) Q2 FY27 earnings presentation (quarter ended 30 September 2026), filed with BSE/NSE on 28 October 2026. All amounts are in ₹ crore unless stated; India's FY27 runs from April 2026 to March 2027, so Q2 FY27 is July–September 2026 and H1-27 is April–September 2026. The 46-slide deck reports record half-year EBITDA of ₹11,958 crore (up 56% YoY), H1-27 total income of ₹71,569 crore (up 62%), and walks through AEL's incubation portfolio: Adani New Industries (solar and wind manufacturing), AdaniConneX data centers, Adani Airport Holdings, Adani Road Transport, mining services, IRM, commercial mining and the Mundra copper smelter, followed by debt, capex, ESG and governance detail.
Vista dettagliata di ogni pagina di slide, inclusi layout, contenuto chiave ed elementi visivi.
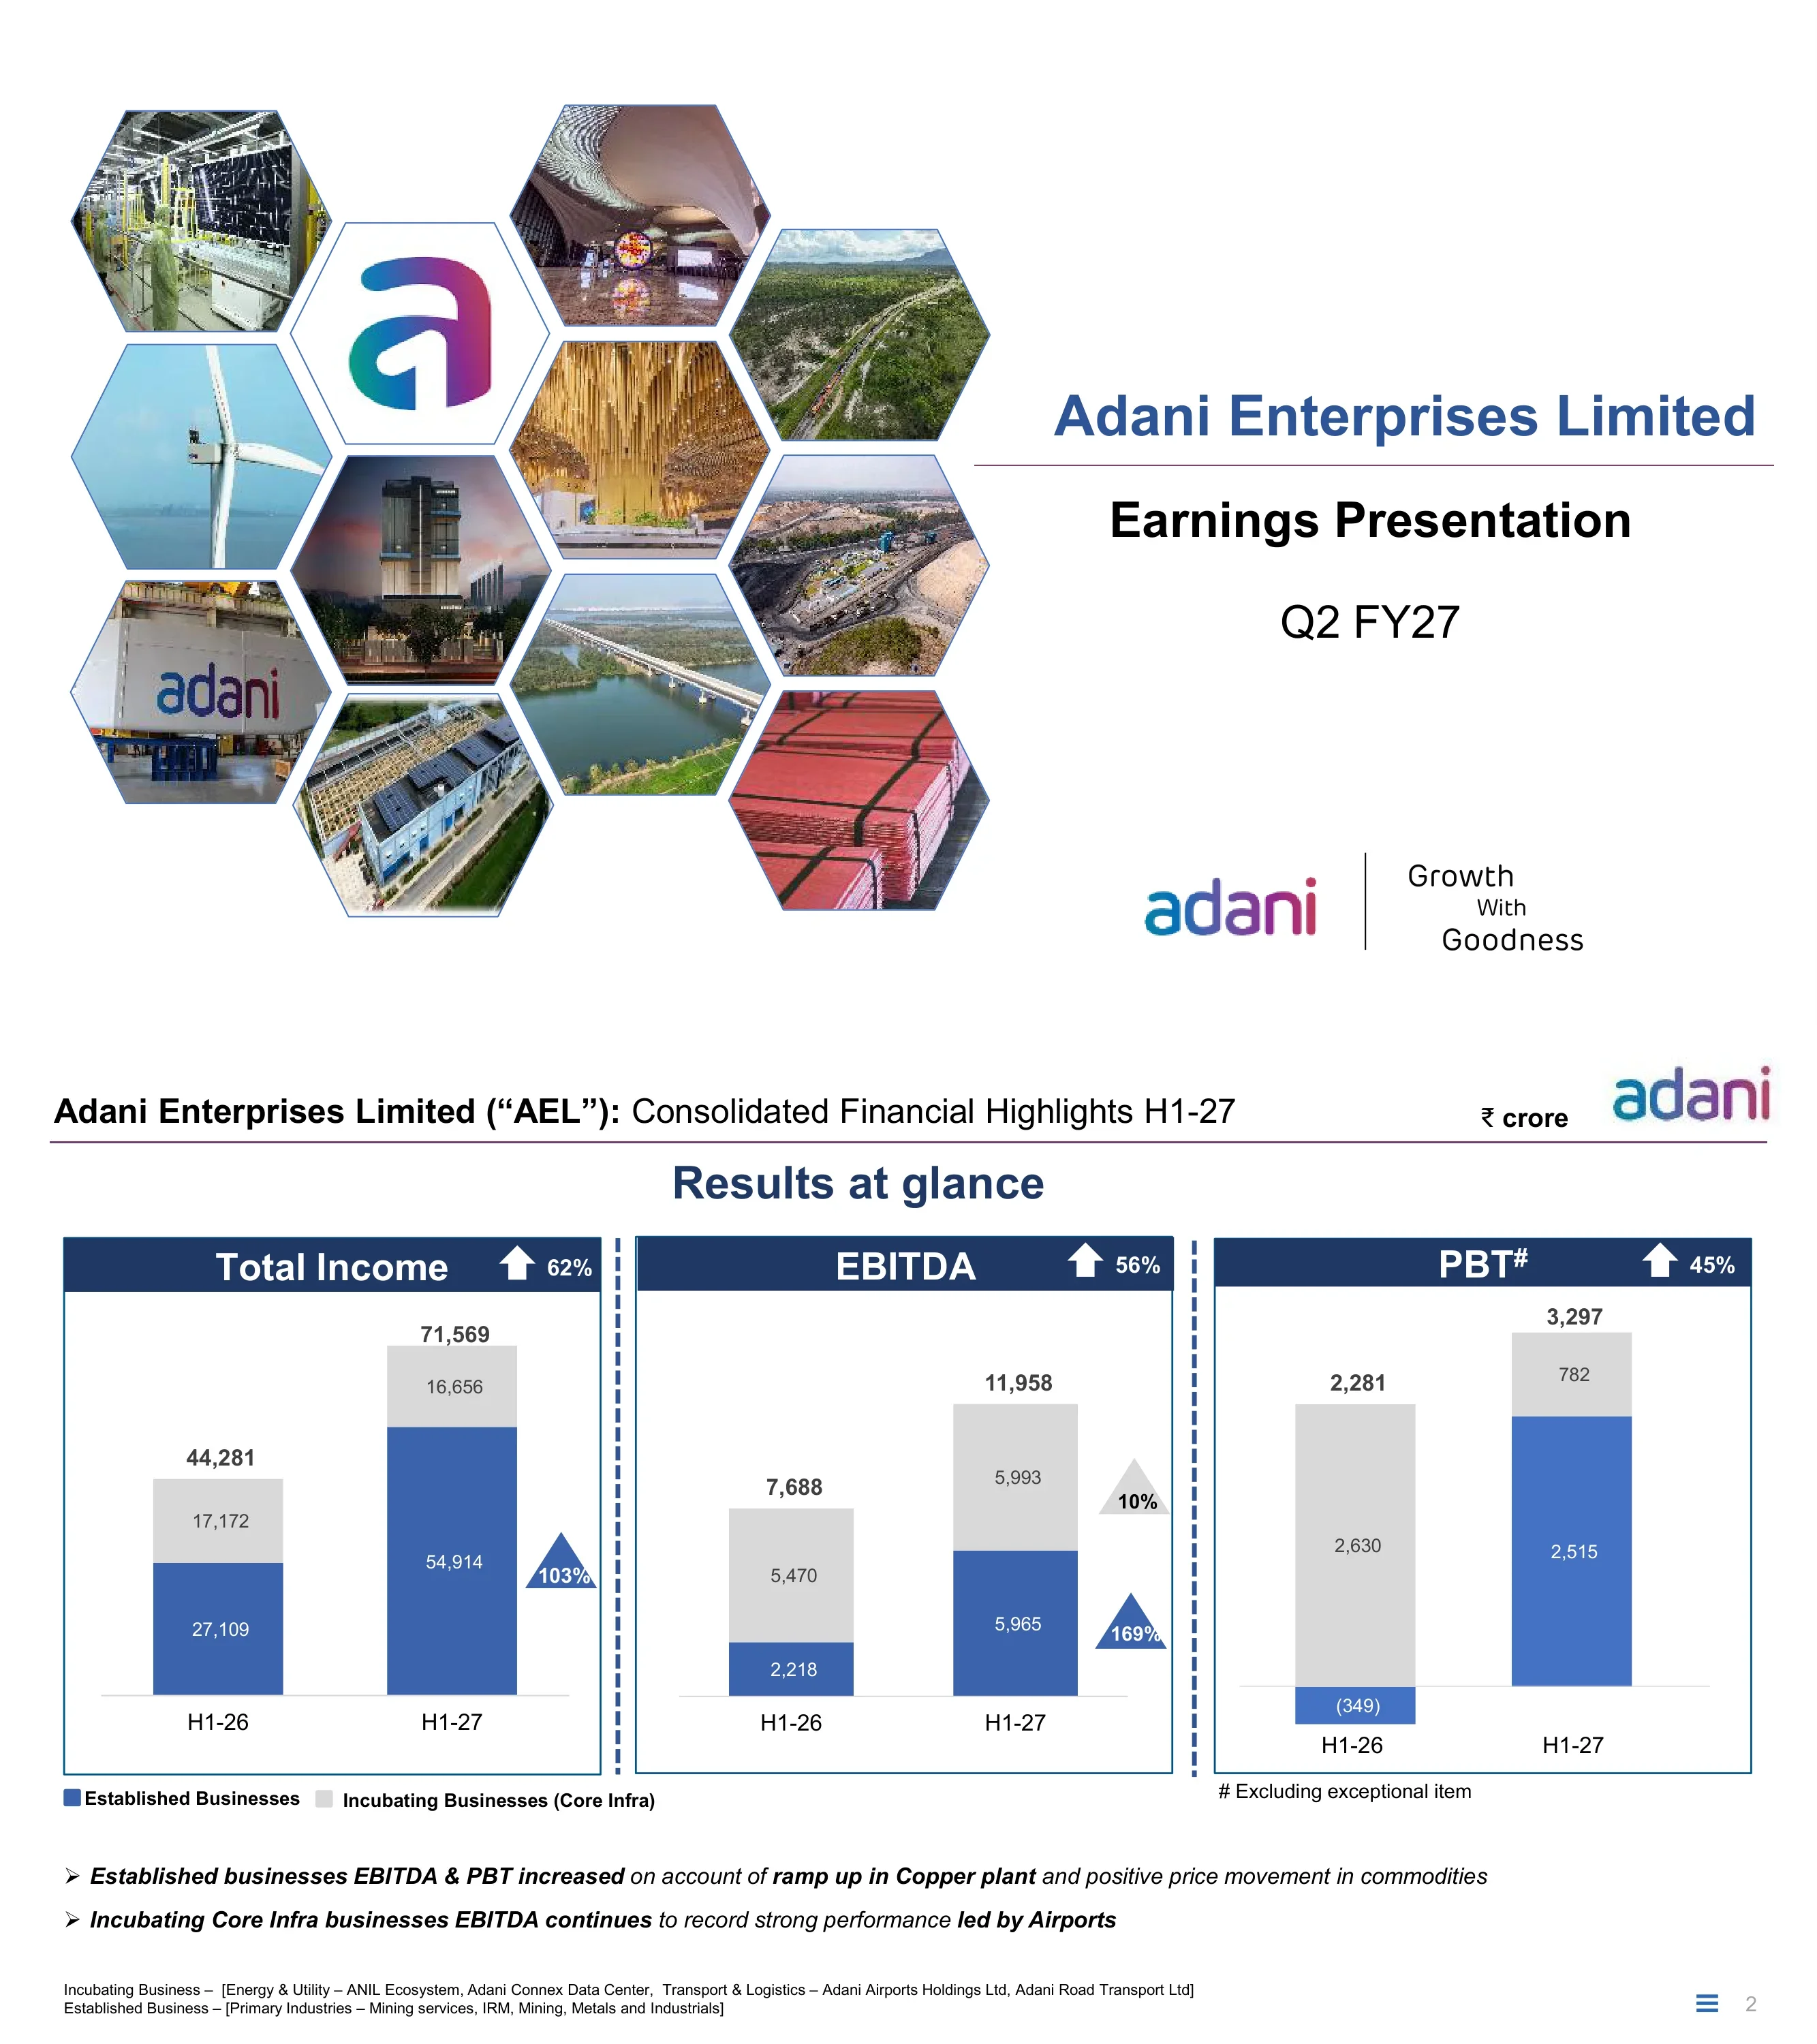
Cover slide titled 'Adani Enterprises Limited — Earnings Presentation — Q2 FY27' with the Adani logo and 'Growth with Goodness' tagline.
Left half filled with a honeycomb collage of hexagonal photos (solar factory, airport, wind turbine, data center, copper cathodes, highway, the 'a' brand mark); right half carries the centered title block and logo.
H1-27 vs H1-26 in ₹ crore: Total Income 71,569 vs 44,281 (up 62%), split Established 54,914 (up 103%) and Incubating Core Infra 16,656; EBITDA 11,958 vs 7,688 (up 56%), Established 5,965 (up 169%) and Incubating 5,993 (up 10%); PBT (excluding exceptional item) 3,297 vs 2,281 (up 45%), Established 2,515 vs (349) and Incubating 782 vs 2,630. Commentary: established businesses' EBITDA and PBT rose on the copper plant ramp-up and commodity prices; Core Infra EBITDA led by airports.
Three bordered panels side by side, each with a navy header (metric name and YoY arrow) and a two-bar stacked column chart (H1-26 vs H1-27); two arrow-bullet takeaways and a footnote defining the business groupings below.
EBITDA by portfolio, H1-26 vs H1-27 (₹ crore): Core Infra Platform (new energy, airports, roads) 5,470 to 5,993 (up 10% YoY); Long-Term Contracted Services (mining services) 1,019 to 828 (down 19%); Primary Industry (metals, mining, IRM and specialist manufacturing) 1,199 to 5,137 (up 3.3x). Headline: highest half-year EBITDA of Rs. 11,958 cr, up 56% YoY. Drivers: an additional 4.3 GW module line from 1 September 2026, 55% growth in airport non-aero, higher fuel costs in mining services, copper plant utilization up to 64%, better IRM and mining price realization. Banner: full ramp-up of Navi Mumbai Airport and Ganga Expressway on the horizon.
Three-column grid: portfolio categories with icons on the left, an H1-26/H1-27 EBITDA comparison box in the middle, and checkbox commentary boxes on the right; a navy banner across the bottom.
Agenda: 01 Adani Portfolio Overview; 02 AEL – Largest Listed Incubator; 03 Business & Operational Highlights; 04 Financial Highlights; 05 Debt Profile; 06 ESG Highlights; Standard FAQs; Appendix.
Right-aligned numbered list with thin divider rules between items, generous white space on the left.
Section divider introducing the Adani portfolio overview.
Oversized light-grey numeral '01' with the section title in navy below; logo top right.
Group structure chart showing Adani family stakes in listed companies — AEL (71.97%), AGEL (62.43%), APL (74.96%), AESL (73.39%), ATGL (37.40%), APSEZ (66.03%), Ambuja Cements (67.29%) with ACC (50.05%) and Orient (72.66%) — and AEL's stakes in its subsidiaries: ANIL (100%), AdaniConneX (50.00%), AAHL airports (100%), ARTL roads (100%), copper/aluminium, PVC, mining services and commercial mining (100%), NDTV (69.02%), GCC and specialist manufacturing (100%). Footnotes note AAHL's binding agreements in September 2026 to raise INR 9,825 crore (~USD 1 Bn) of primary equity, giving investors 5.54% once completed. Banner: 'A multi-decade story of high growth centered around infrastructure & utility core'.
Org-chart style grid with column headers (Flagship, Infrastructure & Utility Core Portfolio, Primary Industry, Other) and rectangular company boxes labelled with ownership percentages; dense footnote block at bottom.
Left: area chart of portfolio EBITDA from 24,870 in FY19 to 94,834 in FY26 (INR cr), split into tax paid, finance cost paid and cash after tax (FFO), with EBITDA CAGR of 21% and CAT (FFO) CAGR of 27%; labelled points include FFO of 67,995 (72%) in FY26. Right: India map with colored dots for AEL, APSEZ, AGEL, ATGL, AESL, APL and Ambuja Cement assets, and a callout 'Adani's Core Infra. Platform – 375 Mn Userbase'.
Two side-by-side panels with navy title bars: stacked area chart on the left, dot map of India with legend and a blue stat card on the right.
The group operating model in three stages — Development (Adani Infra, Cemindia Projects, PSP Projects: origination, site development, construction), Operations (AIMSL: life-cycle O&M, asset management) and Consumers (new C.E.O. – consumer, employees, other stakeholders). Performance examples: India's largest commercial port at Mundra, longest private HVDC line in Asia, world's largest renewable cluster at Khavda, Energy Network Operation Center. Capital management rows show long-term debt mix shifting between March 2016 and March 2026 (pie charts by PSU banks, private banks, USD bonds, NBFCs & FIs, DII, global international banks, capex LC). Enabler row covers human capital and AI-enabled digital transformation.
Matrix with vertical row labels (Activity, Performance, Capital Management, Enabler) and three column stages separated by chevrons; photo strip in the performance row and two donut charts in the capital row.
Section divider for AEL's role as the group's incubator.
Large grey numeral '02' with navy section title.
Three rows (Development, Operations, Sustainable value creation) with nine boxes: incubation record (APSEZ, APL and AESL in 2015; AGEL and ATGL in 2018); new energy ecosystem (ingots, wafers, cells, modules, wind turbines, electrolysers for green hydrogen); B2B (ANIL, data center) and B2C (airports, roads) models; WTG of 5.2 MW type-certified by WINDGUARD; new 6 GW TopCon module line; capacity scaling (module line 10 GW, cell line 4 GW to 10 GW); shareholder value CAGR of 30.95% over 30 years and market cap of USD 41.0 Bn (as of 30 Sept 2026); consolidated net debt/equity of 0.70x in H1-27; S&P DJSI 2025 score of 64 and CDP Climate Change 2025 A rating.
3×3 card grid with navy chevron row labels on the left; each card has a navy title strip and centered grey-background body text.
AEL business portfolio tree: Infrastructure & Utility Core Portfolio (Energy & Utility — new energy ecosystem, data center, water; Transport & Logistics — airports, roads), Primary Industry (Services — mining services, integrated resource management; Metals — copper, aluminium, PVC; Mining — commercial mining) and Others (Specialty — media, specialist manufacturing incl. defence and aerospace). Outlined boxes mark direct consumer businesses.
Hierarchical block diagram: full-width navy title bar, three light-blue category bars, navy sub-category tiles and grey business tiles beneath; navy banner at bottom.
Section divider for business and operational highlights.
Large grey numeral '03' with blue section title.
Airports: aero and non-aero revenue grew 9% and 57% YoY in Q2-27. New Energy: a 4.3 GW TopCon module line commissioned from September 2026, taking module capacity to 10 GW. Data Center: 19.2 MW in Pune and 10 MW in Noida handed over, taking operational capacity to 94.6 MW; a 240 MW Navi Mumbai order lifts tied-up capacity to 1.2+ GW. Credit Rating: long-term rating upgraded to AA Stable, the highest in AEL's history.
Four horizontal rows, each with a blue chevron label on the left and checkbox bullet text on the right, separated by thin rules.
Solar manufacturing capacity: module 10.0 GW (8.0 GW TopCon, 2.0 GW MonoPerc), cell 4.0 GW (2.0 GW TopCon, 2.0 GW MonoPerc), a further 6.0 GW cell line expected by FY27 year-end, ingot & wafer 2.0 GW operational; module line ramp-up expected in H2-27. Wind: 2.25 GW WTG plant with four ALMM-listed models (5.2 MW 160m RD at 120m and 140m hub heights, 3.0 MW 147m RD, 3.3 MW 164m RD); prototype certificate received for a 5.0 MW model. Module sales rose 15% from 2,443 MW in H1-26 to 2,818 MW in H1-27 (Q1-27 1,340 MW, Q2-27 1,478 MW, all domestic); WTG sales rose 57% from 63 to 99 sets.
Two stacked bands (Solar, Wind), each with a factory photo, a capacity/remarks table and a pair of quarterly stacked column charts on the right; dashed callout boxes under each table.
Data center platform status by site (total growth / operational): Chennai 33 MW / 17 MW; Noida 50 MW / 20 MW (C&S complete, MEP under way); Hyderabad 406 MW / 19.2 MW; Pune 96 MW / 38.4 MW; Navi Mumbai 460 MW (Ghansoli 220 MW under execution, Taloja 240 MW new order); Vizag 400 MW (two buildings started). Totals: 94.6 MW operational, 1.2+ GW tied up, 1.4+ GW total capacity; 100% uptime; commitment to a 3 GW platform by 2031.
India map with site pins on the left under a navy title bar; right side is a three-column table (total growth, data center status, operational capacity) with navy number tiles; callout box and bottom banner.
Portfolio of 8 airports (Ahmedabad, Lucknow, Jaipur, Guwahati, Thiruvananthapuram, Mumbai + Navi Mumbai, Mangaluru) serving about 23% of India's passengers, 21% of air traffic movements and 29% of cargo. H1-27 vs H1-26: passengers 45.5 Mn vs 46.0 Mn; ATMs 305.1 thousand vs 301.7 thousand; cargo 6.1 vs 5.7 lakh MT. Eight new routes and four new airlines added in the quarter; Ahmedabad and Mangaluru received ACI Level 5 accreditation.
India map with airport pins on the left; right panel 'Aero Performance' with three stacked bar pairs (Pax, ATM, Cargo) and grey label buttons; bullet box and navy banner at bottom.
Airport total income (₹ crore) Q2-26 vs Q2-27: aero 1,145 to 1,243, non-aero 1,424 to 2,235, cargo 200 to 236, others 398 to 72, total 3,167 to 3,786; H1-26 vs H1-27: aero 2,229 to 2,501, non-aero 2,823 to 4,371, cargo 382 to 457, others 448 to 220, total 5,882 to 7,549. H1-27 mix: non-aero 58%, aero 33%, cargo 6%, others 3%. Aero up 12% with yield per pax of INR 550 (up 13%), driven by NMIA; non-aero up 55% with income per pax of INR 961 (up 56%). Waterfall from 5,882 adds 272 aero, 1,548 non-aero, 75 cargo and (228) others to reach 7,549.
Left: large pie chart with four callout boxes; top right: revenue table; bottom right: waterfall chart labelled 'Revenue Build-up H1-27'.
Monthly (Jul/Aug/Sep) service-level bar charts for seven airports (AMD, LKO, IXE, BOM, JAI, GAU, TRV) against benchmarks for security check queue, immigration, car parking and check-in (95% thresholds such as under 20 minutes for security and check-in). Non-aero revenue (₹ crore) Q2-26 vs Q2-27 and H1-26 vs H1-27: duty free 498/608 and 956/1,180; F&B and lounge 235/449 and 466/808; lease & retails 286/538 and 549/1,032; ground handling 67/183 and 126/388; car park 75/85 and 150/167; passenger services & others 263/372 and 576/796; total 1,424/2,235 and 2,823/4,371. H1-27 non-aero mix pie: duty free 27%, lease & retails 24%, F&B 18%, passenger services & others 18%, ground handling 9%, car park 4%. Prior-period mix reclassified.
Left half: four small multiple clustered bar charts with a red benchmark line and a KPI benchmark table beneath; right half: non-aero revenue table above a pie chart.
Portfolio of 21 road projects: 14 operational, 2 under construction, 5 under development, shown on an India map. Construction progress: AVRL (HAM) 78% till Q1-27 to 82% till Q2-27; KSRL (BOT) 90% to 94%. Model summary: HAM 7 operational, 1 in progress, 3 under development; BOT 5 and 1; TOT 2 operational and 1 under development; one ropeway under development.
India map with green, blue and yellow status pins on the left; right side a horizontal bar chart for construction progress and a project-count table by model; long abbreviation footnote.
Mining services: 18 contracts from 11 customers across 6 states; 8 operational incl. one iron ore mine; peak capacity of 145.4 MTPA from 19 contracts (pie: 55.0 current run-rate, 38.1 ramp-up, 52.3 under development; 41% growth available from operational contracts). Dispatch table: total operational 10.7 MMT in Q2-27 vs 10.5 (table shows (2%)) and 22.5 vs 22.6 MMT in H1; PEKB 2.7 vs 3.4, Talabira 3.8 vs 3.7, Parsa up 46%. IRM: sales volume 7.4 vs 11.3 MMT in Q2 (down 35%), 15.7 vs 24.1 in H1; handling volume 4.7 vs 4.3 MMT (up 9%). Q2-27 dispatch by owner: state power companies 40%, national mineral corp. 36%, state mineral corp. 25%.
Upper left bullet box with a pie chart; lower left a wide dispatch table; right column an IRM activity table above a donut chart.
Commercial mining: Carmichael mine in Australia, the only operational mine in this segment (peak capacity 15 MMTPA), produced 3.3 MMT in Q2-27 vs 3.2 (up 5%) and sold 3.5 vs 3.9 MMT (down 10%); H1 production 6.5 vs 6.1 MMT, sales flat at 6.2. Copper: the 500 KTPA Mundra smelter and refinery ran at about 64% of annual capacity in Q2; production 80.2 KT vs 12.9 (5.2x) and sales 80.6 vs 11.8 KT (5.8x); H1 production 145.6 vs 24.5 KT (4.9x), sales 145.3 vs 23.3 KT (5.2x).
Two-column split with navy headers: a mining truck photo and volume table on the left; copper cathode and warehouse photos with volume table on the right.
Section divider for financial highlights.
Large grey numeral '04' with section title.
Segment total income and EBITDA, H1-26 vs H1-27 (₹ crore): ANIL ecosystem income 7,233 to 7,606 (up 5%), EBITDA 2,384 to 2,066 (down 13%, low realization); airports income 5,882 to 7,549 (up 28%), EBITDA 2,157 to 3,275 (up 52%); IRM income 14,899 to 14,593 (down 2%), EBITDA 1,331 to 1,548 (up 16%); mining services income 2,247 to 2,171 (down 3%), EBITDA 1,019 to 828 (down 19%, higher fuel cost); copper income 1,961 to 25,764 (up 12x), EBITDA (320) to 2,033.
Five columns (one per segment) × two rows (Total Income, EBITDA) of mini paired bar charts with grey prior-year and blue current-year bars, each with a captioned change box; navy vertical row labels.
Q2-27 vs Q2-26 (₹ crore): Total Income 38,023 vs 21,844 (up 74%), Established 29,982 (up 119%) and Incubating 8,041 vs 8,154; EBITDA 6,316 vs 3,902 (up 62%), Established 3,217 vs 1,232 (up 161%) and Incubating 3,099 vs 2,670 (up 16%); PBT 2,002 vs 814 (prior year excluding exceptional item; up 146%), Established 1,573 vs (378) and Incubating 429 vs 1,192.
Same three-panel stacked column layout as page 2, applied to the quarter.
Quarterly segment results (₹ crore), Q2-26 vs Q2-27: ANIL income 3,199 to 3,669 (up 15%), EBITDA 1,172 to 1,094 (down 7%); airports income 3,167 to 3,786 (up 20%), EBITDA 1,062 to 1,641 (up 55%); IRM income 6,843 to 7,169 (up 5%), EBITDA 726 to 654 (down 10%, low volume); mining services income 1,088 to 998 (down 8%), EBITDA 535 to 407 (down 24%, fuel cost); copper income 1,400 to 14,843 (up 9.6x), EBITDA (151) to 1,283.
Same 5×2 small-multiple bar chart grid as page 23 for the quarter.
Section divider for debt profile.
Large grey numeral '05' with section title.
Segment debt (₹ crore) as at Mar-26 vs Sep-26: gross debt 86,702 to 97,294 (long-term 78,596 to 86,694; working capital 8,107 to 10,600); airport 29,746 to 35,009; road 17,179 to 16,949; copper 8,844 to 11,461; PVC 7,278 to 10,093; Australia project 10,244 to 10,289; new energy 3,104 to 5,334. Less shareholder's loan 10,842 to 8,203; external debt 75,860 to 89,090; cash & bank 11,809 to 16,857; net external debt 64,051 to 72,233. The rise in long-term external debt reflects capex in airports and the PVC project. Line charts FY22–H1-27: interest coverage 2.3, 3.1, 3.6, 3.4, 2.6, 2.8; debt service coverage 1.8, 2.5, 2.5, 2.6, 1.9, 2.2; net external debt/EBITDA 5.2, 2.2, 2.3, 2.9, 3.9, 3.0.
Large navy-headed debt table on the left with bold subtotal rows; three dashed-border line charts stacked on the right; callout strip under the table.
Section divider for ESG highlights.
Large grey numeral '06' with section title.
Ratings: DJSI CSA (2025) 64, top 5 in sector and 98th percentile; CDP Climate Change (2025) A; CDP Water Stewardship (2025) A; Sustainalytics 35.8 (reflecting reclassification from T&D to conglomerates); Care Edge 83.1 'Leadership'; CRISIL 60 'Adequate' (up from 51); TPI Level 3; ESG Risk Assessment & Insight 67.5 'Strong'. H1-FY27 performance vs H1-FY26: ANIL 18% renewable electricity and 100% water from non-competing sources; data center 90% renewable and 29% lower Scope 1 & 2 intensity per MWh of IT load; airports 53% renewable and 20% less waste; mining services 35% renewable and 100% ZLD across operational mines; AEL 46% water from non-competing sources and 4,54,166 trees planted.
Left: ratings table with agency logos, scores and descriptions; right: performance grid with chevron business labels and icon-led metrics.
Closing slide with the Adani logo, 'Thank You' and a colorful illustrated banner of people, a container ship, wind turbines, a mining truck and power lines.
Logo top left, centered heading, full-width illustration across the lower half.
Divider listing the supplementary FAQ slides: Capex Breakup H1-27; New Energy Ecosystem – Solar and Wind Bifurcation; Finance Cost Movement – Sequential Quarter.
Left-aligned heading with three underlined list items.
Capex incurred by business vertical (₹ crore), H1 FY27 / FY26 / FY25: new energy ecosystem 2,684 / 2,962 / 1,615; airport 4,245 / 13,059 / 10,887; road 1,737 / 6,604 / 8,617; PVC 4,319 / 7,979 / 3,895; mining services & others 3,028 / 5,296 / 6,753; total 16,013 / 35,900 / 31,767.
Single wide table with navy header and total rows; the H1 FY27 column shaded grey.
Solar manufacturing total income (₹ crore): Q1-26 3,493, Q2-26 2,719, H1-26 6,212, Q1-27 3,071, Q2-27 3,135, H1-27 6,206; EBITDA 1,129, 1,023, 2,152, 787, 1,001, 1,788. WTG manufacturing total income 542, 480, 1,022, 866, 516, 1,382; EBITDA 83, 149, 232, 185, 93, 278.
Grid table with merged vertical labels and grey-shaded half-year columns.
Gross debt and interest cost (₹ crore), Q1-27 vs Q2-27: airport 32,843/757 to 35,009/745; road 18,024/339 to 16,949/426; copper 10,542/336 to 11,461/383; corporate & others 36,213/982 to 33,875/814; gross debt 97,622/2,414 to 97,294/2,368; less shareholder's loan interest 244 to 224 and notional lease interest 398 to 394; external debt 83,982/1,772 to 89,091/1,750. Note: road finance cost rose on the full-quarter impact of the Ganga Expressway project.
Table with two-level column headers and navy-highlighted total rows; pointing-hand note below.
Divider introducing the appendix of project-level detail.
Mostly white slide with 'Appendix' in blue at lower left.
Water projects: HAM — Prayagraj Water (Uttar Pradesh, 326 MLD, COD achieved, 2+15 years), Bhagalpur Waste Water (Bihar, 45 MLD, pre-COD achieved, 2+15), Morsagar Bisalpur Water (Rajasthan, 200 MCM, under development, 2.75+20), Brahmani Barrage Water (Rajasthan, 55 MCM, under development, 2.75+20); EPC — Shakkar Pench Micro Lift Irrigation (Madhya Pradesh, 95,000 Ha, execution in progress, 6+5) and Mithi River Development Package III (Maharashtra, 18 gate pump areas, pre-engineering, 6+10).
Five-column project table with merged model cells and grey shading for operational projects.
Airport-level passengers, ATMs and cargo for Q2-26, Q2-27, H1-26 and H1-27. Mumbai 13.3 to 12.0 Mn passengers in Q2 (26.9 to 24.8 in H1); Ahmedabad 3.1 to 2.7 (6.6 to 6.3); Navi Mumbai 1.1 Mn in Q2-27 and 2.7 in H1-27; total 22.6 to 21.3 Mn in Q2 and 46.0 to 45.5 in H1. Total ATMs 148.2 to 145.7 thousand (Q2) and 301.7 to 305.1 (H1); cargo 2.9 to 3.0 and 5.7 to 6.1 lakh MT. Q2-27 figures are aligned to AAI data; September 2026 data not yet on the AAI website.
Wide 13-column data table with a navy total row and footnote.
Hybrid annuity road projects with length and status: Bilaspur Pathrapali (53.3 km), Suryapet Khammam (58.6), Mancherial Repallewada (42.0), Vijayawada Bypass (17.9), Nanasa Pidgaon (47.4), Kodad Khammam (31.8) and Badakumari Karki (47.5) operational; Azhiyur Vengalam (40.8 km) 82% complete; Munger Sultanganj (41.8), Sultanganj Sabour (41.1) and Sree Vishwa Varadhi (35.2) under development; Shri Kedarnath Ropeway (12.9 km, 6+29 years) under development.
Five-column table with grey-shaded operational rows and merged model labels.
BOT: Kagal Satara (65.1 km, 94.0%), Maharashtra Border Check Post Network (24 BCPs; 21 operating, 2 COD achieved), Panagarh Palsit (67.8 km), Budaun Hardoi (151.7), Hardoi Unnao (155.7), Unnao Prayagraj (156.8) and Indore Gujarat Road (155.2) operational. TOT: DPJ TOT (105.9 km) and PRS Tolls (49.5 km) operational; CORR Tollways (60.15 km, 0+25) under development.
Same table format as page 38.
List of mine service contracts with state, peak capacity, owner and SPV: coal contracts including PEKB (18.0 MMT, RRVUNL), Gare Pelma III (5.0, CSPGCL), Talabira II & III (23.0, NLCIL), Suliyari (6.0, APMDC), Parsa (5.0), Gare Pelma II (23.6, MAHAGENCO), Dhirauli (6.5, MEL), Kente Extension (9.0), Pelma (15.0, SECL) and smaller blocks; other contracts Srikurmam South mineral deposit (10 MMT), Kurmitar iron ore (6.0, OMC) and Taldih (7.0, SAIL).
Long five-column table with grey operational shading and merged contract-type labels; abbreviation footnote.
Domestic commercial mining contracts: Tara Coal Block (6.0 MMT, CG Syn-Gas and Chemicals Ltd, new this quarter), Gondulpura, Jharkhand (4.0), Bijahan, Odisha (5.3), Gondbahera Ujheni, Madhya Pradesh (4.1), Rampia & Dip side of Rampia, Odisha (15.0), and Jhigador and Khargaon, Chhattisgarh (capacity TBD).
Four-column table with a merged left label and white space below.
Divider introducing the ESG framework slides.
White slide with blue title at lower left.
ESG framework built on policies, guiding principles, commitments and assurance. Commitments: no-net-loss to biodiversity (IBBI/TNFD), net water positive, UNGC signatory, airport and data center businesses to reach operational net zero by 2029 and 2030, and 'zero harm'. Guiding principles: UNGC, SDG, SBTi, GRI, BRSR, DJSI, TCFD, IBBI/TNFD, CDP. Policy structure by E, S and G, plus focus areas from climate action to industry and infrastructure. Vision: to be a world-class leader in businesses that enrich lives.
Hexagon cluster around a central 'ESG' hexagon on the left; right side boxes for commitments, guiding-principle tiles, E/S/G policy rows and focus areas.
Maps social initiatives to UN SDGs: women's education (own and upgraded schools, Project Suposhan), women's health in Sarguja (sanitary pads via self-help groups), women's empowerment in Sarguja and Tamnar (non-timber forest produce), ecology at Mundra (mangrove conservation with GUIDE), local and rural infrastructure (organic farming) and water security (pond deepening, rooftop rainwater harvesting).
Left: grid of the 17 colored SDG tiles; right: rows of focus area, SDG numbers, location and initiative bullets separated by dashed lines.
Governance highlights: 50% independent and 25% women directors; Corporate Responsibility, Nomination & Remuneration and Audit Committees with 100% independent directors; CSR committee 67% independent; Risk Management Committee 50% independent with M&A, legal/regulatory/tax, commodity price and reputation risk sub-committees (67% independent); related party transaction policy; stakeholders relationship committee 75% independent; anti-bribery policy and insider trading code; statutory auditors Shah Dhandharia & Co. LLP. ESG governance chart from the board through CSR, CRC, RMC and stakeholder committees to corporate and BU ESG heads, with their roles.
Left: two-column checklist table; right: small org chart above two role boxes.
Final closing slide repeating the illustrated 'Thank You' banner after the appendix.
Same as page 30: logo top left, centered heading, full-width illustration.
Domande comuni su questa slide e il contenuto della presentazione sottostante.
It is AEL's 46-slide results deck for the quarter ended 30 September 2026. It covers consolidated Q2-27 and H1-27 results, the Adani portfolio and AEL's incubation model, operating updates for ANIL (solar and wind manufacturing), AdaniConneX data centers, airports, roads, mining services, IRM, commercial mining and copper, plus debt, capex, ESG and governance.
For H1-27 the deck reports total income of ₹71,569 crore (up 62%), EBITDA of ₹11,958 crore (up 56%, the highest half-year EBITDA it has reported) and PBT excluding exceptional items of ₹3,297 crore (up 45%). For Q2-27 alone, total income was ₹38,023 crore (up 74%) and EBITDA ₹6,316 crore (up 62%).
Indian companies use an April–March fiscal year, so FY27 runs from April 2026 to March 2027. Q2 FY27 is July–September 2026 and H1-27 is April–September 2026. Amounts are in Indian rupees, mostly ₹ crore (1 crore = 10 million), and the page-by-page notes keep the deck's own units.
Adani Enterprises filed it with BSE and NSE on 28 October 2026 as part of its quarterly results disclosure. It is an English-language deck; the cover letter that came with the exchange filing has been removed from this copy.
Mostly the copper smelter at Mundra, whose H1 income rose from ₹1,961 crore to ₹25,764 crore as utilization reached about 64%, and airports, where EBITDA rose 52% to ₹3,275 crore on 55% growth in non-aero revenue. Mining services EBITDA fell 19% on higher fuel costs, and ANIL EBITDA fell 13% on lower realization.
As at September 2026, gross debt was ₹97,294 crore, external debt ₹89,090 crore and net external debt ₹72,233 crore, up from ₹64,051 crore in March 2026. The deck attributes the increase to capex in airports and the PVC project. Net external debt/EBITDA was 3.0x for H1-27, versus 3.9x in FY26.
Yes. The page offers the original PDF and a PPTX converted from it. The PPTX lets you reuse the stacked-column 'Results at glance' panels, segment small-multiple charts, debt tables and section dividers as a starting point for your own earnings presentation. Converted files may need some layout clean-up.
It uses a clean white background with navy and mid-blue accents, the gradient Adani wordmark, oversized grey numerals on section dividers, ₹ crore unit tags on financial slides, and consistent navy title bars. Charts include stacked columns, waterfall, pie and donut charts, small-multiple bar pairs and line charts, along with dense project tables and India footprint maps.
Original exchange filing of the presentation, dated 28 October 2026, including the cover letter.

Create Your Own Slides
Turn your ideas into professional presentations in seconds with 2slides AI.
Fai riferimento a design professionali, scegli il tuo stile e genera slide con rendering del testo perfetto. Alimentato da Nano Banana—inizia a creare la tua presentazione ora.
Il Tuo Agente IA per le slide. Risparmia tempo, brilla più velocemente con la creazione intelligente di presentazioni.


© 2026 2slides. Tutti i diritti riservati.