
Part of Investor presentation examples
Lufthansa Group Investor Presentation December 2025
Quick Navigation
Tags
Share the slides
Lufthansa Group Investor Presentation December 2025
Detailed view of each slide page, including layout, key content and visual elements.
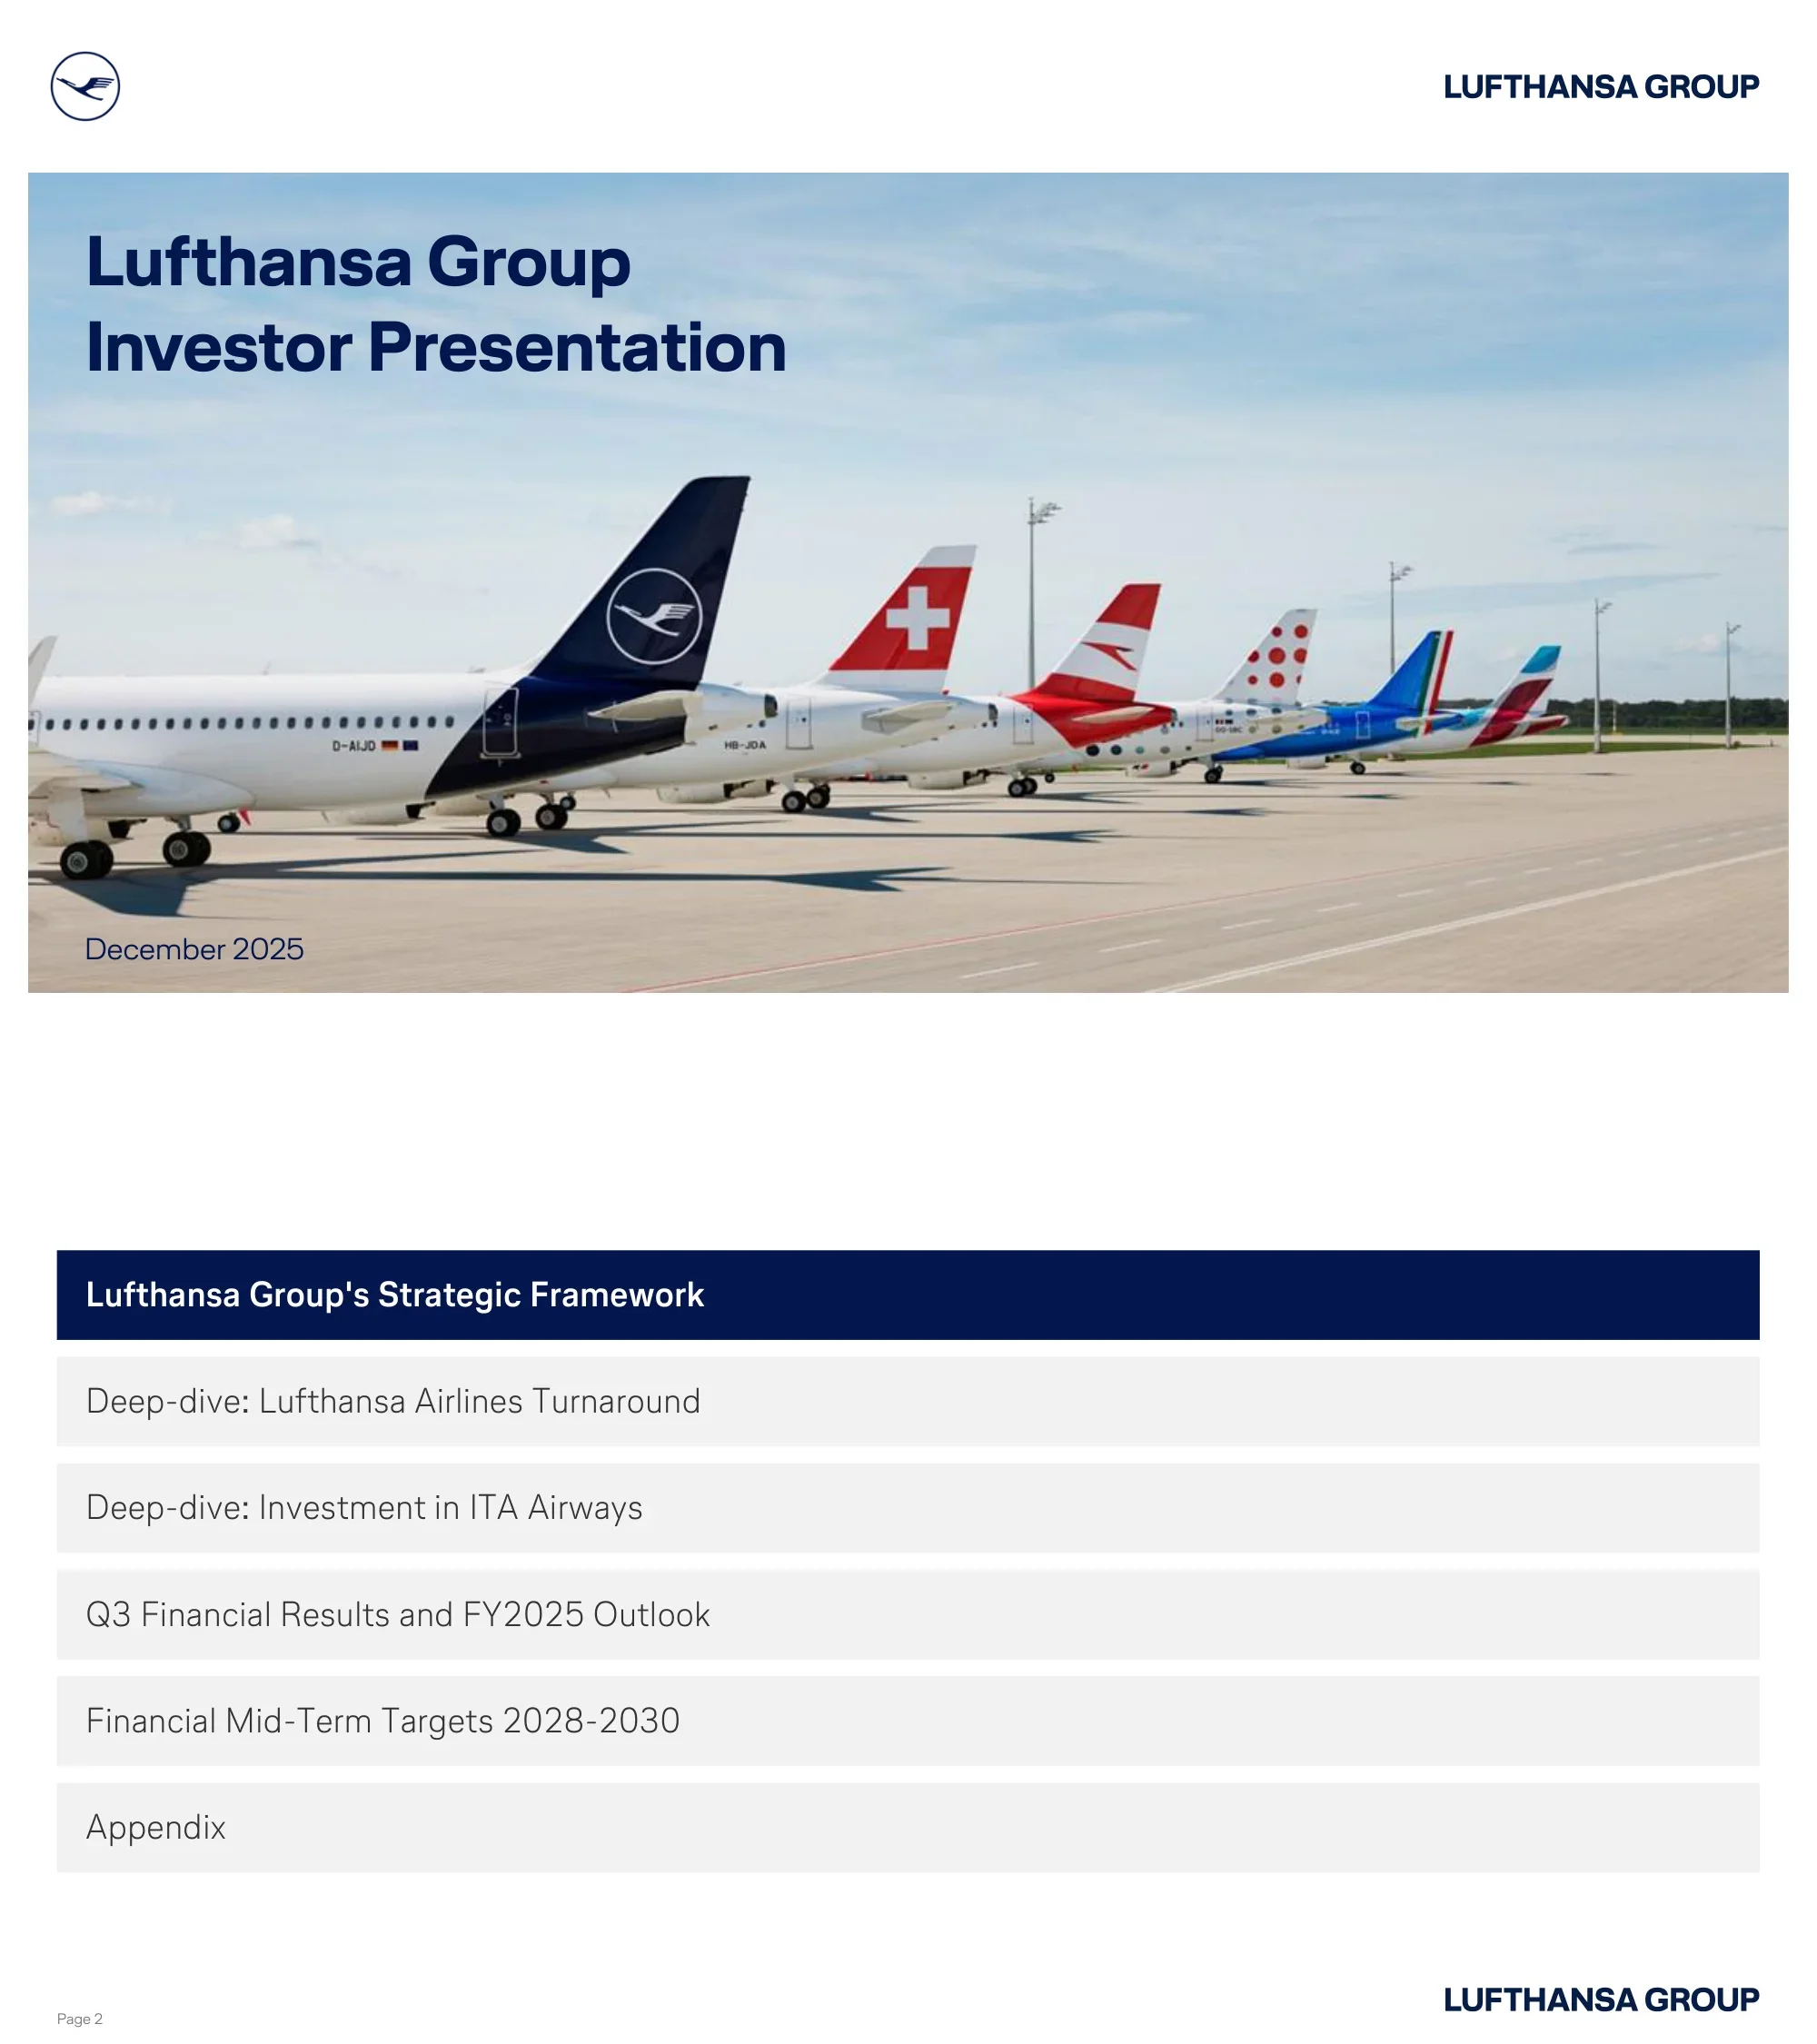
Title slide featuring the Lufthansa Group logo, full presentation title, and December 2025 date, set against a striking photo of multiple Lufthansa Group airline tailfins on a tarmac (Lufthansa, SWISS, Austrian, Brussels Airlines, Eurowings, ITA Airways).
Full-bleed photo background with text overlay in top-left; branding in top-right corner
Five-section agenda: Lufthansa Group's Strategic Framework, Deep-dive: Lufthansa Airlines Turnaround, Deep-dive: Investment in ITA Airways, Q3 Financial Results and FY2025 Outlook, Financial Mid-Term Targets 2028-2030, and Appendix.
Vertical stacked list of section titles with the first item highlighted in dark navy; clean white background
Key metrics tile grid: €38bn group revenue 2024, 131m passengers, 730+ aircraft (230 on order + 100 via ITA), 100,000+ employees from 160 countries, #1 airline brand in all home markets, +70% customer satisfaction, MRO €7.4bn revenue, Logistics €3bn+ revenue, 99% regularity and +10p punctuality in Q3 2025.
3×3 KPI tile grid with alternating dark navy and light grey tiles; bold metric numbers with descriptive subtitles
Depicts value creation through four strategic pillars: Hub Airlines (€27bn revenue 2024, execute transformation), P2P Airline/Eurowings (€3bn, leisure expansion), Logistics/Cargo (€3bn, Global Top 3), and MRO/Technik (€7bn, Ambition 2030). Overarching 'One Group' integrated operating model bridges Customers and Shareholders.
Arch diagram at top spanning from Customers to Shareholders; four color-coded pillar boxes below; Employees banner at bottom
Addresses industry-wide labor challenges (ageing workforce: >50% retiring in 10 years; shortage of 1.4m professionals needed by 2034) vs. Lufthansa Group's resilient people base: 100k+ employees from 160 countries, 6% turnover (below industry), 3.8 engagement index (above industry 3.6), 350k+ job applications received in 2024.
Two-column split: left column lists challenges with icons; right column shows 'Resilient backbone' stats with a team photo
Lufthansa Technik business description: leading MRO provider, covers all segments nose to tail, long-term service contracts, symbiotic with group, $150bn growing market. MRO specialists ranking: #1 Lufthansa Technik, #2 MTU, #3 StandardAero. Adj. EBIT growth: €463m (7% margin, 2019) → €607m (8.5%, 2024) → >€1,000m (>10%, 2030).
Left column: business description bullets in bordered box; Right column: ranking table + bar chart showing EBIT trajectory
Lufthansa Cargo: worldwide transportation using belly space and 22 dedicated freighters, connects >350 global destinations from 5 hubs, growing in specials/express (>40% in 2024). Ranking improved from #8 (2020) to #4 (today). Adj. EBIT: €1m (2019) → €251m (7.7% margin, 2024).
Left column: business description bullets; Right: Cargo ranking timeline (arrow chart) + EBIT bar chart
Eurowings: leading P2P value airline, market leader in 4 German catchments outside hubs, 13 European bases with >120 A/C, 60% leisure segment, Eurowings Holidays tour operator. Market share positions: Stuttgart ~40%, Cologne >35%, Düsseldorf >35%, Hamburg ~30%. Adj. EBIT margin improved from -5.3% (2019) to 7.1% (2024).
Left column: business description bullets in bordered box; Right: market share position tiles + EBIT margin bar chart
Three parallel transformation tracks: (1) Lufthansa Airlines Turnaround (ops & commercial excellence, structural cost reduction) — Target: €2.5bn EBIT uplift by 2028; (2) Other Airline Efficiency Programs (commercial excellence + cost reduction); (3) Fleet Modernization (fuel savings + lower MRO costs for additional margin uplift).
Three equal-width columns, each with a photo banner, logo/icon, descriptive text, and target metric
Dual strategy: 'One Group' (leveraging group power — scale through group-led processes) and 'Local champions' (tailored product & delivery — perfect fit to local markets). Together they create the 'Largest Integrated European Airline Group'.
Two-column layout with full-bleed photos at top; text description boxes below each; emphasis banner at bottom
Horizontal maturity spectrum from Local → Aligned → Unified → Group. Lufthansa Group is moving from 'Today' (Unified) toward 'Future' (Group). Examples: Airline ops delivery (Local), IT architecture (Aligned), Digital customer experience (Unified), Fleet management (Group).
Horizontal arrow timeline with four maturity stages; examples listed below each stage; LHG position markers on the arrow
Widebody fleet: 13 passenger A/C types today → 6-9 by 2030 (retiring A340-600, A330-200, 767-300, 747-400, A340-300 by 2026-27, 777-200 by 2028). Fleet grows from 782 (operative, 2025) to 814 by 2030. Next Gen A/C share rises from 27% to 58%; Widebody share from 25% to 28%.
Left: aircraft type consolidation chart with X marks for retirements; Right: three metric tiles showing fleet stats
Four benefit categories from Next Gen fleet: Fuel & sustainability (up to -30% fuel consumption), MRO (on average -20-30% MRO costs), Crew (up to +3% crew productivity), Cargo (+100% cargo belly revenue). Bottom line: up to 15%p contribution margin increase on first routes; on average €10m EBIT uplift per new widebody A/C.
Four equal columns with photo banners and downward arrow impact metrics; bottom summary bar with key headline figures
CO2 emissions targets: -30.6% gCO2/RTK by 2030 vs. 2019; -50% net CO2 by 2030; CO2-neutral by 2050. Four sustainability initiatives: Fleet (230 new A/C, reduced CO2 & fuel cost €1.4bn p.a.), Ops (4.5% fuel saving by 2030, AeroSHARK riblet film), SAF (first to offer SAF in regular ops), Partnerships (Synhelion solar fuels).
Left: emissions target box with three bold reduction figures; Right: four initiative rows with photos and descriptions
Three hubs offer Allegris / SWISS Senses. New premium product share at Lufthansa & SWISS grows from 12% (2025) → 33% (2026) → 68% (2027) → 85% (2028) → 94% (2029) → 100% (2030). Premium Economy grows ~50% in seats between 2019 and 2030. First Class rightsized, Business Class individualized.
Left: four product tier list with icons; Right: area/timeline chart showing new vs. current product share by year, with cabin interior photos
Key customer metrics: ~5% more avg. spend per transaction in digital channels YoY; 70% of servicing requests via digital channels; 800k peak daily users on Lufthansa app (4.6 stars on App Store); >50% of customers fly with more than one LHG airline per trip; 161% increase in Miles & More monthly enrollment 2024 vs. 2021.
Six-tile mosaic grid with mix of metric tiles and photos; bold numbers with descriptive context
Miles & More has 45m+ members. Four pillars: Loyalty Program (miles & status, driving loyalty across group), Payment (co-branded credit card with Deutsche Bank), Retail (extensive earn & redeem across retail partners), Partnerships (hotels, retailers, partner airlines).
2×2 mosaic grid with each quadrant featuring a photo and bold program pillar title plus description
Agenda navigation slide highlighting the current active section: 'Deep-dive: Lufthansa Airlines Turnaround'.
Vertical stacked agenda list; active section highlighted in dark navy; inactive sections in light grey
LHA Turnaround Program gross Adj. EBIT effect: ~35% revenue impact, ~65% cost reduction. Waterfall shows individual measures: Premium customer offer, Retail & Ancillary Revenue, Improved Operational Stability, Increased Productivity, Ground Efficiency & Automation, Cost Excellence Admin. Total: EUR 1.5bn by 2026; gross impact of 2.5bn€ by 2028.
Left: two stacked percentage boxes (revenue/cost split); Center: horizontal waterfall/staircase bar chart; Right: dashed target box
Agenda navigation slide highlighting the current active section: 'Deep-dive: Investment in ITA Airways'.
Vertical stacked agenda list; active section highlighted in dark navy; inactive sections in light grey
Three-pillar rationale for ITA investment: LHG (attractive investment case, broader access to Italian market), ITA (newly established company with cost-efficient resources), Italy (most important LHG market outside home markets and US), Rome FCO (one of Europe's best hubs for quality, cost, and capacity growth).
2×2 mosaic grid with alternating dark navy and light tiles; each tile has bold pillar header and brief description; lifestyle/destination photos
Map of Europe showing LHG hub network populations in 60-min range (Frankfurt 7m, Munich 3m, Zurich 3m, Vienna 3m, Brussels 5m, Rome 4m, etc.). Five strategic rationales: Customer centricity (ITA strong local brand), Internationalization (cultural enrichment), Growth potential (new home market, network expansion), Operative stability through redundancies, Geographic flexibility (Rome as scalable 5* hub).
Left: circular Europe map with hub population circles; Right: five strategic rationale bullets with icons and bold headers
Three-phase synergy roadmap: Step 1 (minority shareholding, 2025): 20-30% of synergies — network/hub optimization, commercial harmonization, lounges & Miles & More, cargo efficiencies. Step 2 (2026-27): 70-80% — Star Alliance, lease & MRO optimization, IT harmonization. After full consolidation: 100% synergies (10-15% of 2024 ITA rev.) — central A/C ownership, technical MRO, financing. Call options available until 2033.
Layered horizontal timeline with three synergy phases; each phase shows percentage captured and specific work streams as labeled boxes
Agenda navigation slide highlighting the current active section: 'Q3 Financial Results and FY2025 Outlook'.
Vertical stacked agenda list; active section highlighted in dark navy; inactive sections in light grey
Full-year 2024 vs. 2023 P&L table: Revenues €37,581m (+6%), Operating expenses €39,097m (+9%), Adj. EBIT €1,645m (-39%), Adj. EBIT margin 4.4% (-3.2%p), EBIT €1,731m, Net income €1,380m (-18%), Adj. Free Cashflow €840m (-55%). Cost pressures from material costs (+10%), staff (+8%).
Full-width financial table with dark navy header row; metric rows alternating between bold highlights and standard text; percentage change column
Q3 2025 vs. Q3 2024: Revenues €11,199m (+4%), Adj. EBIT €1,331m (-1%), Adj. EBIT margin 11.9% (-0.6%p), Net income €966m (-12%). Key highlights: material cost ex fuel +11% (circled), fuel cost -8% (circled), Adj. Free Cashflow €818m vs. €128m (+539%, circled).
Financial P&L table with highlighted circle callouts on key year-over-year changes; tab navigation for Recap FY2024 / Details Q3 2025
Passenger Airlines KPIs: ASK 96,366m (+3.2%), SLF 87.5% (+0.4%p), Yield 8.9€c (-5.4%, short-haul -5.9%, long-haul -5.1%), RASK 9.4€c (-2.2%), CASK 6.1€c (+0.5%). Adj. EBIT €1,158m (12.9%) vs. €1,162m (13.1%) in Q3'24, change -4. ITA contribution: +€35m Adj. EBIT.
Three-column layout: left KPI table, center bar chart comparison, right commentary bullets
YTD Adjusted EBIT/FCF waterfall: Adj. EBIT €1,480m (vs. '24: €1,177m) + D&A €1,884m + Trade Working Capital €808m − Other operating cashflow €233m = Operating cashflow €3,939m (vs. '24: €3,303m) − Net CAPEX €1,811m − IFRS 16 lease repayments €286m = Adj. Free Cashflow €1,842m (vs. '24: €1,006m).
Horizontal waterfall bar chart with positive (navy) and negative (grey) bridge elements; prior year comparison bubbles above start/end bars
Liquidity: €11.9bn (Sep 2025) vs. €11.0bn (Dec 2024), target €8-10bn. Net debt €5.1bn + pension €2.1bn = €7.2bn total net debt/pension. Net debt/EBITDA: 1.6x (Sep 2025) vs. 2.0x (Dec 2024). BBB-/Baa3 stable outlook. €600m convertible bond issued in September at 0% coupon.
Three sections: left liquidity bar chart, center net debt stacked bar chart, right commentary bullets
FY2025 guidance: ASK +~4% vs. 2024, Adj. EBIT to significantly increase vs. 2024, Net CAPEX €2.7-3.3bn, Adj. FCF stable vs. 2024, dividend payout 20-40% of net income. Q4 2025: capacity ~+4% YoY, RASK flat, CASK increase <+2.5% YTD, LH Technik Adj. EBIT stable. 2026: capacity +4%, twice as many long-haul deliveries, LHA Turnaround €1.5bn gross earnings impact.
Top: five KPI guidance tiles in dark navy; Bottom-left: Q4 2025 detail table; Bottom-right: 2026 outlook bullet list
Agenda navigation slide highlighting the current active section: 'Financial Mid-Term Targets 2028-2030'.
Vertical stacked agenda list; active section highlighted in dark navy; inactive sections in light grey
2028-2030 financial targets: 8-10% Adj. EBIT margin, 15-20% Adj. ROCE, >€2.5bn Adj. FCF p.a. Financial framework: Solid Investment Grade, €8-10bn liquidity, dividend 20-40% of net income. Six strategic levers: sustainable & profitable growth, maximizing group synergies, transforming airlines, Global Top 3 air cargo, MRO Ambition 2030, best team in industry.
Left: six strategic lever icons with labels; Center/Right: two stacked target boxes (financial targets + financial framework); 'Strong total shareholder return' label
Waterfall from current Adj. EBIT margin 4% (2024) to target 8-10% (2028-2030): Airline growth (+small), Leveraging One Group (~3%p, Fleet & New Premium), LHA Airline cost transformation (turnaround logo), MRO & Cargo (+moderate), Headwinds (negative). Key: LHA expected to reach high single digit EBIT margin; known headwinds from cost inflation and regulatory costs fully reflected.
Horizontal waterfall/bridge bar chart with positive navy bars and negative grey bars; final target range shaded
Historical dividend per share and distributed amount (€m): 2015 €0.50 (€232m), 2016 €0.50 (€234m), 2017 €0.80 (€377m), 2018 €0.80 (€380m), 2023 €0.30 (€359m), 2024 €0.30 (€359m). Payout ratio 20-40% of Net Income; upward arrow indicating intention to grow dividends.
Bar chart showing historical distributed amounts with DPS labels above each bar; upward arrow with payout ratio in upper right
Five key investment thesis points: (1) Favorable market environment (resilient demand, supply constraints, European consolidation), (2) Diversified growth engines & premium positioning, (3) One Group — integrated scalable operating model, (4) Transformation underway — first tangible proof points, (5) Target: outperforming tomorrow — disciplined financial management for attractive shareholder returns.
Left: full-height aircraft photo; Right: five numbered investment thesis bullets with bold headers
Appendix supplementary information section divider.
Centered title and subtitle on white background; standard footer branding
Total Lufthansa Group Airlines Q3 traffic data: Passengers 41,701k (+3.4%), ASK 96,366m (+3.2%), RSK 84,349m (+3.7%), Passenger load factor 87.5% (+0.4%p), Cargo load factor 56.5% (+1.1%p), 293,156 flights (+2.6%). Monthly breakdown (July/August/September) vs. 2024 for each KPI.
Full-width data table with dark navy header; monthly columns plus Q3 total; alternating row styling
Cargo Q3 highlights: Adj. EBIT €49m (6.0% margin) vs. €38m (4.9%) in Q3'24 (+11). Volume growth +11%, revenue €824m (+5%), SWISS World Cargo joins JV with Lufthansa Cargo and United (200 destinations), improved load factor 60.4% (+1.9%p). New e-booking platform for general goods. Unit costs -6% excl. fuel.
Four-tile layout: left EBIT bar chart + e-booking text; center two stat tiles; right SWISS JV info tile + load factor tile
Technik Q3: Revenue €1,942m (+€171m vs. €1,771m in Q3'24, +10%); Adj. EBIT €130m (6.7%) vs. €161m (9.1%) in Q3'24, -31. Key contracts: Cathay Group 747/777 total component maintenance (6 years), easyJet base maintenance extended 7 years. EBIT decline due to weaker USD and tariff impacts + ramp-up costs for production expansion.
Left: two financial bar charts (revenue and EBIT); Right: three labeled commentary sections with bullet points and maintenance photos
LHG fuel price exposure: hedge ratio 90% for Q4 and FY2025. Jet fuel after hedge: $842/ton (Q4), $824/ton (FY). Total expected fuel expense: €7.27bn (Q4: €1.74bn). Fuel sensitivity matrix shows all-in mixed JET rate scenarios vs. crude oil price and jet crack spread combinations.
Left: hedging data table with Q4/FY2025 columns; Right: color-coded fuel sensitivity matrix (green=low cost, grey=high cost)
Detailed Lufthansa Group P&L: Revenues €11,199m, Operating expenses €10,504m (fees & charges €1,547m, fuel €2,003m, staff €2,349m, depreciation €595m), Adj. EBIT €1,331m (11.9%), EBIT €1,343m, Net income €966m. Equity investments result €154m. Income taxes -€361m.
Full-width detailed financial table; dark navy header; alternating bold/standard rows; Q3'25 and Q3'24 comparison columns
Nine-year historical financials table (2016-2024): Operating KPIs (RASK ex currency, CASK ex fuel), Profit & Loss (revenues, fuel cost, Adj. EBIT, margin), Balance Sheet (total assets, net debt+pension, Adj. ROCE), Cash Flow (operating CF, CAPEX, free CF). Highlights: 2020 COVID impact (-40% EBIT margin), recovery to 7.6% in 2023, 4.4% in 2024.
Multi-column financial table spanning 9 years; grouped by category (KPIs, P&L, Balance Sheet, Cash Flow); footnote disclosures at bottom
Stacked bar chart showing borrowings maturity by year (2025-2033): Straight Bond, Hybrid, Convertible Bond, Schuldscheindarlehen, Aircraft Finance (secured), Other. Largest maturities: 2026 (~€2.2bn), 2028 (~€1.75bn), 2030 (~€2.1bn). Note: does not include operating lease payments.
Stacked bar chart with color-coded debt instrument categories; legend at bottom; annual maturity bars from 2025 to 2033
Legal disclaimer covering distribution restrictions, no-reliance on presentation for investment decisions, no representation or warranty by company or group, forward-looking statements disclaimer, and jurisdiction-specific limitations (US Securities Act, FSMA).
White background with 'Disclaimer' header and dense legal text paragraphs; standard footer
Extended legal disclaimer covering non-GAAP measures, no-prospectus statement, qualified investors restriction (EU Prospectus Regulation 2017/1129), recipient acknowledgments, and confidentiality obligations.
White background with continuation of legal disclaimer text; standard footer
Common questions about this slide and the underlying presentation content.
This 45-page template includes a structured investor presentation covering strategic framework, business unit deep-dives (Airlines, MRO, Cargo, Eurowings), ITA Airways investment rationale, Q3 2025 financial results, FY2025 guidance, mid-term targets for 2028-2030, and a full appendix with traffic data, P&L, multi-year financials, and debt maturity profile.
This template is ideal for CFOs, IR teams, corporate strategists, equity analysts, and MBA students who need a best-practice reference for airline or transportation sector investor communications, earnings presentations, capital markets day decks, or strategic roadshow materials.
The presentation uses a professional corporate design with a dark navy (#003366) and white color scheme, consistent with Lufthansa Group's brand identity. It features bold sans-serif typography, clear data visualization through waterfall charts, bar charts, and KPI tile grids, and a mix of full-bleed photography and clean diagram layouts.
The deck includes waterfall/bridge charts (EBIT margin build, cashflow), stacked bar charts (debt maturity, fleet metrics), KPI tile grids, horizontal maturity spectrum diagrams, area charts (premium product rollout), financial P&L tables, traffic data tables, fuel sensitivity matrices, and synergy timeline roadmaps.
Yes. The slide structure, layout patterns, and data visualization approaches are fully adaptable. The strategic framework (four pillars, One Group), turnaround program waterfall, synergy timeline, and mid-term target slides work well for any multi-division company presenting to investors or boards.
The presentation includes full-year 2024 financials (€37.6bn revenue, 4.4% Adj. EBIT margin), Q3 2025 results (€11.2bn revenue, 11.9% margin), a multi-year historical P&L from 2016-2024, balance sheet data, cashflow analysis, fuel hedging tables, and 2028-2030 targets (8-10% Adj. EBIT margin, >€2.5bn Adj. FCF p.a.).
Yes, slide 14 covers the full sustainability program including SBTi targets (-30.6% gCO2/RTK by 2030, -50% net CO2, CO2-neutral by 2050), fleet modernization as the key lever, operational fuel savings, SAF (Sustainable Aviation Fuel) adoption, and the Synhelion solar fuel partnership.
Yes, three dedicated slides cover the ITA Airways investment: the strategic rationale (Italy as LHG's most important market outside home markets, Rome FCO as a 5-star hub), how ITA extends LHG's multi-hub strategy, and a detailed synergy capture timeline showing 20-30% synergies by end of 2025, 70-80% by 2026-27, and 100% after full consolidation.

Create Your Own Slides
Turn your ideas into professional presentations in seconds with 2slides AI.
Reference professional designs, choose your style, and generate slides with perfect text rendering. Powered by Nano Banana—start creating your presentation now.
Your AI Agent for slides. Save time, shine faster with intelligent presentation creation.




© 2026 2slides. All rights reserved.