
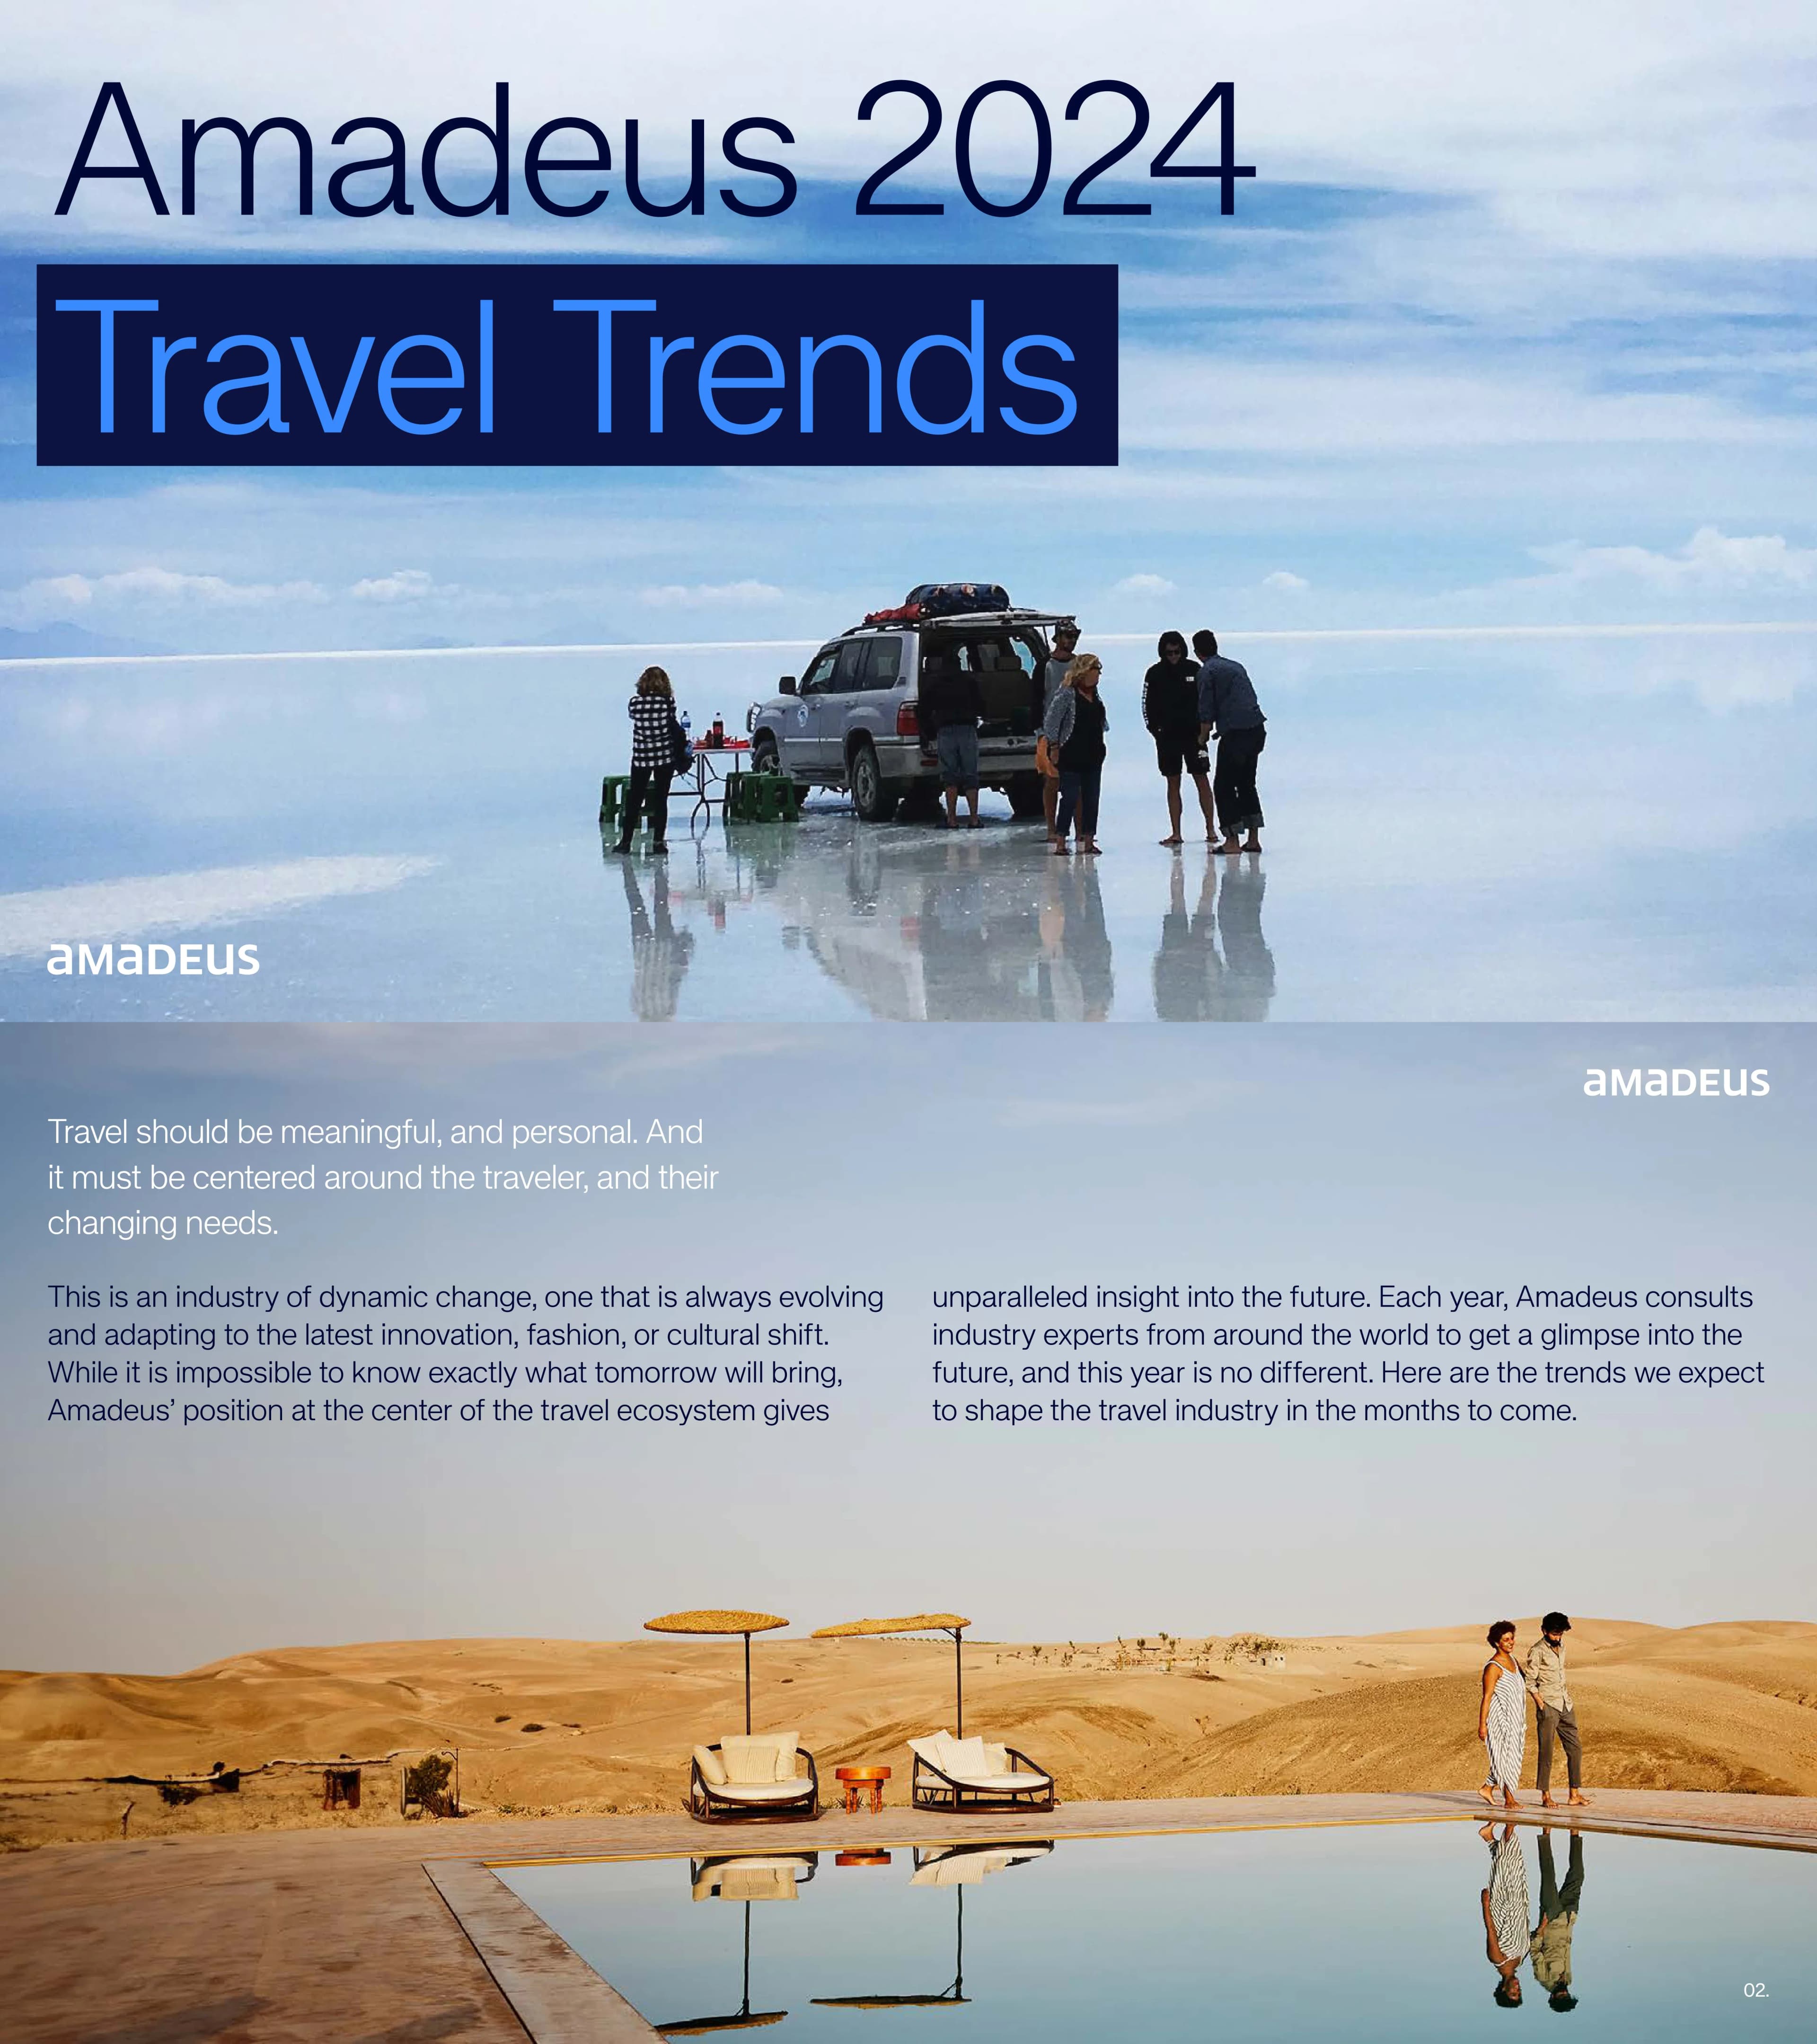
Amadeus 2024 Travel Trends — a five-trend industry outlook report exploring how Music Tourism, Agents of Influence, Electric Skyways, Intelligent Concierge (Generative AI), and Business Luxe-lite are reshaping the global travel and tourism landscape, backed by proprietary Amadeus flight search and booking data.
Quick Navigation
Tags
Share the slides
Amadeus 2024 Travel Trends — a five-trend industry outlook report exploring how Music Tourism, Agents of Influence, Electric Skyways, Intelligent Concierge (Generative AI), and Business Luxe-lite are reshaping the global travel and tourism landscape, backed by proprietary Amadeus flight search and booking data.
Detailed view of each slide page, including layout, key content and visual elements.
Title cover introducing the Amadeus 2024 Travel Trends report over a full-bleed image of travelers on the Uyuni salt flats.
Full-bleed photo background with large two-line headline top-left, accent color block behind the second line, brand wordmark bottom-left.
Framing statement that travel must be personal and traveler-centered, introducing Amadeus' position at the center of the travel ecosystem and its annual expert consultation.
Full-bleed desert pool photo with light-tinted top area holding a lead-in headline and two columns of body copy.
Section divider announcing Trend 01, Music Tourism, with a concertgoer crowd image.
Full-bleed festival photo with 'TREND 01' label lower-left and large display title overlaid right of center, with thin curved line graphics.
Explains the post-pandemic surge in concerts and festivals driving cross-border travel; highlights Coachella 2023 with 500,000 attendees, $1.5B local economic contribution, and 2024 GA passes from $499.
Deep purple background, two columns of intro text up top, three highlighted stat cards across the bottom.
Shows music tourism's economic scale: 80,000 fans at Beyoncé's Stockholm shows ('Beyflation'), 1.1M people visiting the UK for concerts in 2022, and £6.6B collectively spent (up from £4.7B in 2019).
Split layout: purple text panel on left with oversized '80,000' stat and two stat cards, full-height concert crowd photo on right.
Amadeus data on Coldplay's 2024 tour: flight searches up 62% (Athens) and 91% (Romania); bookings up 80% (Athens, July 2024) and 436% (Romania), with narrative detail per country.
Split layout: left purple panel with intro text and four stacked stat callouts, right white panel with Athens and Romania narrative blocks.
Highlights Taylor Swift's 2024 touring: 146 stadium shows completed and US $1.4B in ticket sales generated, with Amadeus correlation between concert dates and booking spikes.
Split layout: left purple panel with 'Completed' and 'Generated' stat cards plus body copy, right full-height golden concert photo.
Booking and search growth tied to concerts: Australia +446% week-over-week (450,000 expected to attend), Singapore searches +25%, Japan domestic searches +15% and international +10%, Tokyo searches +32.37%.
Light lavender background; left column narrative text and a large 32.37% stat, right column three grouped stat-card clusters by country.
Section divider for Trend 02, Agents of Influence, with a group of friends taking a selfie on bikes.
Full-bleed lifestyle photo with 'TREND 02' label lower-left and large display title overlaid right, curved line motif.
Describes influencers shifting from inspiration sources to travel providers who design and host their own group trips; lists examples like Ana Hernández Sárria, Sjana Elise, Alyssa Ramos, The Blonde Abroad, Rafael Fernández Caballero.
Split layout: left green panel with multi-paragraph text and a row of name tags, right full-height boat/ocean photo.
Covers e-commerce marketplaces (Thatch, Luxury Travel Hackers, TrovaTrip — 236 of 5,000 fastest-growing US companies 2023), Gen Z using TikTok as a search engine, and Hopper data linking trending destinations to booking spikes (#amsterdam 6.9B views → +85% searches).
Dark green two-column layout; left column with big '236 out of 5,000' stat and name tags, right column with text and a simple line-chart of TikTok views vs searches.
Section divider for Trend 03, Electric Skyways, with a silhouetted eVTOL aircraft against a sunset.
Full-bleed sunset/eVTOL photo with 'TREND 03' label left and large display title overlaid right, curved line motif.
Introduces Electric Skyways (flying taxis, eVTOL, vertiports) for lower-emission travel and profiles companies: Volocopter (Germany), Ecotricity (UK), Toff Mobility (South Korea), Zeroavia/Surcar (Canary Islands), Joby Aviation (US), Virgin Atlantic (UK).
Dark magenta background; left two columns of narrative text, right a 2x3 grid of company cards with country labels.
Section divider for Trend 04, Intelligent Concierge, with commuters waiting at a subway platform.
Full-bleed transit photo with 'TREND 04' label left and large display title overlaid right, curved line motif.
Charts ChatGPT's explosive growth: 1.6B site visits in June 2023 and 100M active users by January 2023 — the fastest-growing consumer app in history — and the emergence of GAI for conversational trip planning.
Split layout: left gold panel with two oversized stats ('1.6 billion', '100 million') and supporting text, right full-height photo of a woman at a laptop.
Explains how GAI adds value to trip planning and customer service, the continued role of human agents, and examples: chatbot briefs replacing filters (Example A) and Expedia's ChatGPT plug-in virtual assistant (Example B).
Solid gold background; large lead headline, two columns of body copy on the left, two labeled examples (A and B) on the right.
Notes that TripAdvisor, Trip.com, GetYourGuide, Klook, Kayak, and OpenTable have announced ChatGPT plug-ins, GAI responding to reviews, and Airbnb's Brian Chesky predicting AI will radically change service in 2024.
Full-bleed dusk airplane-boarding photo with two text blocks overlaid in the upper region (left narrative, right highlighted pull-quote).
Section divider for Trend 05, Business Luxe-lite, with a parent and baby in a premium cabin seat.
Full-bleed business-cabin photo with 'TREND 05' label left and large display title overlaid right, curved line motif.
Describes the changing business-class flier (Gen Z entrepreneurs, digital nomads, Boomer VPs) and growing demand for lifestyle optimization, framing the opportunity for unbundled fares and enhanced premium products.
Full-bleed sunset wing photo; left side stacked headlines and body copy, two highlighted opportunity cards lower-right.
States 75% of airline profits come from business class and that US airlines are shifting from 25% to 75% more premium-economy, business, and first-class seating per The New York Times.
Split layout: left deep-red panel with '75%' and '25% to 75%' hero stats and body copy, right full-height business-cabin photo.
Compares budget business fares (Emirates, Qatar 'Business Class Lite', Zipair, Finnair, Air France/KLM) against ultra-premium 'Luxe' seats (Virgin Atlantic Upper Class Retreat, Condor Prime, Air France, JetBlue Mint Studio), noting 75% vs 200% miles flown.
Split layout: left red panel with two narrative columns and a '75% vs 200%' hero stat, right full-height ocean sunset photo.
Summarizes the spectrum with airline cards grouped by category: scaled-down (Emirates, Qatar Airways), more luxurious Luxe seats (Air France, Virgin Atlantic), and customized options (Air New Zealand, Lufthansa Allegris).
Full-bleed premium cabin sleep photo with three category labels and a row of six airline cards along the bottom.
Closing methodology slide explaining the data sources: Amadeus data science teams, a custom search dataset, Amadeus Master Pricer, and Amadeus Agency Insights drawn from 2,500+ customers.
Solid navy background with title top-left, an italic 'Origin of Data' methodology paragraph lower-left, and the Amadeus wordmark bottom-right.
Common questions about this slide and the underlying presentation content.
It is a 23-slide industry outlook report covering five major travel trends for 2024 — Music Tourism, Agents of Influence, Electric Skyways, Intelligent Concierge (Generative AI), and Business Luxe-lite — each supported by proprietary Amadeus flight search and booking data.
It's ideal for travel and hospitality marketers, airlines, OTAs, travel-tech firms, corporate strategy teams, consultants, and content designers who need to present data-driven trend reports or annual industry outlooks with a polished, editorial look.
A premium editorial style: each trend has its own bold color world (navy, purple, green, gold, magenta, red), full-bleed lifestyle photography on divider slides, oversized hero statistics, and clean two-column body text with a strong sans-serif display typeface.
Yes. The repeatable structure — a cinematic divider slide followed by data-and-narrative spreads — works for any sector's trend report, market research, or outlook deck. Just swap the photography, color accents, and statistics for your own content.
Statistics are treated as the visual centerpiece rather than buried in bullet lists — large percentage and number callouts (like '500,000', '80,000', '1.6 billion', '75% vs 200%') anchor each data slide, making key figures instantly memorable.
There are 23 slides organized into a cover, an introduction, five trend chapters (each with a divider plus 1–4 content slides), and a closing data-methodology page.
Absolutely. The high-impact full-bleed imagery, bold typography, and single-focus stat slides project well on large screens and keep an audience engaged during keynote-style storytelling.
Yes — you can generate a comparable data-driven trend report with 2Slides by providing your content or a source document, then choose a theme and let the AI build structured, on-brand slides you can download and edit.

Create Your Own Slides
Turn your ideas into professional presentations in seconds with 2slides AI.
Reference professional designs, choose your style, and generate slides with perfect text rendering. Powered by Nano Banana—start creating your presentation now.
Your AI Agent for slides. Save time, shine faster with intelligent presentation creation.




© 2026 2slides. All rights reserved.