
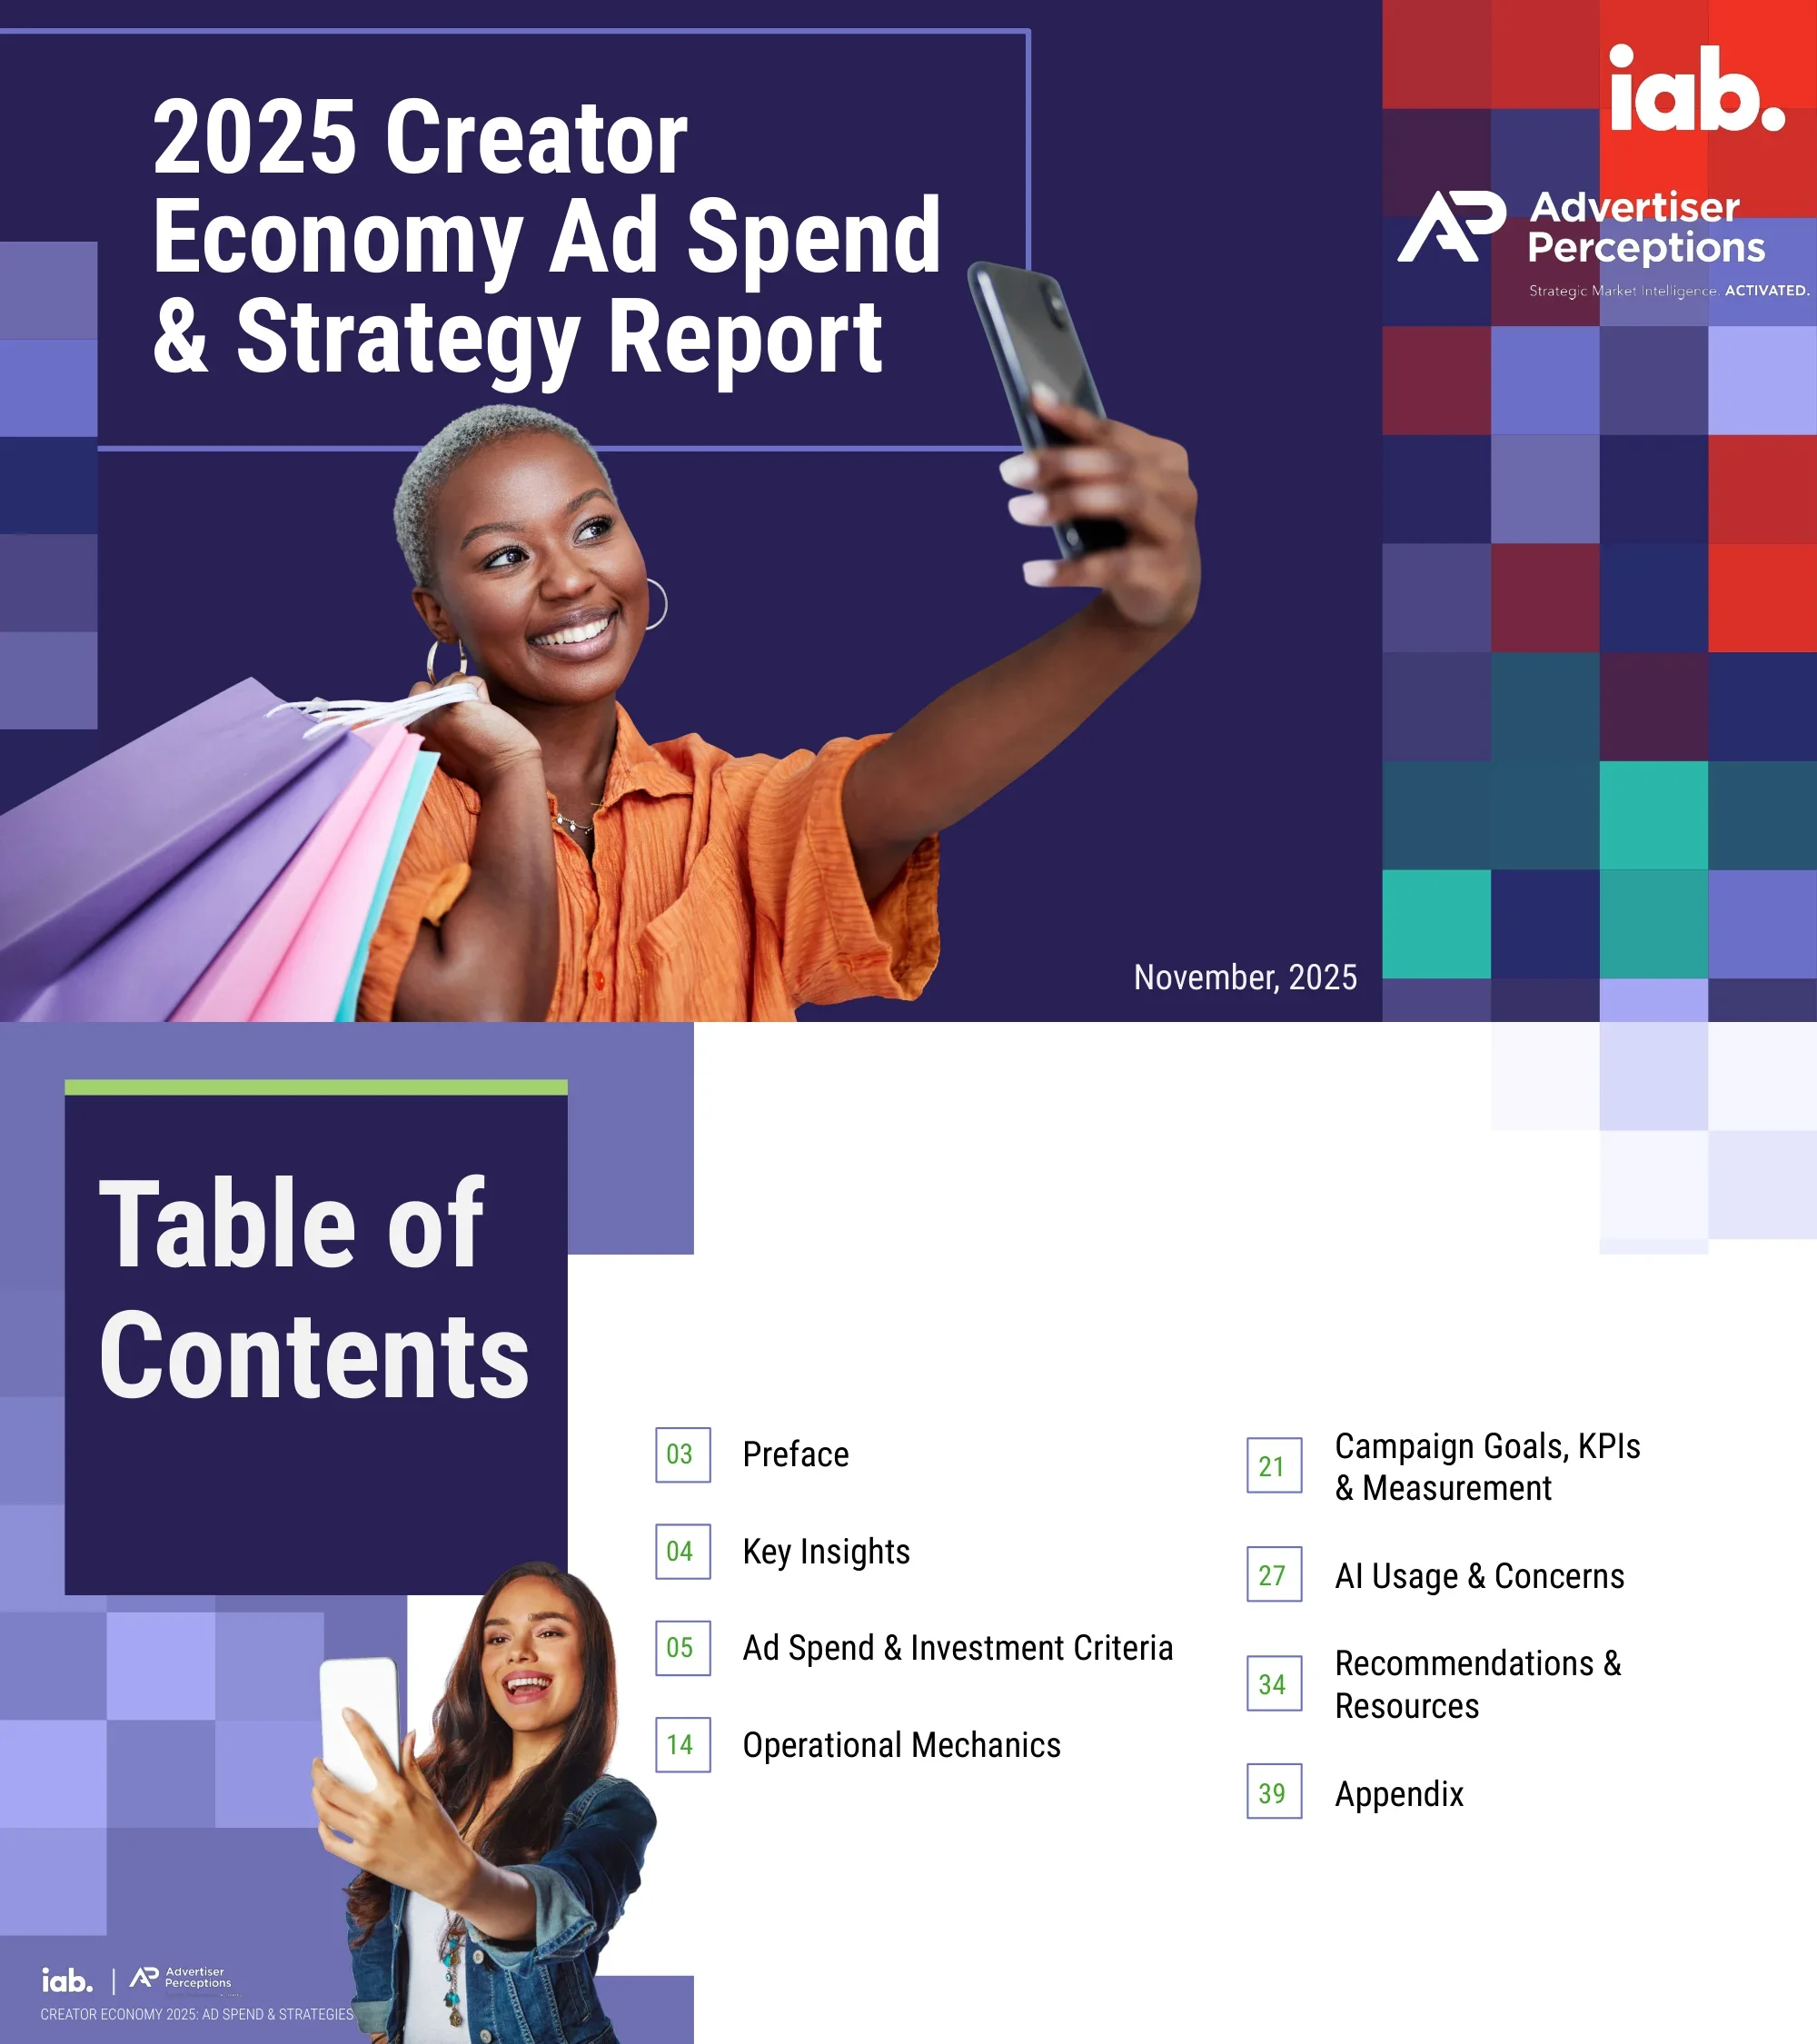
2025 Creator Economy Ad Spend & Strategy Report
Quick Navigation
Tags
Share the slides
2025 Creator Economy Ad Spend & Strategy Report
Detailed view of each slide page, including layout, key content and visual elements.
Bold report title with date (November 2025) and co-publisher branding from IAB and Advertiser Perceptions, anchored by a creator selfie hero image.
Full-bleed split layout: white report title top-left over dark navy, creator-with-shopping-bags photo center-left, checkered pixel mosaic pattern right.
Eight-chapter roadmap spanning Preface, Key Insights, Ad Spend & Investment Criteria, Operational Mechanics, Campaign Goals/KPIs & Measurement, AI Usage & Concerns, Recommendations & Resources, and Appendix with page numbers.
Two-column contents list with green-bordered page number tags, dark navy title block on left, creator photo bottom-left.
Sets the research context: creator economy has moved from niche movement to central force in marketing; report combines a 450+ decision-maker survey with qualitative interviews to quantify $37B 2025 ad spend and surface persistent challenges in creator identification, ROI, and tools.
Two-column text with dark purple accent headings left, supporting photos stacked right, lavender background.
Five-card executive summary: (1) Creator ad spend to grow 26% to $37B, 4x faster than media; (2) Awareness and reach lead goals but sales is close behind; (3) Identifying the right creators is the top challenge; (4) 3 in 4 brands use or plan to use AI; (5) Measurement, standards, and operational tools are top improvement areas.
Five numbered card columns left-to-right with red-bordered numeral tags above bolded insight lines and explanatory body text; dark navy accent header band.
Opens the first major analytical section on how brands size, allocate, and direct creator ad spend.
Photo-collage left with two creator images, large section title right on lime-green background block with yellow accent.
Methodology framing: IAB measures intentional, brand-directed investment across four spend types — Direct Partnerships, Amplification on Social Media, Amplification Beyond Social, and Other Ad Adjacencies — rather than broader TAM approaches that include affiliate, subscriptions, tips, and merchandise.
Left text column with methodology rationale, right 2x2 grid of spend-type definition cards with icon badges.
Spend has more than doubled since 2021 ($13.9B → $29.5B in 2024), with 2025 projected at $37.1B (+26%) and 2026 at $43.9B (+18%) — about 4x media industry growth (+5.7%).
Left narrative column with $37B callout block, right vertical bar chart 2021–2026 with green historical bars and yellow projection bars, growth-percentage labels.
Stacked-bar breakdown showing parallel growth across direct partnerships, paid amplification on social, amplification beyond social, and intentional ad adjacencies from 2021 through 2026. 9+ in 10 brands invest across all four spend types.
Left narrative column, right stacked vertical bar chart with four color-coded spend-type layers per year and growth-percentage callouts.
2025 creator ad spend by category: Retail $12.3B (+38%), CPG $5.5B (+24%), Financial $2.2B (+31%), Apparel $2.1B (+14%), Tech $1.9B (+26%), Auto $1.6B (+11%), Telecom $1.5B (+19%), Travel $1.3B (+31%), Home $1.2B (+16%), Health & Wellness $1.0B (+40%), Media & Entertainment $0.4B (+39%).
Horizontal title band, large vertical bar chart across eleven category columns with dollar values above bars and YoY growth percentages inside pill badges.
48% of ad spenders consider creators a 'must buy' — ranking behind only Social Media (74%) and Paid Search (60%), ahead of CTV (40%), Commerce Media (40%), Digital Display (39%), Linear TV (36%), Digital Audio (30%), Online Video (29%), Other Traditional (26%), and Podcasts (25%).
Left explanation with brand-size insight, right horizontal bar chart with twelve media types ranked by must-buy percentage, creator bar highlighted yellow.
Pull quote from a C-Suite Executive at an Agency Holding Company: creator marketing is the one thing that can deliver personalization at scale and create intimacy that best represents 'people like me.'
Centered italic quote with large green quotation mark icon upper-left, speaker attribution pill bottom-right, lavender background with checkered mosaic right panel.
Partnership distribution: 61% Mid-Tier (50K-500K), 55% Macro (500K-1M), 55% Micro (10K-50K), 45% Nano (1K-100K), 42% Top-Tier/Mega (1M-5M), 30% VIP/Celebrity (5M+). Large brands skew to macro, small brands skew to nano.
Top narrative panel, six horizontally-arranged circular chart badges in descending size representing creator tier percentages on navy background.
Very-important creator-selection criteria: Creator Reputation 58%, Audience Alignment 56%, Target Platform Presence 54%, Brand Values/Tone 50%, Past Performance 46%, Ease of Collaboration 43%, Category Expertise 38%, Cost-Effective 34%, Speed 33%, Adaptable Content 30%, Unique Voice 28%.
Left narrative column with small-brand callout, right eleven-row horizontal bar chart with yellow top-three differentiation.
Opens the section on how brands actually execute creator marketing — partnership structures, funding sources, and payment models.
Split layout with two stacked creator photos left and oversize Operational Mechanics title right on lime-green block.
Top 3 challenge ranking: Identifying right creators 32%, Managing relationships 25%, Controlling content quality 25%, Ensuring brand integrity 25%, Negotiating contracts 25%, Measuring performance 24%, Scaling 20%, Mitigating fraud 20%, Tools for managing buys 18%, Repurposing content 18%, Platform changes 17%, Expertise 16%, Payment transparency 13%.
Left narrative with CPG/Retail category insight, right horizontal bar chart with yellow-highlighted top challenge and green bars for remainder.
Pull quote from Product Marketing Lead at a Social Platform on the difficulty of measuring creator performance and quantifying it well enough to decide if a creator is the right fit.
Centered italic quote on lavender background with large green quote-mark glyph and green attribution pill bottom-right.
Partnering channels in use: Platforms managed by social networks 53%, Platforms managed by media cos 49%, Direct outreach 48%, Independent creator platforms 43%, Creator-specific media/creative agencies 41%, Creator-specific representation agencies 40%, Affiliate networks 28%, Talent reps 28%, Sports reps 20%.
Left narrative column, right nine-row horizontal bar chart with three-color legend distinguishing social/media companies, direct connection, and agency/platform.
Budgets funding creator marketing: Social Media 62%, Creator-Specific 53%, General Digital Advertising 48%, General Advertising 45%, Creative Production 34%, Experimental 26%, Linear/CTV 21%. Funding is fragmented, which partially explains the flat-fee pricing dominance.
Top narrative panel, seven yellow/green circular budget-source badges descending in size, arrayed on navy data container.
Flat-fee dominates creator payment (~75% adoption) vs. performance-based (49%) and retainer (48%) models. Flat fees favor cost certainty over optimization. In finance and health & wellness categories, nearly 9 in 10 brands use flat fees due to data-sharing restrictions.
Left giant '3 in 4' stat block on green background with handshake photo, right explanatory narrative with category insight callout.
Pull quote from a Creator Lead at a Social Platform on the need for basic standard contract terms and organized industry agreement on blocking-and-tackling fundamentals.
Centered italic quote on lavender background with green quote-mark glyph and green attribution pill.
Opens the section on what brands are trying to achieve with creators, which metrics they track, and the measurement hurdles they face.
Split layout with two creator/content-production photos left and oversize section title right on lime-green block.
Top creator-marketing goals (top-3 selection): Building Brand Awareness 43%, Reaching New Audiences 41%, Enhancing Brand Reputation/Trust 35%, Driving Online Sales/Conversions 32%, Increasing Consideration 32%, Social Media Engagement 30%, Generating Leads 27%, Offline Sales 19%, Website Traffic 18%, In-Store Foot Traffic 16%. Start-of-journey metrics dominate.
Left narrative with CPG insight, right ten-row horizontal bar chart with journey-stage color legend (start/mid/end).
Top 3 KPIs: Overall ROI 40%, Engagement Rates 34%, Brand Follower Growth 30%, Impressions/Views 26%, Reach/Frequency 24%, Site Traffic 23%, Cost-Per-Acquisition 21%, Cost-Per-Lead 19%, Branded Search 17%. Key disconnect: ROI is top KPI despite sales being only the fourth-most common goal.
Horizontal page with nine vertical pill-shaped bars across the bottom and disconnect/category-insight callouts up top.
Primary KPI measurement sources: Ad Platform Reporting 55%, Internal/1P Analytics 49%, Creator-Provided Reporting 39%, Internal Business KPIs 37%, 3P Measurement Providers 35%, Brand-Lift Studies 34%, Retailer/Partner Data 32%, MMM 29%, Foot-Traffic Solutions 26%, MTA 25%.
Left narrative column, right ten-row horizontal bar chart with yellow top-two highlight.
Top 3 measurement challenges: Proving ROI 39%, Attributing Sales to Creators 34%, Tracking Long-Term Impact 32%, Attributing Brand Lift 31%, Incorporating Creator Results in MMMs 28%, Measuring Reach/Frequency 26%, Comparing ROI vs Other Channels 26%, Incorporating 3P Tracking 24%, Inconsistent Cross-Platform Reporting 23%, Inconsistent Cross-Creator Reporting 22%.
Left narrative with category callouts for finance, health, auto, tech, telecom, right ten-row horizontal bar chart with yellow top-two highlight.
Pull quote from a Marketing Lead at a Creator Platform on how CMOs are thinking holistically — cost to grow audience, engagement, and full-funnel sales conversion.
Centered italic quote on lavender background with green quote-mark glyph and green attribution pill.
Opens the section on how brands are adopting AI in creator marketing and what concerns accompany that adoption.
Split layout with two creator/podcasting photos left and oversize AI Usage & Concerns title right on lime-green block.
AI adoption for creator marketing: 46% Currently Using, 29% Planning to Use in Next 12 Months, 17% Not Using but Interested, 8% Not Using and Not Planning. Finance and health & wellness lag due to trust and compliance requirements.
Left narrative column with category insight, right donut chart split into four color-coded adoption-status segments on navy background with phone prop.
AI tasks in creator campaigns: Content Editing 49%, Creator Briefs 46%, Content Personalization 45%, A/B Testing 42%, Performance Reports 38%, Creator Selection 35%, Synthetic Content 34%, Optimizing Content Distribution 33%, Synthetic Creators 30%. Full creative replacement has not gone mainstream.
Horizontal page with nine vertical pill-shaped bars across the bottom grouped by Content Creation, Strategy/Planning, and Optimization/Measurement legend colors.
AI adoption by brand size shows small and mid-tier brands outpacing large spenders in Edit/Enhance Content (52/56/42%), Creator Briefs (50/50/40%), Creator Selection (39/42/28%), and Optimizing Distribution (36/40/27%).
Left narrative with vlogger photo, right grouped vertical bar chart with four task clusters and three brand-size color bars per task.
95% of brands have concerns about using AI in creator marketing. #1 concern: lack of authenticity or human connection — a critical concern given brand-building is a primary creator-marketing goal.
Split hero layout with 95% stat tile left, #1 concern tile right, pensive-creator photograph center, navy background.
Pull quote from a Marketing Lead at a Creator Platform on how AI speeds up decision-making and helps everyone get to information faster, especially platform search.
Centered italic quote on lavender background with green quote-mark glyph and green attribution pill.
Synthesizes the report: U.S. creator economy is now a cornerstone of modern marketing, projected to $37B in 2025 (4x media industry growth). Brands invest to build trust, credibility, and engagement while facing measurement, attribution, and creator-discovery gaps. AI reshapes creation but demands standards and responsible innovation.
Dark-navy left column with long-form recap narrative, right hero photograph of a creator smiling at phone on checkered mosaic background.
Opens the action-oriented section with operational, governance, and measurement recommendations plus IAB community resources.
Split layout with two group-creator photos left and oversize Recommendations & Resources title right on lime-green block.
Key finding on discovery, contracting, and payment-transparency gaps. Recommendations: adopt trusted discovery platforms, use IAB Creator Contract Checklist, tap influencer marketing hubs, standardize internal workflows for selection/briefing/payment, and leverage workflow automation.
Header block with key finding and context above, dual-column card below with photograph left and bulleted recommendations right on dark navy.
Key finding on AI authenticity, fraud prevention, and legal compliance concerns. Recommendations: adhere to AI-content disclosure, use platform authentication, establish brand integrity protocols, standardize contracts, and leverage IAB Tech Lab's CoMP AI framework.
Header block with key finding and context above, dual-column card below with photograph left and bulleted recommendations right on dark navy.
Key finding on attribution and reporting gaps. Recommendations: comply with standard measurement frameworks (e.g., IAB Tech Lab Conversion API), feed performance into MMM/MTA, integrate creators into omnichannel plans, and measure beyond ROI with brand and audience-trust indicators.
Header block with key finding and context above, dual-column card below with photograph left and bulleted recommendations right on dark navy.
Community and insight assets: Creator Economy Board of Directors, Creator Economy Committee, Ecosystem Mindmap, Definitions & Taxonomy, Creative Showcase, Defining the Infrastructure of Creator Brand Deals Workstream.
Two stacked resource cards (Participate in Our Groups, Leverage Our Insights) with hyperlinked asset names and descriptive blurbs; creator thumbnail bottom-left.
Opens the appendix with methodology, respondent profile, and about-the-publishers content.
Split layout with two creator/podcasting photos left and oversize Appendix title right on lime-green block.
What's most needed to improve creator marketing: Advanced Attribution 28%, Consistent Reporting 26%, Creator Discovery/Vetting 25%, Audience Authentication/Fraud Standards 24%, Responsible AI Standards 23%, Improved Brand Integrity Controls 20%, MMM Incorporation 20%, Activation Tools 19%, Creative Production Standards 19%, Payments/Fees Visibility 18%, Creator Education 17%, Brand/Agency Education 17%, Contract/Legal Standards 16%.
Left narrative column, right thirteen-row horizontal bar chart with four-category color legend (Measurement, Governance, Operational Standards, Education).
Fielded July 28 – August 12, 2025; 15-minute anonymous online survey of n=453 verified marketing decision-makers at brands and agencies. Market size and growth methodology combines AdPROs community data, Advertiser Perceptions research, and public company financials.
Two parallel dark-navy cards listing quantitative sample execution and market size methodology; creator-filming photograph right and top header.
Company Type: 60% Agencies, 40% Brands/Marketers. Company Size: 32% <$10M, 25% $10-$50M, 43% $50M+. Job Title: 39% C-Level/President, 31% EVP/SVP/VP, 30% Director. Market Sectors include Automotive, CPG, Financial Services, Retail, Telecom, Media/Entertainment, Fashion/Apparel, Home Furnishing, Health/Wellness, Travel, Tech/CE, and Other.
Three donut-chart circles top row (Company Type, Company Size, Job Title) with market-sector grid bottom on dark navy background.
IAB is the Interactive Advertising Bureau — 700+ member media, brands, agencies, and ad tech firms; affiliated with IAB Tech Lab. IAB's Experience Center focuses on future-proofing the industry around creator, CTV, and emerging channels; lists current Creator Economy Board member companies.
Two-column layout with About IAB text left and About Experience Center text right over a navy board-member roster box.
Advertiser Perceptions provides research-based strategic market intelligence to media, advertising, and ad tech industries via the curated Ad PROS Network and deep relationships with the largest advertisers.
Left text column with publisher description and URL, right stacked dual creator photographs.
IAB contributors: Chris Bruderle (VP, Industry Insights), Meredith Guiness (Director, Research & Insights), Jack Koch (SVP, Research & Insights). Advertiser Perceptions contributors: Eric Haggstrom (SVP, BI), Pami Kellert (Sr. Research Dir, BI Ops), Diane Malloy (SVP, Sales), Nicole Perrin (EVP, BI).
Left hero creator-selfie photo on pink-tiled background, right contributor credits grouped under IAB and Advertiser Perceptions logos.
Common questions about this slide and the underlying presentation content.
It's a first-of-its-kind joint research report from IAB (Interactive Advertising Bureau) and Advertiser Perceptions, published November 2025. It quantifies U.S. creator ad spend, maps brand partnership patterns, and documents AI adoption based on a survey of 453 U.S. ad decision-makers plus qualitative interviews with senior marketing leaders.
U.S. creator economy ad spend is projected to reach $37.1B in 2025 and $43.9B in 2026. The 2025 figure represents 26% year-over-year growth — roughly 4x faster than the broader media industry's 5.7% growth. Spend has more than doubled from $13.9B in 2021 to $29.5B in 2024.
Retail leads at $12.3B (+38% YoY) and CPG follows at $5.5B (+24%). All eleven measured categories exceed $400M in annual spend with double-digit growth, including Financial Services, Apparel, Tech, Auto, Telecom, Travel, Home, Health & Wellness, and Media & Entertainment.
CMOs and VP-level marketers, brand and agency strategists, media buyers, creator platform operators, influencer marketing agencies, research analysts, and investors — anyone briefing leadership on creator economy sizing or presenting annual budget plans, pitch decks, or industry keynotes.
Yes. The deck is fully editable — you can swap out charts, update statistics with newer data, replace photographs, change color schemes, and customize the recommendations for your organization. The modular section-divider + data-slide + quote-slide + recommendation-slide pattern makes it easy to trim or extend.
The top operational challenge is identifying the right creators to partner with (32% cite it as a top-3 challenge). The top measurement challenge is proving ROI (39%), followed by attributing sales to creators (34%). Standardization across contracts, payments, and reporting remains a persistent gap.
46% of brands currently use AI and another 29% plan to within 12 months. Top AI use cases are content editing (49%), creator briefs (46%), content personalization (45%), A/B testing (42%), and performance reports (38%). However, 95% of brands have concerns about AI — authenticity and human connection being the #1 concern.
Mid-tier creators (50K–500K followers) lead at 61% adoption, followed by Macro (500K–1M) and Micro (10K–50K) both at 55%, Nano (1K–100K) at 45%, Top-Tier/Mega (1M–5M) at 42%, and VIP/Celebrity (5M+) at 30%. Large brands skew toward macro creators, while small brands rely more on nano creators.

Create Your Own Slides
Turn your ideas into professional presentations in seconds with 2slides AI.
Reference professional designs, choose your style, and generate slides with perfect text rendering. Powered by Nano Banana—start creating your presentation now.
Your AI Agent for slides. Save time, shine faster with intelligent presentation creation.




© 2026 2slides. All rights reserved.