
Fa parte di Esempi di presentazioni per investitori
Volkswagen Group Investor Relations Roadshow Presentation November 2024
Navigazione Rapida
Tag
Condividi le slide
Volkswagen Group Investor Relations Roadshow Presentation November 2024
Vista dettagliata di ogni pagina di slide, inclusi layout, contenuto chiave ed elementi visivi.
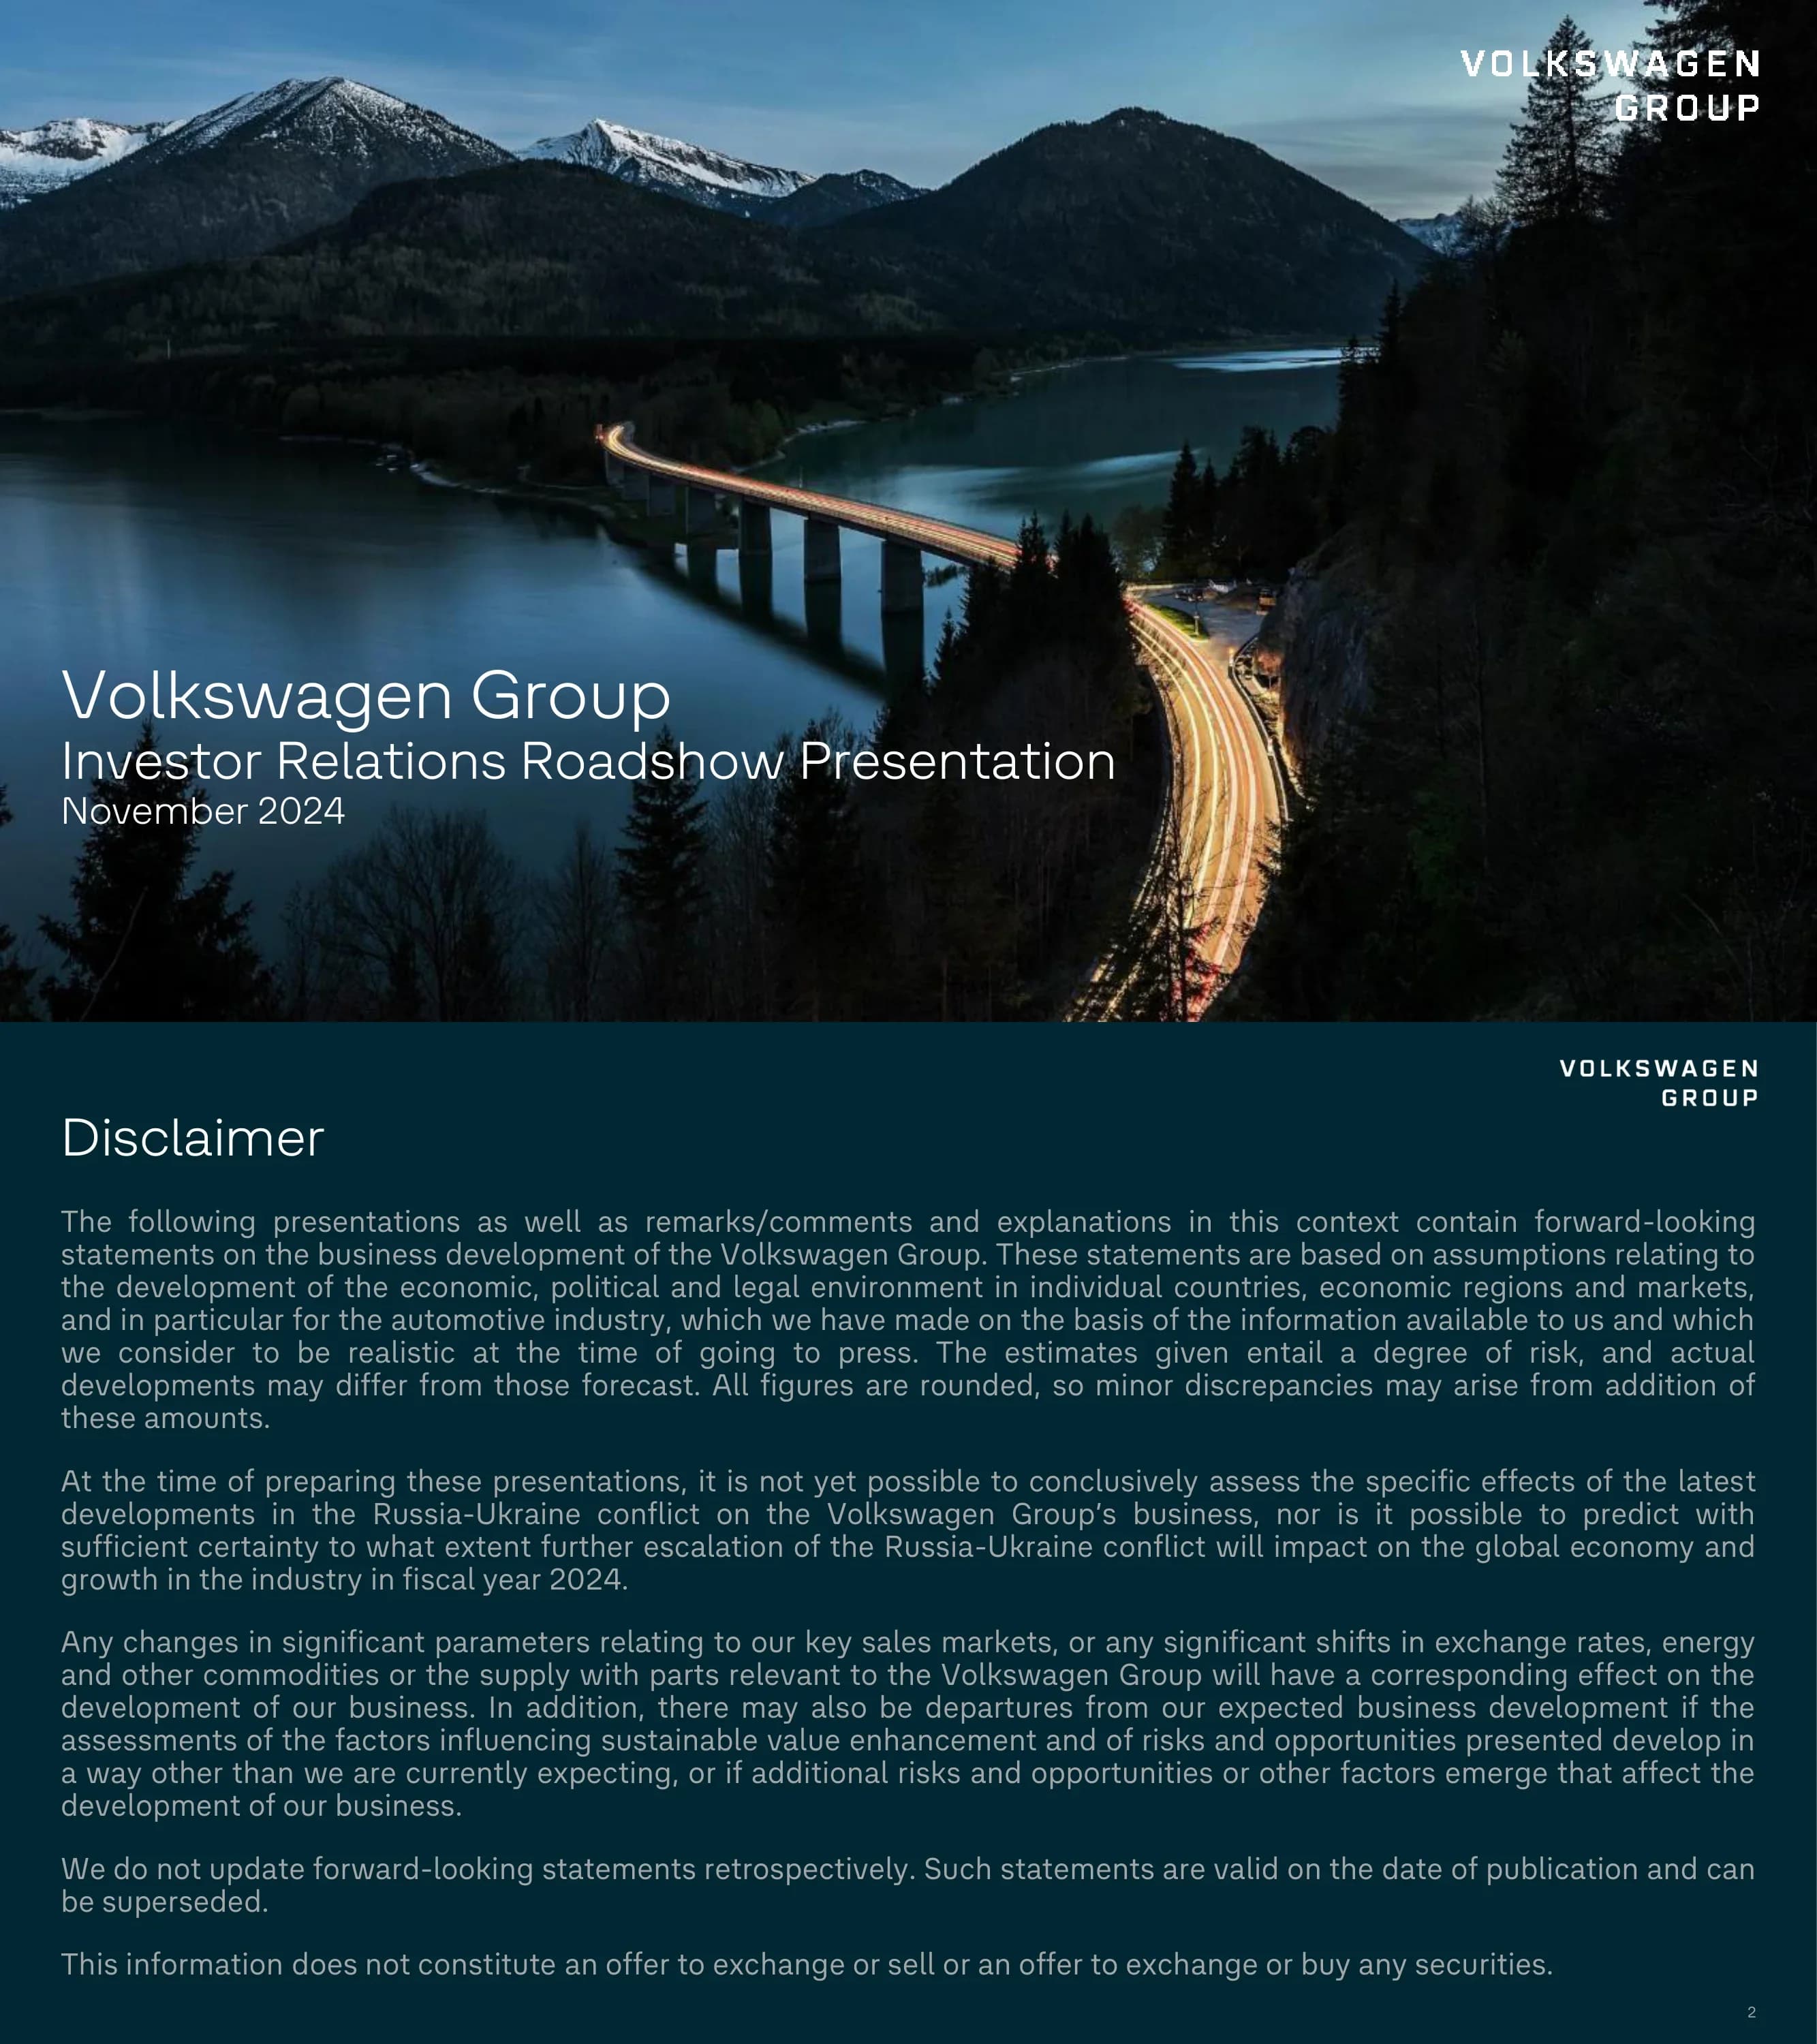
Cover page featuring a mountain/bridge night photograph with the title 'Volkswagen Group — Investor Relations Roadshow Presentation — November 2024'.
Full-bleed hero photograph with centered title text overlay and VW GROUP wordmark top-right.
Legal disclaimer covering forward-looking statements, risks, and limitations of the financial information presented in the deck.
Single-column dense text block on dark teal background with VW GROUP wordmark top-right.
Section opener labeled '1 — Volkswagen Group Introduction' in large display type.
Minimal full-bleed section divider with large section number and title; lime/neon green accent.
High-level group overview presenting six headline KPIs: €322.3bn revenue, 114 production facilities, 684k employees, 9.2m deliveries, 13 brands (9 car + 4 truck), and up to 250k cars per week.
Hero stat grid with large numerical callouts arranged in two rows against dark teal background.
Four investment pillars: unmatched portfolio breadth, global reach with synergies, 2027 mid-term targets (5–7% revenue CAGR, 8–10% RoS), and strong balance sheet with ≥30% dividend payout.
2×2 icon-and-text pillar grid with neon green icons on dark teal.
Competitive positioning across five segments: Modern Luxury #1 (Porsche), Luxury #1 (Lamborghini/Bentley), Premium Top 3 (Audi), Volume Top 4 (VW/Skoda/SEAT/Cupra/CVs), Trucks Top 2 (Scania/MAN/International).
Vertical stack of segment bars with brand logos and ranking callouts, using neon green for #1 positions.
2D matrix positioning all VW Group brands on axes of Luxury Focus (vertical) versus Value Orientation (horizontal), illustrating portfolio breadth.
Quadrant scatter chart with brand logos placed at relevant positions; axes labeled in white.
FY2023 delivery split (9.2m vehicles: China 36%, W.Europe 35%, N.America 10%, S.America 5%) alongside total revenue €322bn and operating result €22.6bn.
Donut chart for deliveries by region paired with two large KPI callouts for revenue and operating result.
VW Group market share by region for FY2023: Europe ~23%, South America ~13%, China ~14%, North America ~5%.
World map with regional percentage callouts overlaid on key markets.
Revenue and RoS by brand group: Core €137.8bn/5.3%, Progressive €69.9bn/9.0%, Sport Luxury €37.3bn/18.6%, Trucks €45.7bn/8.1%.
Four-column branded table with revenue bars and RoS percentages in neon green.
Results for CARIAD (op loss -€2.4bn), Battery/PowerCo (loss -€417m), and Mobility/VW Financial Services (€50.8bn revenue, 6.4% RoS).
Three-panel card layout showing segment name, revenue, and operating result with color-coded loss/profit indicators.
Section opener labeled '2 — Strategy' introducing the strategy section of the presentation.
Full-bleed section divider with large section number and title, lime green accent.
Group steering matrix mapping four brand groups (Core, Progressive, Sport Luxury, Trucks) against four technology platforms (Architecture, Software, Battery, Mobility).
4×4 grid matrix with brand group rows and technology platform columns; cells show shared/dedicated designations.
Architecture consolidation plan progressing from 4 ICE platforms today through 3 pioneer BEV (2024/25), to MEB+/PPE, converging on a single SSP backbone in the future.
Horizontal timeline roadmap with architecture platform blocks color-coded by phase.
Software ecosystem overview including the VW Group + Rivian global JV, XPENG partnership in China, CARIAD ADAS/infotainment, and key partners: Bosch/Mobileye, Qualcomm, Harman/Kardon, Horizon Robotics, ThunderSoft.
Hub-and-spoke diagram with partner logos arranged around central VW Group node.
JV technology integration roadmap covering MEB, MEB+, CMP, PPE, and SSP architectures, with the first vehicle featuring JV technology expected in 2027.
Phased timeline with architecture milestones and investment tranche callouts.
PowerCo unified cell strategy with regionally tailored make/buy approach; three gigafactories: Salzgitter (2025), Valencia (2026/27), St. Thomas Canada (2027); >80% raw materials secured.
World map with gigafactory pins plus vertical integration pyramid graphic.
Up to ~30% of cobalt, nickel, and lithium requirements secured until 2029 via financial hedging, long-term contracts, and strategic investments.
Bar or gauge chart per commodity showing secured versus unsecured percentage through 2029.
Mobility business spectrum from micro-mobility to fleet financing, anchored by ONE FLEET via Europcar Mobility Group and VW Financial Services as the backbone.
Horizontal spectrum bar from micro to finance with service category icons beneath.
Core brand group strategy: VW leading Europe, Skoda differentiation, SEAT/Cupra cost and capital efficiency focus, ID.Buzz as entry BEV scale platform.
Four brand cards with brand logos, strategic priority headline, and supporting bullets.
Progressive group strategy: Audi portfolio renewal in 2024/25, Lamborghini outstanding products, Bentley focus on China and North America, new ICE generation for flexible BEV transition.
Four brand cards with strategic priority headlines and supporting detail bullets.
Porsche strategy pillars: iconic heritage, structural growth, sustainable luxury, and resilient performance.
Full-width Porsche feature card with four strategic pillars listed alongside a hero vehicle image.
TRATON strategy (Scania/MAN/International): TRATON Modular System, BEV offering expansion, services growth, targeting 9–11% RoS by 2029.
Brand group card with strategy pillars and RoS target callout; TRATON brand logos strip.
Summary table of mid-term and strategic RoS targets and BEV share goals: Core 8%, Progressive 12%/14%, Sport Luxury 19%/20%, TRATON 9–11% by 2029.
Five-row target table with brand group, mid-term RoS, strategic RoS, and BEV share columns.
'In China, for China' strategy: CMP platform, XPENG partnership, 2030 targets of 4m vehicles, ~15% market share, ~€3bn proportionate operating profit.
Geographic strategy card with 2030 KPI targets and partnership logos.
Europe strategy: sustain #1 position, align investment with profit pools, rightsize ICE capacity, and digitize the dealer network.
Europe map with four strategic priority cards arranged alongside.
North America growth plan: new Scout plant in South Carolina, Rivian/CARIAD hub in Silicon Valley, battery plant in Ontario; Scout brand as a major long-term opportunity.
North America map with facility pins and strategic initiative cards.
Long heritage in South America with a financial turnaround completed in 2021 and ongoing portfolio shift to SUVs/CUVs; plants in Taubaté, Anchieta, Curitiba (Brazil) and Buenos Aires (Argentina).
South America map with plant pins alongside portfolio shift chart.
Asset-light India opportunity leveraging Mahindra term sheet; market projected to grow from 4.6m to 6.4m units by 2030.
India map with market size growth chart and Mahindra partnership callout.
Structured table comparing FY2023 actuals against 2024 guidance, 2027 mid-term targets, and 2030 strategic targets for revenue, RoS, investment ratio, and net cash flow.
Four-column target table (actuals / guidance / mid-term / strategic) with row-by-row KPI comparison.
Section opener labeled '3 — Capital Allocation'.
Full-bleed section divider with large section number and title, lime green accent.
Cumulative mid-term investment of ~€180bn (~12% of revenue) structured as a pyramid: base ~9%, +1% competitiveness programs, +1% batteries, +1% strategic topics.
Stacked pyramid graphic with layer labels and investment percentages; total figure prominently displayed.
Investment ratio declining from 13.5% in 2023 to <11% by 2027 mid-term target and ~9% by 2030 strategic target.
Line/bar chart showing investment ratio decline over time with target band annotations.
Dividend per share history from €4.86 (2018) to €9.06 (2023); strategic payout target ≥30%; €22bn total returned to shareholders 2021–2023.
Bar chart of DPS by year with payout ratio overlay and total return callout box.
Automotive Division net liquidity at €40bn as of FY2023; strategic target >10% of revenue; stable investment-grade credit rating maintained.
Line chart of net liquidity over time with target threshold line and credit rating badge.
Key balance sheet metrics as of December 2023: equity 48% of total (€146bn), EBITDA €37bn, net liquidity €40bn.
Structured balance sheet summary card with three headline KPI blocks.
Section opener labeled '4 — 9M/2024 Results'.
Full-bleed section divider with large section number and title, lime green accent.
Key product launches in Q3 2024: ID.7 GTX, VW Transporter, ID.UNYX (China), Skoda Elroq, Audi A6 e-tron, and Porsche 911 GT3 50 Years Edition.
Six-panel product image grid with model name labels and brand callouts.
Completed tranches: $1.0bn MCN and $1.3bn direct equity/IP; upcoming tranches: $1.0bn × 2 and $0.5bn through 2027.
Horizontal milestone timeline with completed and upcoming tranche markers.
World premiere of Scout Motors Traveler SUV and Terra Pickup; targets profitable NA segments with a gasoline range-extender option for long-term North American position.
Hero vehicle images side-by-side with strategic rationale bullets and Scout Motors logo.
6.5m vehicles delivered in 9M 2024 (-3% YoY); 507k BEV (-5% YoY, ~8% BEV share); ~11% worldwide market share.
KPI callout trio with YoY change indicators and BEV share highlight.
Regional delivery performance: North America +7%, South America +15%, Europe -1%, China -10% versus prior year.
World map or regional bar chart with YoY change percentages per region.
Top BEV models YTD: ID.4/5 (135k), ID.3 (106k), Q4 e-tron (79k), Enyaq (51k), Born (30k), ID.7 (22k); Q4 2024 BEV share estimated at 9–11%.
Horizontal bar chart ranking BEV models by deliveries with Q4 forecast callout.
Group sales €237.3bn (+1% YoY), operating result €12.9bn (5.4% margin vs 6.9% prior year), with fair value derivative adjustments impacting the reported figure.
KPI summary row with revenue, operating result, and margin; YoY delta indicators.
Profit before tax €12.5bn (-29% YoY), profit after tax €8.9bn (-31%), earnings per share €15.2 (-33%).
Three-step P&L waterfall from operating result through EPS with YoY change percentages.
Underlying operating result €15.4bn (6.5%) versus reported €12.9bn (5.4%); key non-operating items: -€2.2bn restructuring, -€0.2bn VW Bank Russia, -€0.1bn MAN Energy Solutions.
Bridge chart reconciling underlying to reported result with labeled adjustment bars.
Reported net cash flow €3.3bn (31% cash conversion rate), clean NCF €4.2bn; automotive net liquidity €34.4bn at September 2024 (-15% vs December 2023).
Three KPI callouts with YoY comparison and net liquidity trend indicator.
Net liquidity bridge from €40.3bn (December 2023) to €34.4bn (September 2024); key outflows: -€5.2bn dividends, -€1.3bn hybrid capital repayment, -€2.7bn other.
Horizontal waterfall bridge chart with labeled positive and negative bars.
9M 2024 passenger cars operating result €7.3bn (4.7% margin); key drivers: mix/price -€0.7bn, FX/derivatives +€3.8bn, fixed costs and restructuring -€5.8bn.
Waterfall bridge chart showing P&L drivers from prior-year result to current-year result.
Brand group results: Core €101.5bn/4.4% (5.2% underlying); Progressive €46.3bn/4.5% (~8% underlying); Sport Luxury €25.9bn/14.6%.
Three-column brand group cards with revenue, reported margin, and underlying margin callouts.
Automotive Division overhead ratio at 17.4% of revenue in 9M 2024, up from 15.7% in 9M 2023, highlighting cost pressure from volume decline.
Bar or line chart of overhead ratio trend with 9M 2023 and 9M 2024 comparison bars.
9M 2024 investment ratio at 13.6% (€26.3bn); full-year 2024 guidance range 13.5–14.5%.
Single KPI card with investment ratio, absolute figure, and FY guidance range callout.
China JV equity income 9M 2024: €1,180m (-37% YoY); full-year 2024 estimate approximately €1.6bn.
Bar chart of China JV income with YoY comparison and FY estimate annotation.
FY2024 guidance: revenue ~€320bn, operating margin ~5.6% (~€18bn), investment ratio 13.5–14.5%, net cash flow ~€2bn, net liquidity €36–37bn.
Five-row guidance table with KPI label, guidance figure, and comparison to prior year.
Section opener labeled '5 — Sustainability & Governance'.
Full-bleed section divider with large section number and title, lime green accent.
Shareholder breakdown: Porsche Automobil 32%, foreign institutional 20%, Lower Saxony 12%, Qatar 10%, private/other 24%, German institutional 2%; listed on multiple German exchanges.
Donut chart of shareholder structure with legend and stock listing information.
German two-tier governance: Supervisory Board (20 members, Chair Hans Dieter Pötsch) and Management Board (9 members, Chair Dr. Oliver Blume).
Two-column board structure diagram listing member names and roles.
Annual management bonus formula: (Net Cash Flow + RoS) × ESG multiplier across Environmental (Decarbonization Index), Social (Opinion/Diversity Index), and Governance (Compliance/Integrity Factor); maximum 200%.
Formula diagram with ESG multiplier components and bonus cap callout.
Four sustainability dimensions: Nature, Our People, Society, and Business, forming the framework for the group's ESG reporting.
2×2 icon grid with dimension name and short description for each pillar.
Twelve headline ESG KPIs covering CO2 reduction, circular materials, biodiversity, diversity in management, qualification hours, injury rate, supplier S-rating, reputation, social impact, sustainable revenues, BEV share, and green bonds.
4×3 KPI icon grid with KPI name and brief descriptor per cell.
Quantified ESG targets: Scope 1+2 -50% by 2030, Scope 3 Cat.11 -30% by 2030, carbon neutral 2040/2050; BEV share 50% by 2030; green bonds 30% of funding by 2030.
Structured KPI target table with KPI, baseline, interim target, and long-term target columns.
Section opener labeled '6 — Group Financing'.
Full-bleed section divider with large section number and title, lime green accent.
VW AG-guaranteed entities: VW AG and VW Group Mobility; non-guaranteed: TRATON, Scania, Porsche AG; credit relationship diagram showing guarantee structure.
Org-chart style diagram with guaranteed vs non-guaranteed entity groupings.
S&P BBB+ stable outlook for VW AG, VW FS AG, VW Bank, VW FS Overseas; Automotive Debt/EBITDA 0.2x (2023).
Rating summary card with entity list, rating badges, and key metric callout.
Moody's A3 negative outlook for VW AG; VW Bank rated A1/P-1; Automotive Debt/EBITDA 1.6x.
Rating summary card with Moody's ratings, outlook flag, and financial metric.
Fitch A- stable outlook; EBIT margin 7.0% (2023), FCF margin 2.3%; key credit metric assumptions used by Fitch.
Rating summary card with Fitch metrics table and rating badge.
Total financing entity debt maturity schedule as of September 30, 2024; near-term maturities: €22.2bn in 2025, €21.7bn in 2026; profile extends to 2043.
Stacked bar chart of annual maturities through 2043 with near-term years labeled.
VW Group hybrid bond first call dates ranging from 2024 to 2032, illustrating long-term capital structure commitment.
Timeline or table listing hybrid bond series with first call date and outstanding amount.
Currency composition: EUR 61.4%, USD 24.6%, GBP 6.7%; interest rate mix: Fixed 86.9%, Floating 13.1%.
Two donut charts side by side — one for currency, one for fixed/floating split.
Section opener labeled '7 — Backup Financial Tables'.
Full-bleed section divider with large section number and title, lime green accent.
Detailed financial table for 9M 2024 showing vehicle sales, revenue, operating result, and margin for all brands and business fields.
Multi-row financial data table with brand rows, metric columns, and subtotal rows.
Detailed quarterly financial table for Q3 2024 showing vehicle sales, revenue, operating result, and margin by brand.
Multi-row financial data table consistent with 9M format.
Detailed quarterly financial table for Q2 2024 showing vehicle sales, revenue, operating result, and margin by brand.
Multi-row financial data table consistent with prior quarter format.
Detailed quarterly financial table for Q1 2024 showing vehicle sales, revenue, operating result, and margin by brand.
Multi-row financial data table consistent with quarterly series format.
Full-year 2023 financial reference table showing vehicle sales, revenue, operating result, and margin for all brands and segments.
Multi-row annual financial data table with subtotals by brand group.
Section opener labeled '8 — Model Highlights & Appendix'.
Full-bleed section divider with large section number and title, lime green accent.
Upcoming model launch calendar covering VW Golf, ID.UNYX, Audi Q6 e-tron, Porsche Macan e, Bentley Continental GT Speed, Lamborghini Revuetto, Skoda Elroq, VW Tayron, and 2025 launches including Audi Q5/Q3/A7, Skoda Elroq, Lamborghini Huracán, Porsche Boxster e, Cupra Terramar.
Horizontal timeline with vehicle thumbnail images arrayed at launch quarter markers.
Feature page for the new VW Tayron: a China-focused SUV in dark blue/purple with a redesigned interior.
Hero vehicle image occupying 70% of page with key product callouts.
Feature page for the China-specific ID.UNYX BEV crossover coupe with dark premium styling, designed exclusively for the Chinese market.
Hero vehicle image with China-market exclusive badge and premium styling callouts.
Feature page for the ID.7 Tourer, a light blue BEV estate/wagon expanding the ID.7 family in Europe.
Hero vehicle image in dynamic pose with key specification callouts.
Feature page for the Cupra Terramar, a sporty compact SUV in grey targeting the performance-oriented buyer.
Hero vehicle image with Cupra brand styling and performance callouts.
Feature page for the Skoda Elroq, an electric compact SUV priced from approximately €33k.
Hero vehicle image with value-for-money positioning and entry price callout.
Feature page for the new-generation Audi Q5 SUV in blue/black, highlighting design and technology updates.
Hero vehicle image with design highlight callouts and new-generation badge.
Feature page for the new Audi A6 generation, including the A6 e-tron electric variant, showcasing the electrified premium sedan/estate family.
Hero vehicle image with e-tron electrification badge and family variant callouts.
Feature page for the Porsche 911 GT3, shown in white as a track-focused performance variant.
Hero vehicle image on track or studio background with GT3 performance callouts.
Feature page for the Lamborghini Temerario, a blue supercar that succeeds the Huracán.
Hero supercar image in dramatic lighting with Temerario name and successor callout.
Directory of VW Group Investor Relations website and all individual brand homepages for further information.
Structured link list with VW Group IR at top followed by brand links in grid format.
Key IR dates: Q3 results October 30, 2024; Annual Conference March 11, 2025; Q1 April 30; AGM May 16; H1 July 25; 9M October 30, 2025.
Vertical calendar list with event name and date for each upcoming IR event.
Regulatory range, fuel consumption, and CO2 emissions data for VW, Skoda, Porsche, and Bentley model ranges.
Dense regulatory compliance table with model, WLTP range, consumption, and CO2 emissions columns.
Regulatory range, fuel consumption, and CO2 emissions data for Lamborghini and Audi model ranges.
Continuation regulatory compliance table consistent with prior page format.
Regulatory range, fuel consumption, and CO2 emissions data for SEAT and Cupra model ranges.
Final regulatory compliance table in the series consistent with prior page format.
Closing page featuring the 'VOLKSWAGEN GROUP' wordmark centered on a dark teal background.
Minimalist full-bleed dark teal page with centered bold wordmark.
Domande comuni su questa slide e il contenuto della presentazione sottostante.
The 92-page deck covers six main sections: Group Introduction (key stats, brand portfolio, FY2023 results), Strategy (BEV architecture, software, batteries, regional plans, brand group targets), Capital Allocation (€180bn cumulative investment, dividend policy, balance sheet), 9M/2024 Results (deliveries, P&L, cash flow, brand group financials), Sustainability & Governance (ESG KPIs, board structure, bonus framework), and Group Financing (credit ratings from S&P, Moody's, Fitch; debt maturity; hybrid bonds).
The deck uses a professional dark teal background (~#0a2a3a) with lime/neon green (~#c6ff00) as the primary accent color, white body text, and the VW GROUP wordmark placed in the top-right corner on most slides. The aesthetic is clean, high-contrast, and well-suited to premium financial and investor relations presentations.
Mid-term 2027 targets include 5–7% revenue CAGR and 8–10% group RoS with an investment ratio below 11%. The 2030 strategic targets call for ~9% investment ratio, 50% BEV share, carbon-neutral operations by 2040 (Scope 1+2), and Scope 3 Category 11 emissions 30% lower than the 2018 baseline.
The group is consolidating from four ICE platforms today through intermediate MEB+/PPE platforms to a single SSP backbone. Key enablers include the Rivian JV for global software architecture, XPENG partnership for China, PowerCo gigafactories in Germany, Spain, and Canada, and brand-level BEV share targets ranging from ~20% (Core) to ~80% (Sport Luxury) by 2030.
For the first nine months of 2024, the group delivered 6.5m vehicles (-3% YoY), generated sales of €237.3bn (+1%), and reported an operating result of €12.9bn (5.4% margin, down from 6.9%). Underlying operating result was higher at €15.4bn (6.5%) after excluding -€2.2bn restructuring and other non-operating charges.
As of the presentation date, VW AG holds BBB+ (Stable) from S&P, A3 (Negative) from Moody's, and A- (Stable) from Fitch. VW Bank holds A1/P-1 from Moody's. TRATON and Scania are separate financing entities not guaranteed by VW AG.
Yes. The deck is a best-practice example of a comprehensive IR roadshow template. It demonstrates effective structures for company overview, strategy narrative, brand-by-brand financials, capital allocation framing, ESG integration, and financing disclosure — all within a consistent, professional visual design system that can be adapted for other corporate IR decks.
The presentation covers all 13 VW Group brands: the Core group (Volkswagen, Skoda, SEAT, Cupra), the Progressive group (Audi, Lamborghini, Bentley), the Sport Luxury group (Porsche), and the Trucks group (Scania, MAN, International) under TRATON, plus financial services and mobility businesses.

Create Your Own Slides
Turn your ideas into professional presentations in seconds with 2slides AI.
Fai riferimento a design professionali, scegli il tuo stile e genera slide con rendering del testo perfetto. Alimentato da Nano Banana—inizia a creare la tua presentazione ora.
Il Tuo Agente IA per le slide. Risparmia tempo, brilla più velocemente con la creazione intelligente di presentazioni.




© 2026 2slides. Tutti i diritti riservati.