
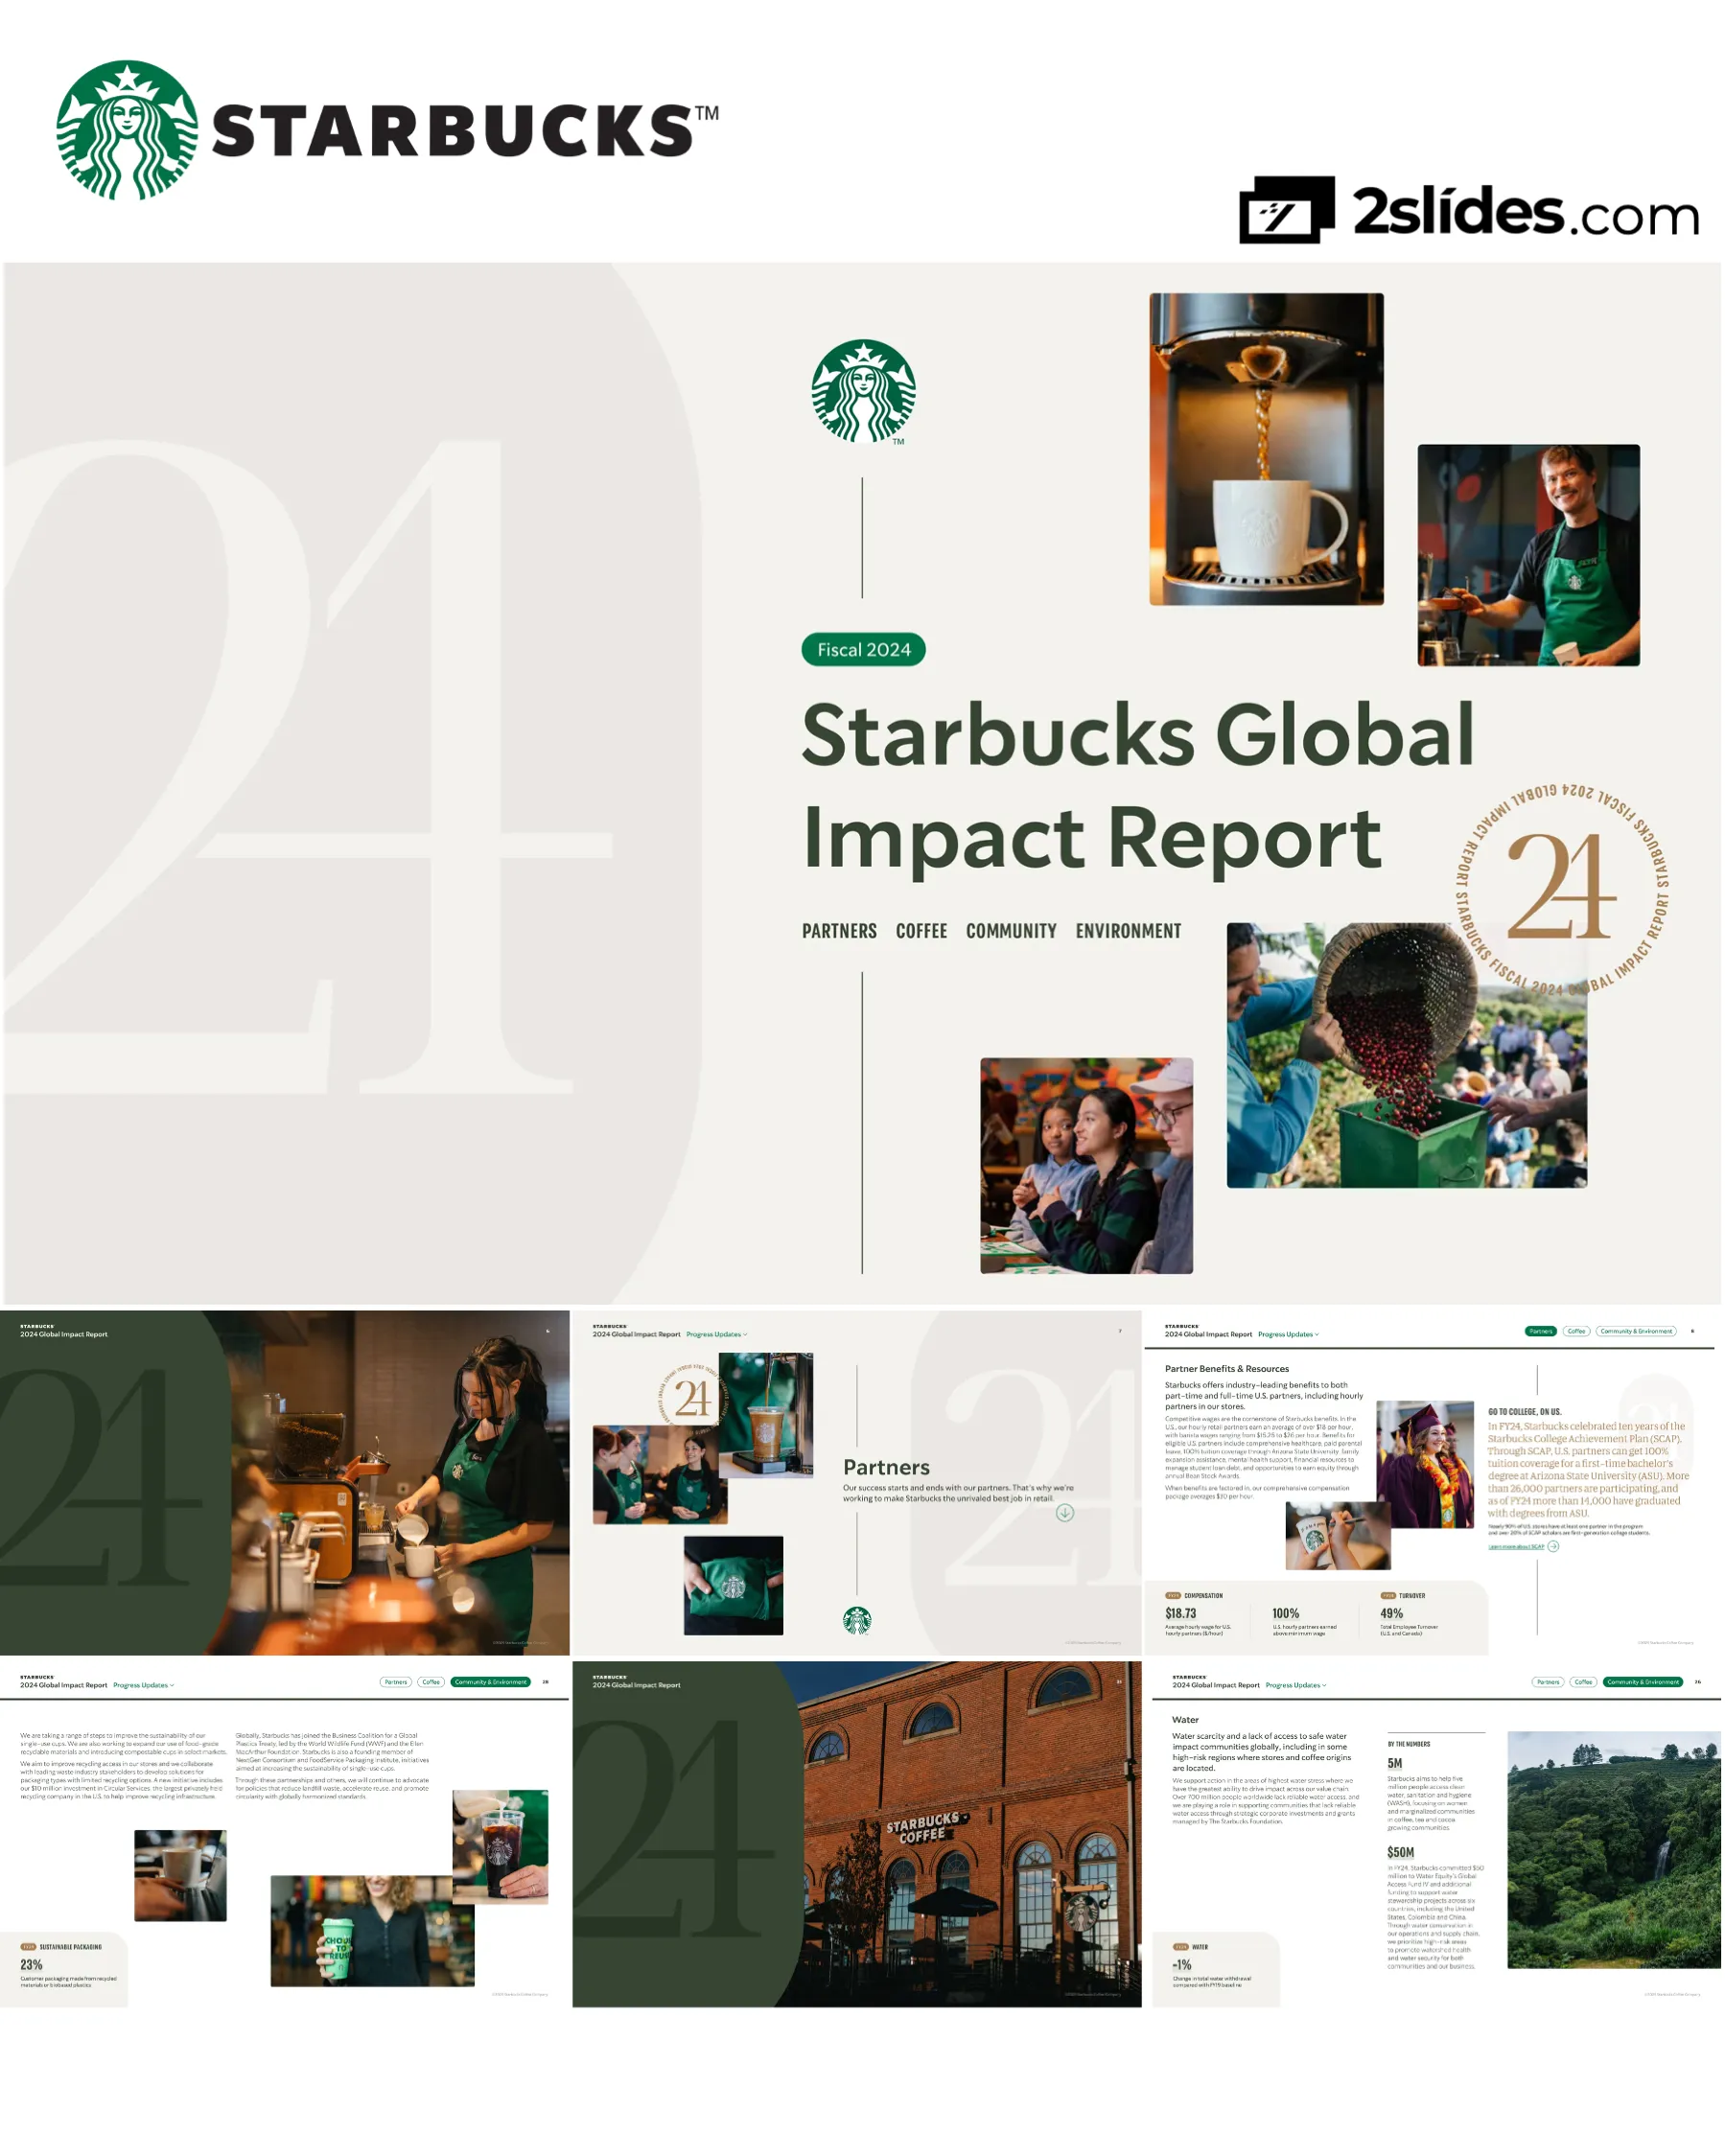
Starbucks Global Impact Report Fiscal Year 2024 - Comprehensive Corporate Social Responsibility and Sustainability Report
Flýtileiðsögn
Merki
Deila glærunum
Starbucks Global Impact Report Fiscal Year 2024 - Comprehensive Corporate Social Responsibility and Sustainability Report
Ítarleg sýn á hverja glærusíðu, þar á meðal útlit, lykilefni og sjónræna þætti.
Professional cover design featuring Starbucks logo, report title, fiscal year designation, and four key pillars: Partners, Coffee, Community, Environment. Includes lifestyle photography showcasing coffee production, baristas, and community engagement
Clean modern design with Starbucks green color scheme, white background, large typography, branded circular '24' anniversary badge, and photo grid
Stunning landscape photography showing terraced coffee plantation on hillside with lush green coffee plants in rows, mountains in background with mist, demonstrating Starbucks connection to coffee origins and sustainable agriculture. Large '24' watermark overlay on left side. Copyright: ©2025 Starbucks Coffee Company
Full-bleed landscape photography with minimal text overlay, '2024 Global Impact Report' text in upper left corner, atmospheric misty mountain landscape
Overview of Starbucks evolution from single Seattle store in 1971 to 40,000+ stores in 88 markets. Emphasizes mission as premier coffee purveyor and commitment to nurturing human spirit. Notes 25-year history of annual Global Impact Report publication
Text-focused page with company history narrative, mission statement callout, and navigation elements for four main report sections
Major FY24 achievements: 10-year SCAP anniversary with 14,000+ graduates; first national coffeehouse offering personal cups for all orders; nearly 100M climate-tolerant coffee trees distributed; $5M in Neighborhood Grants
Bulleted highlight list with supporting statistics and lifestyle photography showing graduates, baristas, coffee seedlings
Report navigation structure showing Progress Updates section (Partners, Coffee, Community & Environment) and Appendix section (Data Tables, About This Report, External Verification)
Dark green background with white text, hierarchical content organization with clickable navigation elements
Atmospheric full-page photograph showing barista 'Sara' in green apron focused on crafting beverage with espresso machine, warm lighting, professional café environment. Large '24' watermark overlay. Demonstrates Starbucks commitment to coffee craft and partner expertise
Full-bleed vertical photography with '2024 Global Impact Report' text in upper left, minimal text overlay, warm professional café lighting
Opening statement emphasizing that success starts and ends with partners (employees). Commitment to making Starbucks the unrivaled best job in retail through industry-leading benefits and support
Section divider page with large 'Partners' heading, mission statement, and photo collage showing baristas and coffee preparation
Details comprehensive benefits for part-time and full-time US partners: average $18.73/hour wage ($30/hour with benefits), 100% tuition coverage via SCAP, healthcare, paid parental leave, Bean Stock equity awards. SCAP milestone: 14,000+ graduates, 26,000+ participants
Two-column layout with benefit descriptions and statistics, graduation photo, data callouts for compensation ($18.73/hour) and turnover (49%)
FY24 benefit enhancements including pay increases, earlier vacation accrual, enhanced financial programs, flexible scheduling. Global benefits examples (China, Canada, Japan, India). Bean Stock program: $2.4B+ in pre-tax gains since inception. Partner Experience Survey: 80% US participation
Mixed content with benefit descriptions, Bean Stock callout box, survey participation statistics, employee photo
Comprehensive 40-hour 'Barista First 30' training, continuous learning opportunities, 63% of US retail leadership filled internally. Coffee Master program return: 4,300+ Black Apron earners. North America Barista Championship launch
Left column training narrative, right column with statistics and championship callout, photos of barista competition and coffee preparation
Commitment to inclusive, accessible, diverse company culture. Focus on creating economic opportunity through industry-leading benefits and career development. Inclusive hiring practices designed to hire strongest candidate for every role
Left column philosophy statement, right column with workforce diversity photos showing partners in various settings including coffee farm
Left: Giving Match program - $2.2M donated in FY24 (17% increase), partners nominate nonprofits, up to $1,000 matching. Right: Comprehensive partner safety including de-escalation training, active shooter response, mental health first aid, store design modifications, restroom sensors, alarm systems
Two-column layout with Community Champions left, Partner Safety right, supported by photos of community service and safe store environment
Dramatic full-page photograph showing coffee roasting process with hand using scoop to move freshly roasted coffee beans, professional roasting equipment visible, warm amber lighting. Large '24' watermark overlay. Illustrates Starbucks coffee expertise and quality control in roasting operations
Full-bleed photography with '2024 Global Impact Report' text in upper left, dark background with warm lighting highlighting roasted beans
Starbucks sources 100% arabica coffee from 26+ origins working with 440,000+ C.A.F.E. Practices verified farms. Focus on improving farm productivity, farmer profitability, and climate resilience through research and innovation
Section divider with large 'Coffee' heading, mission statement, photo collage showing coffee cherries, roasting, farmers, and brewing
99.75% of coffee ethically sourced and verified through C.A.F.E. Practices (Coffee and Farmer Equity Practices). 20-year partnership with Conservation International. Verification covers economic transparency, social responsibility, environmental leadership, and quality. Agronomist quote on 55M rust-resistant seedlings strengthening farmer resilience
Left column explains C.A.F.E. Practices program, right column features agronomist quote and coffee imagery
Hacienda Alsacia (Costa Rica) - hub for agronomy and R&D with 600+ coffee hybrids/varietals. 10 Farmer Support Centers globally training 36,628 people. 70 Model Farms promoting sustainable practices. Global Farmer Fund: $88.3M deployed (goal: $100M by 2025)
Left column describes programs, right column shows statistics and coffee farm landscape photography
Tree distribution achievements: 313,000 shade trees, nearly 90M climate-tolerant coffee trees (goal: 100M by 2025), 55M+ seedlings in Colombia, 968,684 seedlings in Guatemala/Mexico/Ethiopia/Rwanda/Tanzania. Over 43,900 soil samples processed, 1,600+ eco-wet mills contracted
Left column with statistics callouts, right column narrative with coffee tree imagery
Vibrant full-page photograph showing two people embracing and celebrating at outdoor community event, both wearing green Starbucks shirts, joyful expressions, community gathering visible in background. Large '24' watermark overlay. Captures spirit of community connection and partner engagement in neighborhood initiatives
Full-bleed photography with '2024 Global Impact Report' text in upper left, bright outdoor natural lighting, candid celebratory moment
Starbucks works with communities across value chain to help neighbors thrive and protect planet. Led by partners through Starbucks Foundation investments. Scaling innovative solutions for sustainability. Partnerships with Transform to Net Zero and US Food Waste Pact
Section divider with large heading, mission statement, photo collage showing community engagement and coffee farms
FY24 openings: 8 Community Stores (US), 14 international, 105 Military Family Stores, 6 Signing Stores. Total: 46 US Community Stores, 50 international, 238 Military Family, 26 Signing globally. Inclusive Spaces Framework launched in Washington DC with optimized acoustics, lighting, accessible equipment
Left column describes store concepts, right column shows statistics and store photos
FoodShare program available in 100% of US and Canada company-owned stores. FY24 impact: 11.9M lbs food diverted (US), 9.9M meals donated. $16.5M invested in FY24, $89.1M cumulative since FY16 (goal: $100M by 2030). Quote from Feeding America's Chief Supply Chain Officer on partnership impact
Left column describes program, right column features Feeding America quote and food donation imagery
Community Resilience Fund: $100M investment by 2025 supporting CDFIs (Community Development Financial Institutions). FY24: $5.5M invested in four CDFIs. Partnership with Atlanta Dream (WNBA) and ACE to empower local small businesses in Atlanta
Left column describes fund and investments, right column shows photos of community members and food bank volunteers
501(c)(3) established 1997. FY24: $21.4M total grants. Programs: Origin Grants ($4M) supporting 600,000+ women/girls (goal: 1M by 2030), Neighborhood Grants (>$5M to 13,000+ North America organizations), Global Community Impact Grants ($3.3M across 46 markets), disaster response support
Left column describes foundation programs and impact, right column shows grant recipients and statistics
3% change in total emissions from FY19 baseline. 72% renewable electricity globally (100% in US, Canada, UK, Netherlands, Switzerland, Austria, Italy, Japan). Scope 1&2 = 6% of footprint. Partnerships with Nexamp (40MW community solar, Illinois) and Mercedes-Benz (100+ EV charging sites). Volvo partnership: 15 Seattle-Denver charging locations
Left column explains climate strategy and Scope 1&2 work, right column shows coffee farm and EV charging photos with statistics
Scope 3 = 94% of footprint, focus on coffee farming and dairy. Coffee: distributing climate-tolerant trees, shade trees, eliminating deforestation. Dairy: Sustainable Dairy Program launched 2022, Starbucks Dairy Standard published 2024, cost-share program >$8.5M for 50 projects on 28 farms, partnerships with US Dairy Net Zero Initiative and DMAA
Left column describes Scope 3 strategy, right column shows dairy and coffee farming imagery
-1% change in total water withdrawal from FY19 baseline. FY24: $50M committed to Water Equity's Global Access Fund IV plus additional funding for projects in 6 countries (US, Colombia, China). Focus on high-risk watersheds. Goal: help 5M people access WASH (water, sanitation, hygiene) focusing on women and marginalized communities in origin countries
Left column explains water strategy, center shows statistics, right column displays coffee farm landscape with waterfall
First national US/Canada coffeehouse allowing personal cups for all orders (drive-thru, mobile) - removing 2M cups/month from waste. 20+ markets testing reusable cup systems. Germany/Taiwan: reusables available for all. France/Korea/India: default for dine-in. Petaluma, California: city-wide reusable pilot with NextGen Consortium
Left column describes programs, right column shows reusable cup photos and statistics (6% waste change, 27% compostable/recyclable/reusable)
Member of Business Coalition for Global Plastics Treaty (WWF, Ellen MacArthur Foundation). Founding member NextGen Consortium and FoodService Packaging Institute. Improving single-use cup sustainability through recyclable materials and compostable cups in select markets. $10M investment in Circular Services (largest US recycling company)
Left column describes partnerships and initiatives, center shows coffee cup being filled, right column shows reusable cup with sustainability messaging
9,396 Greener Stores verified globally across 59 markets (nearly doubled in past year). Goal: 10,000 by 2025. Third-party verified by SCS Global Services across 8 impact areas: waste diversion, water stewardship, energy efficiency, renewable energy, responsible materials, engagement, sites, community health/wellbeing. Features: energy-efficient equipment, water-saving faucets, low-chemical paints/coatings
Left column explains Greener Stores program, right column shows renewable energy photos (wind turbines, solar panels on store)
Works with 400,000+ coffee farms and 1,500 manufactured goods/services suppliers. Supplier Code of Conduct updated in FY24. Human Rights Impact Assessment (FY23) learnings being applied. Assessment process supports suppliers to resolve issues; suspension retained until resolution. C.A.F.E. Practices verification approach continuing to strengthen
Left column describes policies and approach, right column shows warehouse/manufacturing facilities with organized coffee bags
Full-page photograph showing historic brick Starbucks Coffee building with iconic logo signage, traditional architecture, outdoor seating with white umbrellas, evening/dusk lighting. Large '24' watermark overlay. Represents Starbucks heritage and commitment to community gathering spaces
Full-bleed photography with '2024 Global Impact Report' text in upper left, brick building exterior, warm evening lighting
Introduction to comprehensive data tables section providing updates on progress and information associated with company goals. Tables cover all aspects of impact reporting across Partners, Coffee, Community, and Environment
Clean layout with Fiscal 2024 anniversary badge, title, and description with downward navigation arrow
Detailed compensation data: Average hourly wage $18.73 (FY24) vs $17.42 (FY23), 100% partners above minimum wage, $30 average total compensation package. SCAP statistics: 2,699 graduates in FY24, 14,116 cumulative graduates, 26,273 current participants. Training data: 40 hours per barista, 63% internal promotion rate, 49% total employee turnover
Multi-table format with sections for Compensation, SCAP, Training & Development, and Talent Attraction metrics with FY24 and FY23 comparison columns
Partner Experience Survey completion: 80% US store partners, 83% Canada, 91% North America non-store. Partner Networks: 39 globally, 13 in US, 127 active regional chapters. 26,392 individuals used civic engagement resources. Pay equity: 100% gender and racial pay equity in US for similar work, 96% gender median pay ratio, 100% racial median pay ratio
Tables covering Partner Engagement Surveys, Partner Networks, Civic Engagement, and Global Equity in Pay with detailed percentage breakdowns
LGBTQIA2+ representation: 35% retail, 17% enterprise, 10% manufacturing. HRC Corporate Equality Index: 100%. Disability inclusion: 14% retail, 11% enterprise/manufacturing. Disability Equality Index: 100%. Veterans & military: 2,500 hired in FY24 (goal: 5,000 annually). Link to Starbucks Fiscal 2024 Workforce Data with detailed demographics
Multiple tables showing representation percentages across workforce segments, external diversity index scores, and veteran hiring progress
Farmer Support: 10 centers, 36,628 people trained, 70 Model Farms. Climate-tolerant trees: 9,973,696 distributed in FY24, 56,810,680 seedlings cumulative, 6,271,613 seeds distributed (goal: 100M trees by 2025). Global Farmer Fund: $88.3M deployed cumulatively (goal: $100M by 2025), $73.3M since FY18. Digital traceability: 238,872 bags traced, 101,946 unique visitors. 13 childcare centers operated
Multiple tables covering Farmer Support Centers, Climate-Tolerant Coffee Trees, Global Farmer Fund, Supplier Lists (with links), Digital Traceability, and Childcare Centers
C.A.F.E. Practices: 99.75% coffee ethically sourced, 441,761 average farms participating. Carbon/Water in green coffee: 43,929 soil samples processed cumulative, 1,643 eco-wet mills contracted cumulative. Forest conservation: 298 hectares protected in FY24, 517 hectares restored, 313,306 native trees distributed. Tea: 99.95% Rainforest Alliance Certified. Cocoa: 25,593 metric tons Rainforest Alliance Certified segregated cocoa. Manufactured goods: 357 facility assessments, 1,468 suppliers, 95% transparency, 132,723 workers
Dense tables covering Ethical Sourcing, Carbon/Water Conservation, Forest Conservation, Tea/Cocoa Responsible Sourcing, and Manufactured Goods assessments
Sustainable Dairy: $2M invested in US Dairy Net Zero Initiative in FY24, $8M cumulative. Animal Welfare: 100% cage-free eggs (US, Canada, EMEA/UK), 100% antibiotic-free poultry (US), 100% group-housed pork (US/Canada). Suppliers: >$1.1B Tier 1 diverse supplier spend in FY24, >$11B cumulative since 2000, >8,650 jobs supported, $2B labor income impact. 17% of paid media investment with minority-owned companies
Multiple tables covering Sustainable Dairy Program investments, Animal Welfare metrics with 100% achievement indicators, and Diverse Supplier spend with economic impact data
Overall: $21.4M total grants in FY24. Disaster philanthropy: >$4.2M. Youth Grants: >800,000 youth impacted cumulative, $0.8M awarded. Origin Grants: >600,000 women/girls impacted cumulative (goal: 1M by 2030), $4M awarded, 8 countries reached. Neighborhood Grants: >13,000 grants cumulative (goal: 25,000 by 2030), >$5.3M awarded, >33,000 partner nominations. Global Community Impact: >270 grants cumulative, >$3.3M awarded, 46 markets reached
Comprehensive foundation grant tables organized by program type with cumulative totals, annual disbursements, and progress toward stated goals
Community Stores: 8 US opened (46 cumulative), 14 international (50 cumulative). Signing Stores: 6 opened (26 cumulative). Military Family Stores: 105 opened (238 cumulative including 93 licensed). Community Resilience Fund: $45.5M invested cumulative. FoodShare: 100% US/Canada stores, 11.9M lbs diverted (US), 9.9M meals (US), 1.4M lbs/meals (Canada), $16.5M invested in FY24, $89.1M cumulative since FY16 (goal: $100M by 2030)
Tables covering welcoming coffeehouse programs (Community, Signing, Military stores), Community Resilience Fund investments, and comprehensive Food Waste Reduction metrics
Community Champion Program: 16,523 partners engaged (US/Canada), 5,480 nonprofits supported, 169,712 volunteer hours. International: 34,466 partners engaged, 506 nonprofits supported, 335,438 volunteer hours. Giving Match Program: $2.2M donated by Starbucks to nonprofits through partner matching in FY24, up from $1.8M in FY23 (17% increase)
Two main tables showing Community Champion Program engagement metrics split between US/Canada and international markets, plus Giving Match financial data
Climate: 3% change in total emissions from FY19 baseline, -25% per revenue. Waste: 6% change to landfill from FY19 baseline, -23% per revenue (goal: 50% reduction by 2030). Water: -1% total withdrawal from FY19, -27% per revenue (goal: 50% conservation/replenishment by 2030). WASH: 343,089 people empowered cumulative, $2.1M invested. Packaging: 27% reusable/recyclable/compostable, 23% recycled materials, 8% change in virgin fossil fuels, 2.6% sold in reusable cups
Structured tables for each 2030 goal area (Climate, Waste, Water, Cups & Packaging) showing baseline comparisons, absolute and intensity metrics, and progress indicators
Greener Stores: 9,396 total verified globally (goal: 10,000 by 2025), 7,367 in North America, 2,029 in international regions. Renewable Electricity by company-owned facilities: 72% global, 100% US, 100% Canada, 100% EMEA, 100% Japan. Significant progress doubling Greener Stores from 6,091 (FY23) to 9,396 (FY24)
Two main tables: Greener Stores verification counts by region with year-over-year comparison, and Renewable Electricity percentage by market showing 100% achievement in multiple regions
Energy Consumption: 2,914,476 MWh total (FY24), 2,238,157 MWh purchased electricity (72% renewable), 676,320 MWh fuel consumed. GHG Emissions: Scope 1: 395,666 mtCO2e, Scope 2 market-based: 319,058 mtCO2e, Scope 2 location-based: 862,698 mtCO2e. Subtotal Scope 1+2: 714,723 mtCO2e. Includes FY19 baseline and FY23 data for comparison. Detailed footnotes on methodology, GWP values (IPCC AR4/AR5/AR6), third-party verification by Burns & McDonnell
Dense technical tables with three-year comparison (FY19, FY23, FY24), detailed energy and emissions breakdowns, extensive footnotes explaining calculation methodologies
Scope 3 breakdown by category: Cat 1 (Purchased goods/services): 7,847,195 mtCO2e (largest), Cat 2 (Capital goods): 169,524, Cat 4 (Upstream transport): 597,093, Cat 5 (Waste): 369,215, Cat 7 (Employee commuting): 633,228, Cat 9 (Downstream transport): 605,903, Cat 14 (Franchises): 1,368,198. Total Scope 3: 12,540,117 mtCO2e (94% of total). Total emissions (1+2+3): 13,254,840 mtCO2e. Green coffee: 12% of total, Dairy: 13% of total. Detailed footnotes on LUC emissions, category boundaries, licensee inclusion
Comprehensive Scope 3 table showing all 15 categories with individual values, subtotal, and total emissions calculation across three fiscal years
Dairy Methane (DMAA disclosure): 772,775 mtCO2e total agricultural dairy methane, broken down by source (Enteric fermentation: 459,757, Manure: 307,359, Feed: 5,659). 6% of Scope 3, 6% of Scope 1+3. Water Withdrawals: 500,826 megaliters total, Direct operations: 20,281 ML (37% from high-risk basins), Licensed stores: 21,690 ML (36% from high-risk basins), Packaging/agricultural commodities: 458,855 ML. -1% change from FY19 baseline. Operational Waste: 1,068 thousand metric tons total (79% direct operations, 21% licensed), 681 to landfill, 387 diverted (36% diversion rate)
Three major table sections covering Dairy Methane emissions aligned with DMAA framework, Water Withdrawals with WRI Aqueduct risk assessment, and Operational Waste with diversion breakdown
Total packaging: 383 thousand metric tons (50% reusable/recyclable/compostable). Company-operated stores: 322 MT, Licensed stores: 61 MT. Plastic packaging: 152 MT total, 139 MT virgin plastic (22% reusable/recyclable/compostable plastic, 3% post-consumer recycled). Customer facing packaging: 214 MT total (105 MT paper, 106 MT plastic, 2 MT other), 27% reusable/recyclable/compostable, 23% recycled materials/biobased, 8% change in virgin fossil fuels from FY19. Detailed footnotes on Ellen MacArthur Foundation Global Commitment alignment, recyclability assessment methodology
Multiple detailed packaging tables breaking down by material type, customer-facing vs. operational, virgin vs. recycled content, with extensive footnotes on scope and methodology
C.A.F.E. Practices Zero-Tolerance Indicators: Total 178 nonconformities in FY24 (down from 269 in FY23). Breakdown: Wage practices (65), Traceability (27), Child labor (56), Labor intermediaries (4), Transparency (4), Banned pesticides (19), Forced labor/abuse (2), Deforestation (1). Remediation: 84% of FY23 nonconformities closed by FYE, 37% of FY24 closed by FYE. Explanatory note on 440,000+ farms, multiple nonconformities per location possible, seasonal closure timing, Non-Compliant designation for unresolved indicators
Detailed table showing zero-tolerance indicator categories with counts for two fiscal years, plus remediation rates and comprehensive explanatory paragraph
Manufactured Goods & Services Zero-Tolerance Indicators: Total 52 nonconformities in FY24 (up from 36 in FY23). Breakdown: Wage practices (32), Transparency (11), Access denial for audits (3), Health/safety endangerment (1), Child labor (3), Abuse/harassment (1), Continuous improvement (1). No forced labor or environmental nonconformities in FY24. Remediation: 75% of FY23 closed by FYE, 69% of FY24 closed by FYE. Program covers beverages, food, merchandise, equipment, furniture, logistics across 1,468 suppliers, 357 assessments, 132,723 workers. Commitment to continuous improvement cornerstone of program
Similar table structure to coffee supply chain with nonconformity categories, counts, remediation rates, and explanatory paragraph on program scope
Report scope: FY24 (Oct 2, 2023 - Sep 29, 2024). References SASB, IFRS Sustainability Disclosure Standards, TCFD, GRI. Aligned with UN SDGs. Notes that 'priority' or 'relevant' don't equal SEC materiality. Previous reports available since 2001. Management responsible for integrity, internal controls, external verification by Moss Adams and Burns & McDonnell
Multi-section text page with clear headers for Scope, Reporting Year, Currency, Previous Reports, Information Integrity, Stay Up-to-Date
Legal disclaimer explaining forward-looking statements under securities law. Lists extensive risk factors including brand preservation, consumer preferences, operating expenses, business execution, partner investments, supply chain, economic conditions, geopolitical risks, food safety, information security, ESG efforts, competition, tax law, health events, legal proceedings
Dense legal text organized with bullet points, clear heading, disclaimer language
Required California climate disclosure covering: Climate Targets (SBTi-validated 1.5°C pathway, carbon neutral green coffee goal, GHG inventory verification), Entity/Product Statements (regenerative agriculture emissions reduction, innovative business models, store design/operations efficiency, Greener Stores verification, renewable energy infrastructure)
Two-column format with disclosure requirements left, Starbucks responses right
Section divider introducing third-party verification letters from Burns & McDonnell (environmental metrics) and Moss Adams LLP (social metrics). Demonstrates independent assurance of reported data integrity
Clean layout with Fiscal 2024 badge, title, two verification provider links with navigation arrows
Algengar spurningar um þessa glæru og undirliggjandi kynningarefni.
The report covers Starbucks fiscal year 2024, which runs from October 2, 2023 through September 29, 2024. This is Starbucks' 25th year of publishing an annual global impact report, demonstrating a long-standing commitment to transparency in sustainability and social responsibility reporting.
Starbucks has set ambitious 2030 goals using FY19 as baseline: 50% reduction in GHG emissions (Scope 1, 2, 3), 50% reduction in waste sent to landfill, 50% water conservation/replenishment, 100% customer packaging reusable/recyclable/compostable, 50% recycled materials in packaging, and 50% reduction in virgin fossil fuels for packaging. Current FY24 progress shows 3% emissions change (on track per revenue), 72% global renewable electricity, -1% water withdrawal change, 27% sustainable packaging, and 9,396 Greener Stores verified globally.
SCAP is an industry-leading benefit providing 100% tuition coverage for U.S. partners to earn a first-time bachelor's degree from Arizona State University. In FY24, Starbucks celebrated 10 years of SCAP. Results include: more than 14,000 partners graduated, over 26,000 partners currently participating, nearly 90% of U.S. stores have at least one partner in the program, and over 20% of SCAP scholars are first-generation college students. This demonstrates Starbucks' commitment to economic opportunity beyond hourly wages.
Coffee and Farmer Equity (C.A.F.E.) Practices is Starbucks' ethical sourcing program developed 20 years ago with Conservation International. It's one of the coffee industry's first ethical sourcing standards, verifying farms across economic transparency, social responsibility, environmental leadership, and quality. In FY24, 99.75% of Starbucks coffee was ethically sourced and verified through C.A.F.E. Practices, representing more than 440,000 coffee farms across 26+ origins globally.
In FY24, The Starbucks Foundation awarded $21.4 million in total grants across multiple programs. This includes Origin Grants ($4 million supporting women and girls in coffee/tea/cocoa communities), Neighborhood Grants (over $5.3 million to 13,000+ North America nonprofits nominated by partners), and Global Community Impact Grants ($3.3 million across 46 international markets). The Foundation has supported over 600,000 women and girls cumulatively and is on track to reach 1 million by 2030.
Starbucks offers industry-leading benefits to both part-time and full-time U.S. partners. Key benefits include: average hourly wage of $18.73 (comprehensive package averages $30/hour when benefits included), 100% of hourly partners earn above minimum wage, comprehensive healthcare, paid parental leave, 100% tuition coverage through SCAP, Bean Stock equity awards ($2.4B+ in pre-tax gains to date), mental health support, student loan debt assistance, and family expansion assistance. The benefits package ranks higher than 50+ Fortune 200 and 500 companies according to Aon's Benefit Index analysis.
Starbucks' FoodShare program is available in 100% of U.S. and Canada company-owned stores, allowing partners to donate unsold food to hunger relief organizations. In FY24, the program diverted 11.9 million pounds of food in the U.S. (9.9 million meals) and 1.4 million pounds in Canada (1.4 million meals). Starbucks invested $16.5 million in hunger relief in FY24 and has invested $89.1 million cumulatively since FY16, on track to meet the $100 million by 2030 goal. The tax benefit from donations is reinvested into Capacity Building Grants to help food banks improve infrastructure.
As of FY24, Starbucks has verified 9,396 Greener Stores globally across 59 markets (7,367 in North America and 2,029 internationally), nearly doubling reach in the past year. This puts the company on track to meet the 10,000 Greener Stores goal by 2025. Greener Stores are third-party verified by SCS Global Services across eight environmental impact areas: waste diversion, water stewardship, energy efficiency, renewable energy, responsible materials, engagement, sites, and community health and wellbeing. Features include energy-efficient equipment, water-saving faucets, and low-chemical paints/coatings.

Create Your Own Slides
Turn your ideas into professional presentations in seconds with 2slides AI.
Sæktu innblástur í faglega hönnun, veldu þinn stíl og búðu til glærur með fullkominni textabirtingu. Knúið af Nano Banana—byrjaðu að búa til kynninguna þína núna.
Þinn AI-þjónn fyrir glærur. Sparaðu tíma, skín hraðar með snjallri kynningargerð.




© 2026 2slides. Allur réttur áskilinn.