
Hluti af safninu Dæmi um fjárfestakynningar
Schneider Electric Q1 2024 Financial Results - Quarterly Earnings Presentation
Flýtileiðsögn
Merki
Deila glærunum
Schneider Electric Q1 2024 Financial Results - Quarterly Earnings Presentation
Ítarleg sýn á hverja glærusíðu, þar á meðal útlit, lykilefni og sjónræna þætti.
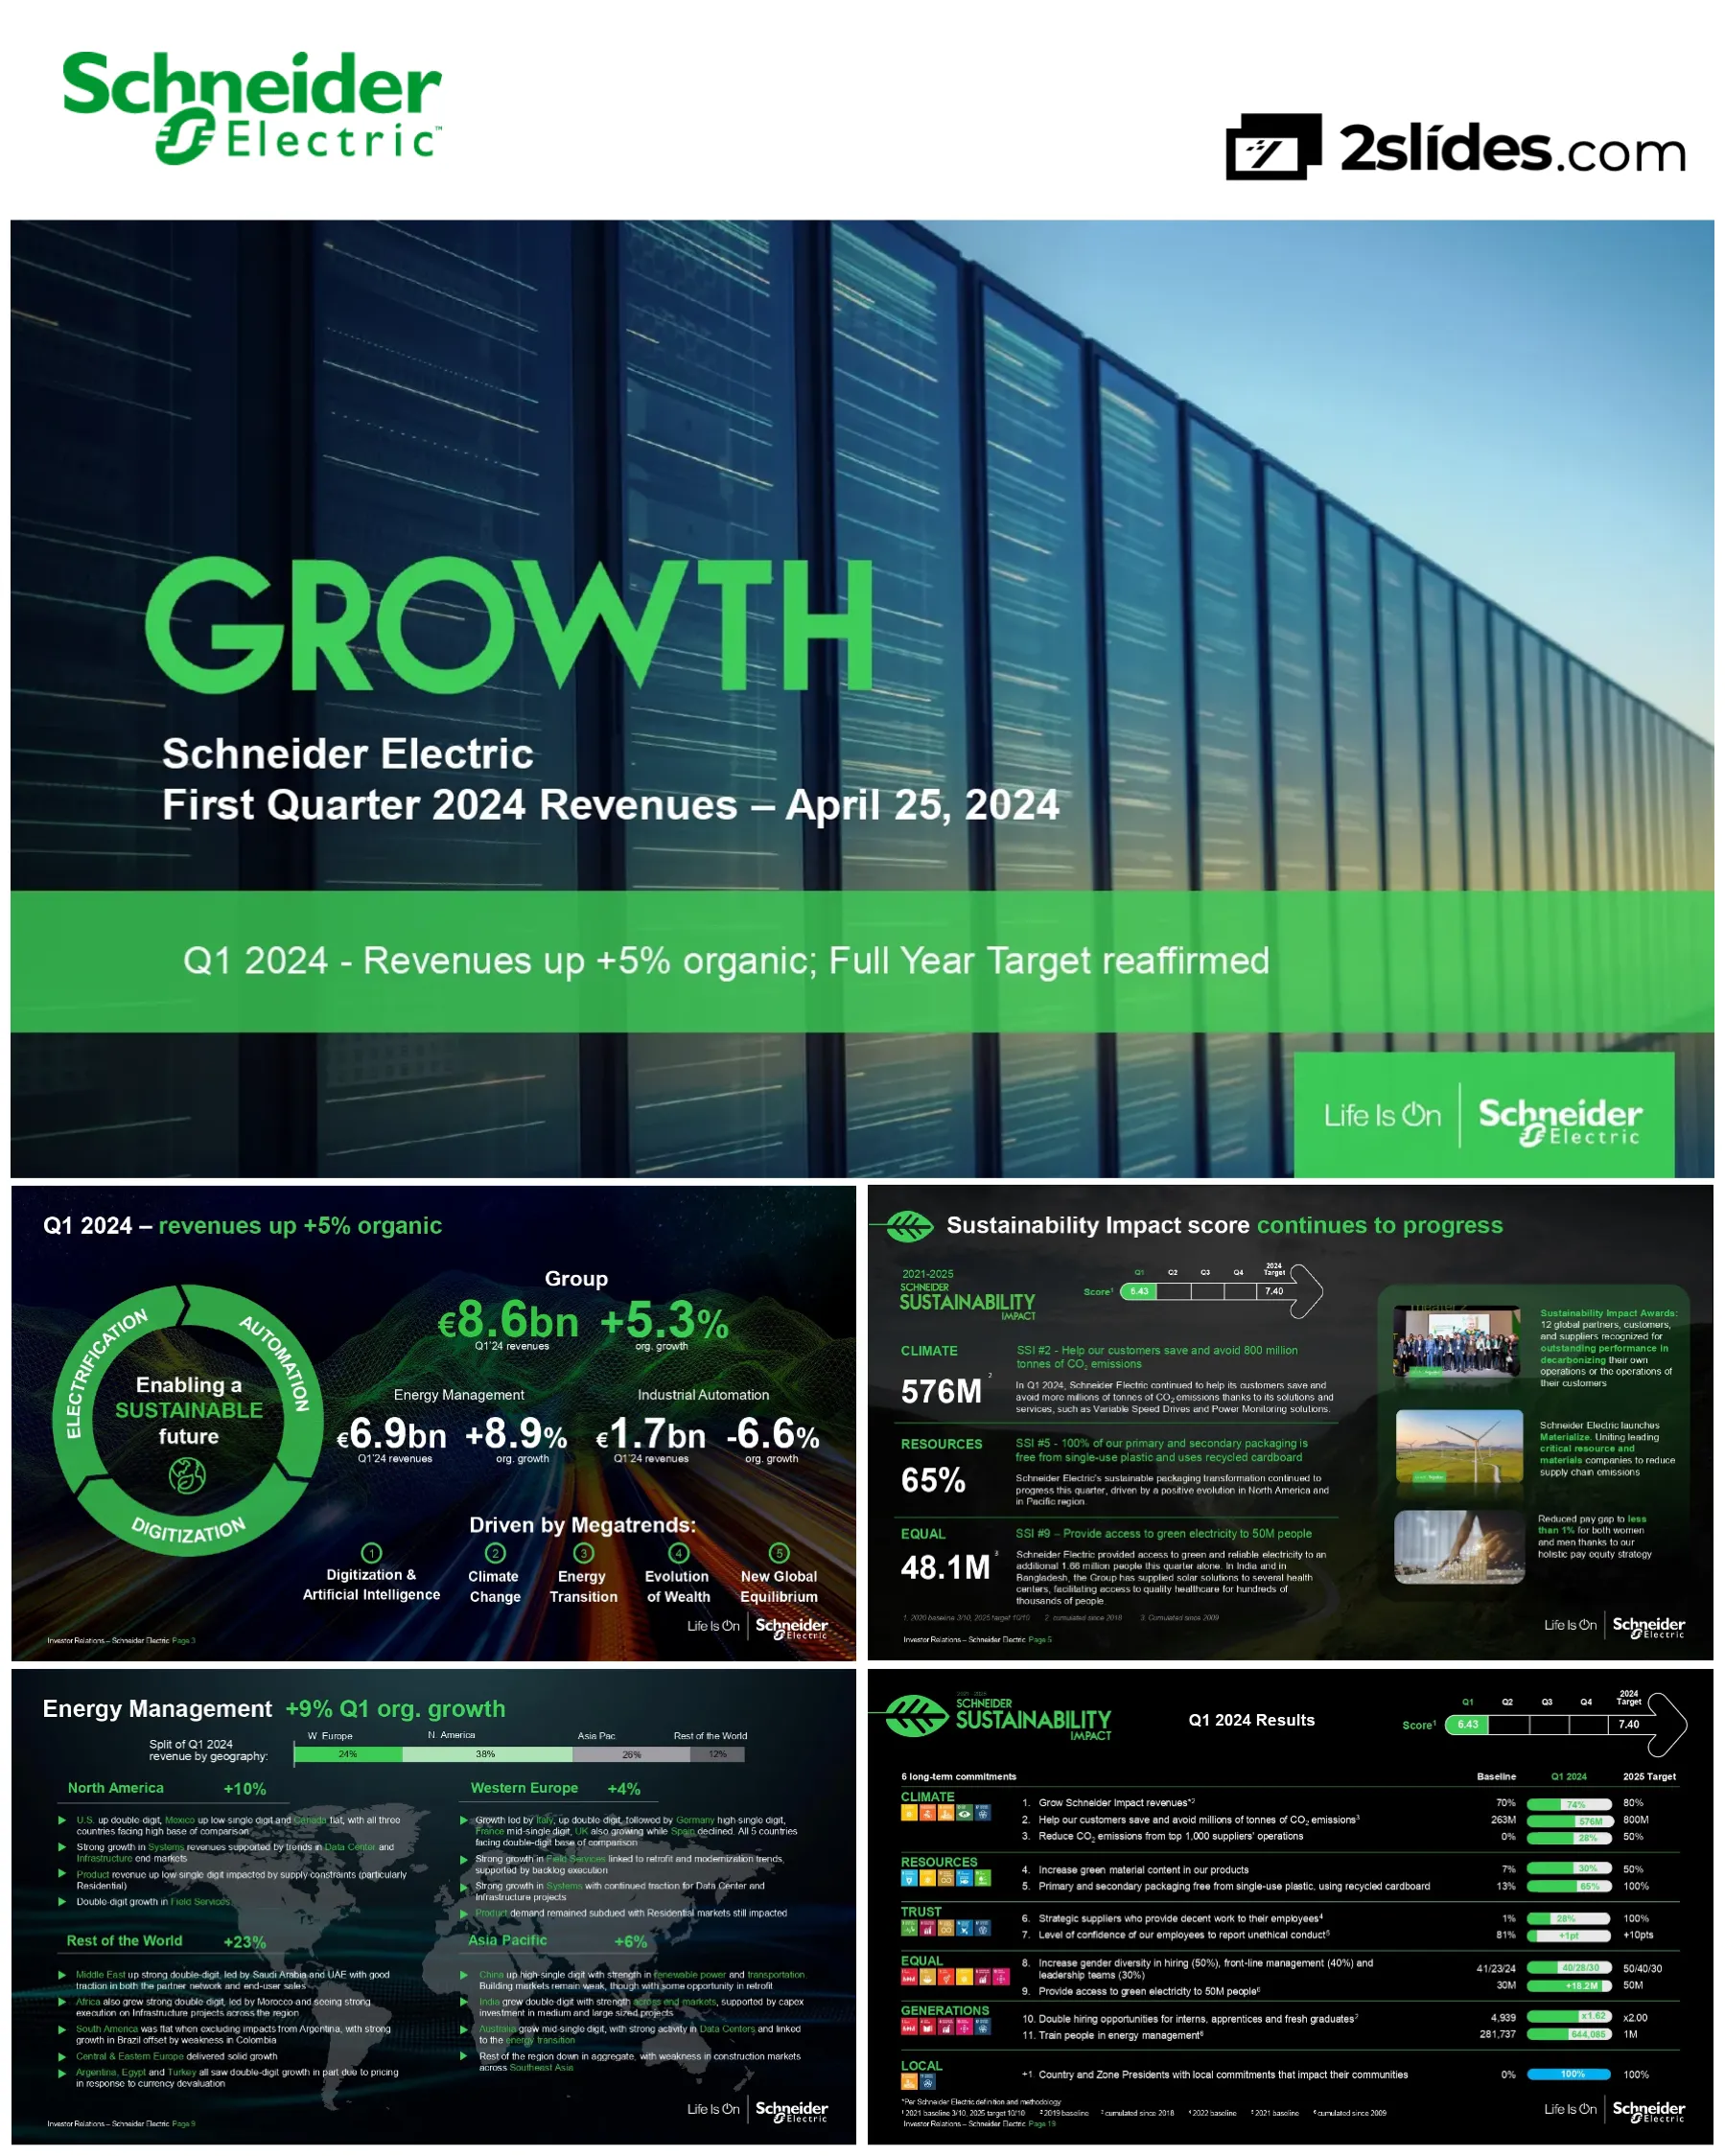
Title slide announcing Q1 2024 revenues up +5% organic with full year target reaffirmed, dated April 25, 2024. Features 'GROWTH' as the dominant visual theme with server/data center imagery
Large 'GROWTH' typography overlaid on technology infrastructure background (server racks), green banner at bottom with key messaging, Schneider Electric logo and 'Life Is On' tagline in corner
Standard forward-looking statements disclaimer covering risk factors, market information sources, and limitations of third-party data verification
Two paragraph text blocks on dark background with subtle technology imagery, standard legal disclaimer formatting
Group revenues of €8.6bn with +5.3% organic growth. Energy Management €6.9bn (+8.9%), Industrial Automation €1.7bn (-6.6%). Visual representation of sustainability strategy with electrification, automation, and digitization cycle, plus five megatrends driving growth
Split layout with circular sustainability diagram on left, financial metrics on right, megatrends listed at bottom
Breakdown showing Products (+2%, 53% of revenue), Systems (+14%, 28%), and Software & Services (+5%, 19%). Details on Energy Management stabilization, Systems demand in Data Centers, AVEVA ARR growth, and Field Services expansion
Three-column layout with category headers, growth percentages, and detailed bullet points for each segment
Q1 2024 Sustainability Impact Score of 6.43 (target 7.40). Key metrics: 576M tonnes CO2 saved, 65% sustainable packaging, 48.1M people with green electricity access. Features Sustainability Impact Awards, Materialize initiative, and pay equity achievement
Progress bar at top, three main pillars (Climate, Resources, Equal) with metrics and supporting images on right side
Four customer case studies across sectors: Digital Realty (Data Center, France) with -31% emissions reduction, Provis (Buildings, UAE) with Ecofit solutions, Large Water Utility (Infrastructure, Australia) managing 1.5B liters daily, and UltraTech (Industry, India) with smart manufacturing solutions
Four-column grid layout with company logos, sector labels, and key metrics for each case study, overlaid on infrastructure background
Waterfall chart showing Q1 2023 (€8,493m) to Q1 2024 (€8,606m) progression. Regional organic growth: Western Europe -1.5%, Asia Pacific +4.0%, North America +7.1%, Rest of World +19.5%. Scope impact -2.6% (industrial sensors divestiture), Forex -1.2%
Horizontal waterfall chart with annotated bars showing positive and negative contributions, explanatory callout boxes
Performance across four end markets: Buildings (residential stable, non-residential strong), Data Center & Networks (very strong demand, up strong double-digit), Infrastructure (strong electrical utilities, stable transportation), Industry (discrete down YoY but improving, Process & Hybrid up mid-single digit)
Venn diagram at top showing Energy Management and Industrial Automation overlap, four-column grid below with detailed bullets per end market
Energy Management +9% organic growth breakdown by region. North America +10% (US double-digit, strong Systems and Field Services), Western Europe +4% (Italy leading, strong Field Services), Asia Pacific +6% (China high-single digit in renewables), Rest of World +23% (Middle East and Africa strong double-digit)
World map with four regional callout sections, revenue distribution bar at top showing geographic split (24% W. Europe, 38% N. America, 26% Asia Pac, 12% RoW)
Industrial Automation -7% organic decline breakdown. North America -10% (AVEVA timing impact, Discrete pressure), Western Europe -16% (Germany, Italy down double-digit, weak Discrete markets), Asia Pacific -3% (China returns to growth, Japan/Korea weak), Rest of World +10% (Middle East strong, Process growth in Africa)
World map with four regional callout sections, revenue distribution bar showing geographic split (28% W. Europe, 22% N. America, 33% Asia Pac, 17% RoW)
Five key trends: (1) Strong market demand driven by megatrends, (2) Strong Systems demand in Data Centers/Infrastructure, (3) Software subscription transition and Services growth, (4) Gradual Product demand recovery weighted to H2, (5) All regions contributing with US, India, Middle East leading
Five bullet points on dark gradient background with purple/blue color scheme, clean typography
Full year 2024 target: Adjusted EBITA growth +8% to +12% organic, achieved through revenue growth +6% to +8% organic and EBITA margin improvement +40bps to +60bps organic. Implies adjusted EBITA margin of 18.0% to 18.2% including scope and FX
Large centered box with main target, supporting details below in bullet format
Four priorities in order: (1) Strong Investment Grade Credit Ratings, (2) Continued focus on Progressive Dividends, (3) Funding Organic Growth, (4) Portfolio evolution/Share Buyback
Four numbered boxes arranged in priority flow (1-2-3-4) with arrows showing sequence
Simple transition slide indicating Q&A session
Large 'Q&A' typography on dark background with abstract wave pattern
IR team contacts (Graham Phillips, Amit Bhalla, Andrew Gamwell, David Le Goascoz, Lorna Scrimshaw) and upcoming events calendar including Q1 revenues (Apr 25), Shareholders Meeting (May 23), various CEO conferences, H1 results (Jul 31), Q3 revenues (Oct 30), and upcoming India investor event in Q4 2024
Two-column layout with events calendar on left, contact information on right
Section divider introducing appendix materials
Large 'Appendix' typography overlaid on aerial nature photography (forest and river)
Detailed assumptions for 2024: FX impact -€200M to -€300M on revenues, -30bps on EBITA margin; Scope impact -€300M revenue, flat on margin; Restructuring costs decreasing toward €100M target; Tax rate 22-24% range
Four bulleted sections with green headers and detailed explanatory text, footnote at bottom
Display of Q1 2024 awards and recognitions including Global 100 Most Sustainable Corporation, Top 100 for Gender Equality, iF Design Award 2024, World Economic Forum participation, Dow Jones Sustainability Indices, EcoVadis Platinum, Sustainable Product of the Year, CDP disclosure, World's Most Ethical Companies (13-time honoree), FTSE4Good, LinkedIn Top Companies UAE, Carbon Clean 200
Grid layout displaying 12 different award badges and certifications with company branding
Detailed Q1 2024 results for 11 sustainability impact metrics across 6 themes (Climate, Resources, Trust, Equal, Generations, Local). Overall score 6.43 vs. 7.40 target. Notable results: 74% Schneider Impact revenues, 576M CO2 tonnes saved, 65% sustainable packaging, 40/28/30 gender diversity, 644,085 trained in energy management
Comprehensive scorecard with category icons on left, metrics descriptions in center, baseline/Q1 2024/target progression bars on right
Standard closing slide with se.com website reference, Schneider Electric logo and Life Is On tagline, copyright notice and trademark information
Full-screen green background with centered white logo and text, copyright information at bottom
Algengar spurningar um þessa glæru og undirliggjandi kynningarefni.
Schneider Electric reported Q1 2024 revenues of €8.6 billion with organic growth of +5.3%. The company reaffirmed its full-year 2024 guidance of +6% to +8% organic revenue growth and adjusted EBITA growth of +8% to +12% organic. Energy Management performed strongly at +8.9% organic growth (€6.9bn revenue), while Industrial Automation faced headwinds at -6.6% organic growth (€1.7bn revenue). Systems led growth at +14%, followed by Software & Services at +5%, and Products at +2%.
Data Centers were the strongest end market with very strong double-digit growth driven by demand from both Internet Giants and enterprise settings. Geographically, Rest of World led with +19.5% growth (Middle East and Africa particularly strong), followed by North America at +7.1% (US double-digit growth), Asia Pacific at +4.0% (China returning to growth), while Western Europe declined -1.5% (though Italy grew double-digit). Infrastructure markets showed strength in electrical utilities, while Buildings markets showed regional variance with renovation/retrofit trends providing support.
Industrial Automation faced continued weakness in discrete automation markets, particularly in Western Europe and East Asia, due to high OEM inventory levels. Western Europe was down -16% and North America -10%, partly impacted by timing of AVEVA renewals. However, Process & Hybrid markets showed resilience with mid-single digit growth. In contrast, Energy Management benefited from strong Systems demand in Data Centers and Infrastructure, consumer-linked segments stabilizing, and double-digit Field Services growth. The divergence reflects different end-market dynamics and inventory cycles.
Schneider Electric tracks an overall Sustainability Impact Score, which reached 6.43 in Q1 2024 (vs. 7.40 target for 2024). The company has helped customers save 576 million tonnes of CO2 emissions (target: 800M by 2025), achieved 74% Schneider Impact revenues (target: 80%), reached 65% sustainable packaging (target: 100%), and provided 48.1 million people access to green electricity (target: 50M). The company has achieved gender diversity of 40/28/30 (hiring/frontline management/leadership) and trained 644,085 people in energy management. Schneider Electric was recognized as a Global 100 Most Sustainable Corporation and received numerous ESG awards in Q1 2024.
Schneider Electric's strategy is built around five megatrends: (1) Digitization & Artificial Intelligence - driving data center demand and digital transformation, (2) Climate Change - accelerating decarbonization efforts and sustainable solutions, (3) Energy Transition - creating demand for renewable energy integration and grid modernization, (4) Evolution of Wealth - expanding middle class and infrastructure needs, and (5) New Global Equilibrium - reshoring, supply chain diversification, and regional manufacturing. These megatrends support their positioning in electrification, automation, and digitization, enabling a sustainable future.
For FY 2024, Schneider Electric estimates FX headwinds of -€200M to -€300M on revenues based on current rates, with approximately -30bps impact on adjusted EBITA margin, driven by weakening of the US Dollar, Chinese Yuan, Turkish Lira, and Argentinian Peso versus the Euro. Scope impact (primarily the divestiture of industrial sensors business) is expected at around -€300M on revenues but approximately flat on adjusted EBITA margin. Despite these headwinds, the company reaffirmed its organic growth targets of +6% to +8% revenue and +8% to +12% adjusted EBITA growth.
Schneider Electric follows a clear capital allocation hierarchy: (1) Strong Investment Grade Credit Ratings as the top priority, (2) Continued focus on Progressive Dividends, (3) Funding Organic Growth, and (4) Portfolio evolution/Share Buyback. This prioritization demonstrates commitment to financial stability, shareholder returns through consistent dividend growth, reinvestment in high-growth opportunities (particularly in Data Centers, Infrastructure, and Software/Services), and disciplined M&A and capital returns.
Schneider Electric showcased four compelling customer cases in Q1 2024: (1) Digital Realty (France Data Center) achieved -31% Scope 1&2 emissions reduction between 2022-2023 through energy efficiency focus, (2) Provis in UAE (Buildings) saved 7.9 metric tons of material, 27.9t CO2eq, and 267.4m³ water through Ecofit solutions, (3) A Large Water Utility in Australia manages 1.5 billion liters of safe drinking water daily using Schneider's sustainable solutions, and (4) UltraTech in India (Smart Manufacturing) implemented fully integrated Plant to Enterprise Operations across 10 plants with cutting-edge digitization for sustainability targets and performance improvement.

Create Your Own Slides
Turn your ideas into professional presentations in seconds with 2slides AI.
Sæktu innblástur í faglega hönnun, veldu þinn stíl og búðu til glærur með fullkominni textabirtingu. Knúið af Nano Banana—byrjaðu að búa til kynninguna þína núna.
Þinn AI-þjónn fyrir glærur. Sparaðu tíma, skín hraðar með snjallri kynningargerð.




© 2026 2slides. Allur réttur áskilinn.