
Hluti af safninu Dæmi um ráðgjafakynningar
Roland Berger Trend Compendium 2050, Megatrend 1: People & Society (2026 Edition), a 79-page consulting research deck from the Roland Berger Institute covering population, migration, education and labor, and values and culture through 2050
Notar forsíðu þessarar kynningar sem stílfyrirmynd fyrir glærur úr þínu eigin efni. Eða veldu hvaða síðu sem er hér fyrir neðan og notaðu uppsetningu hennar sem fyrirmynd.
Flýtileiðsögn
Merki
Deila glærunum
Roland Berger Trend Compendium 2050, Megatrend 1: People & Society (2026 Edition), a 79-page consulting research deck from the Roland Berger Institute covering population, migration, education and labor, and values and culture through 2050
Ítarleg sýn á hverja glærusíðu, þar á meðal útlit, lykilefni og sjónræna þætti.
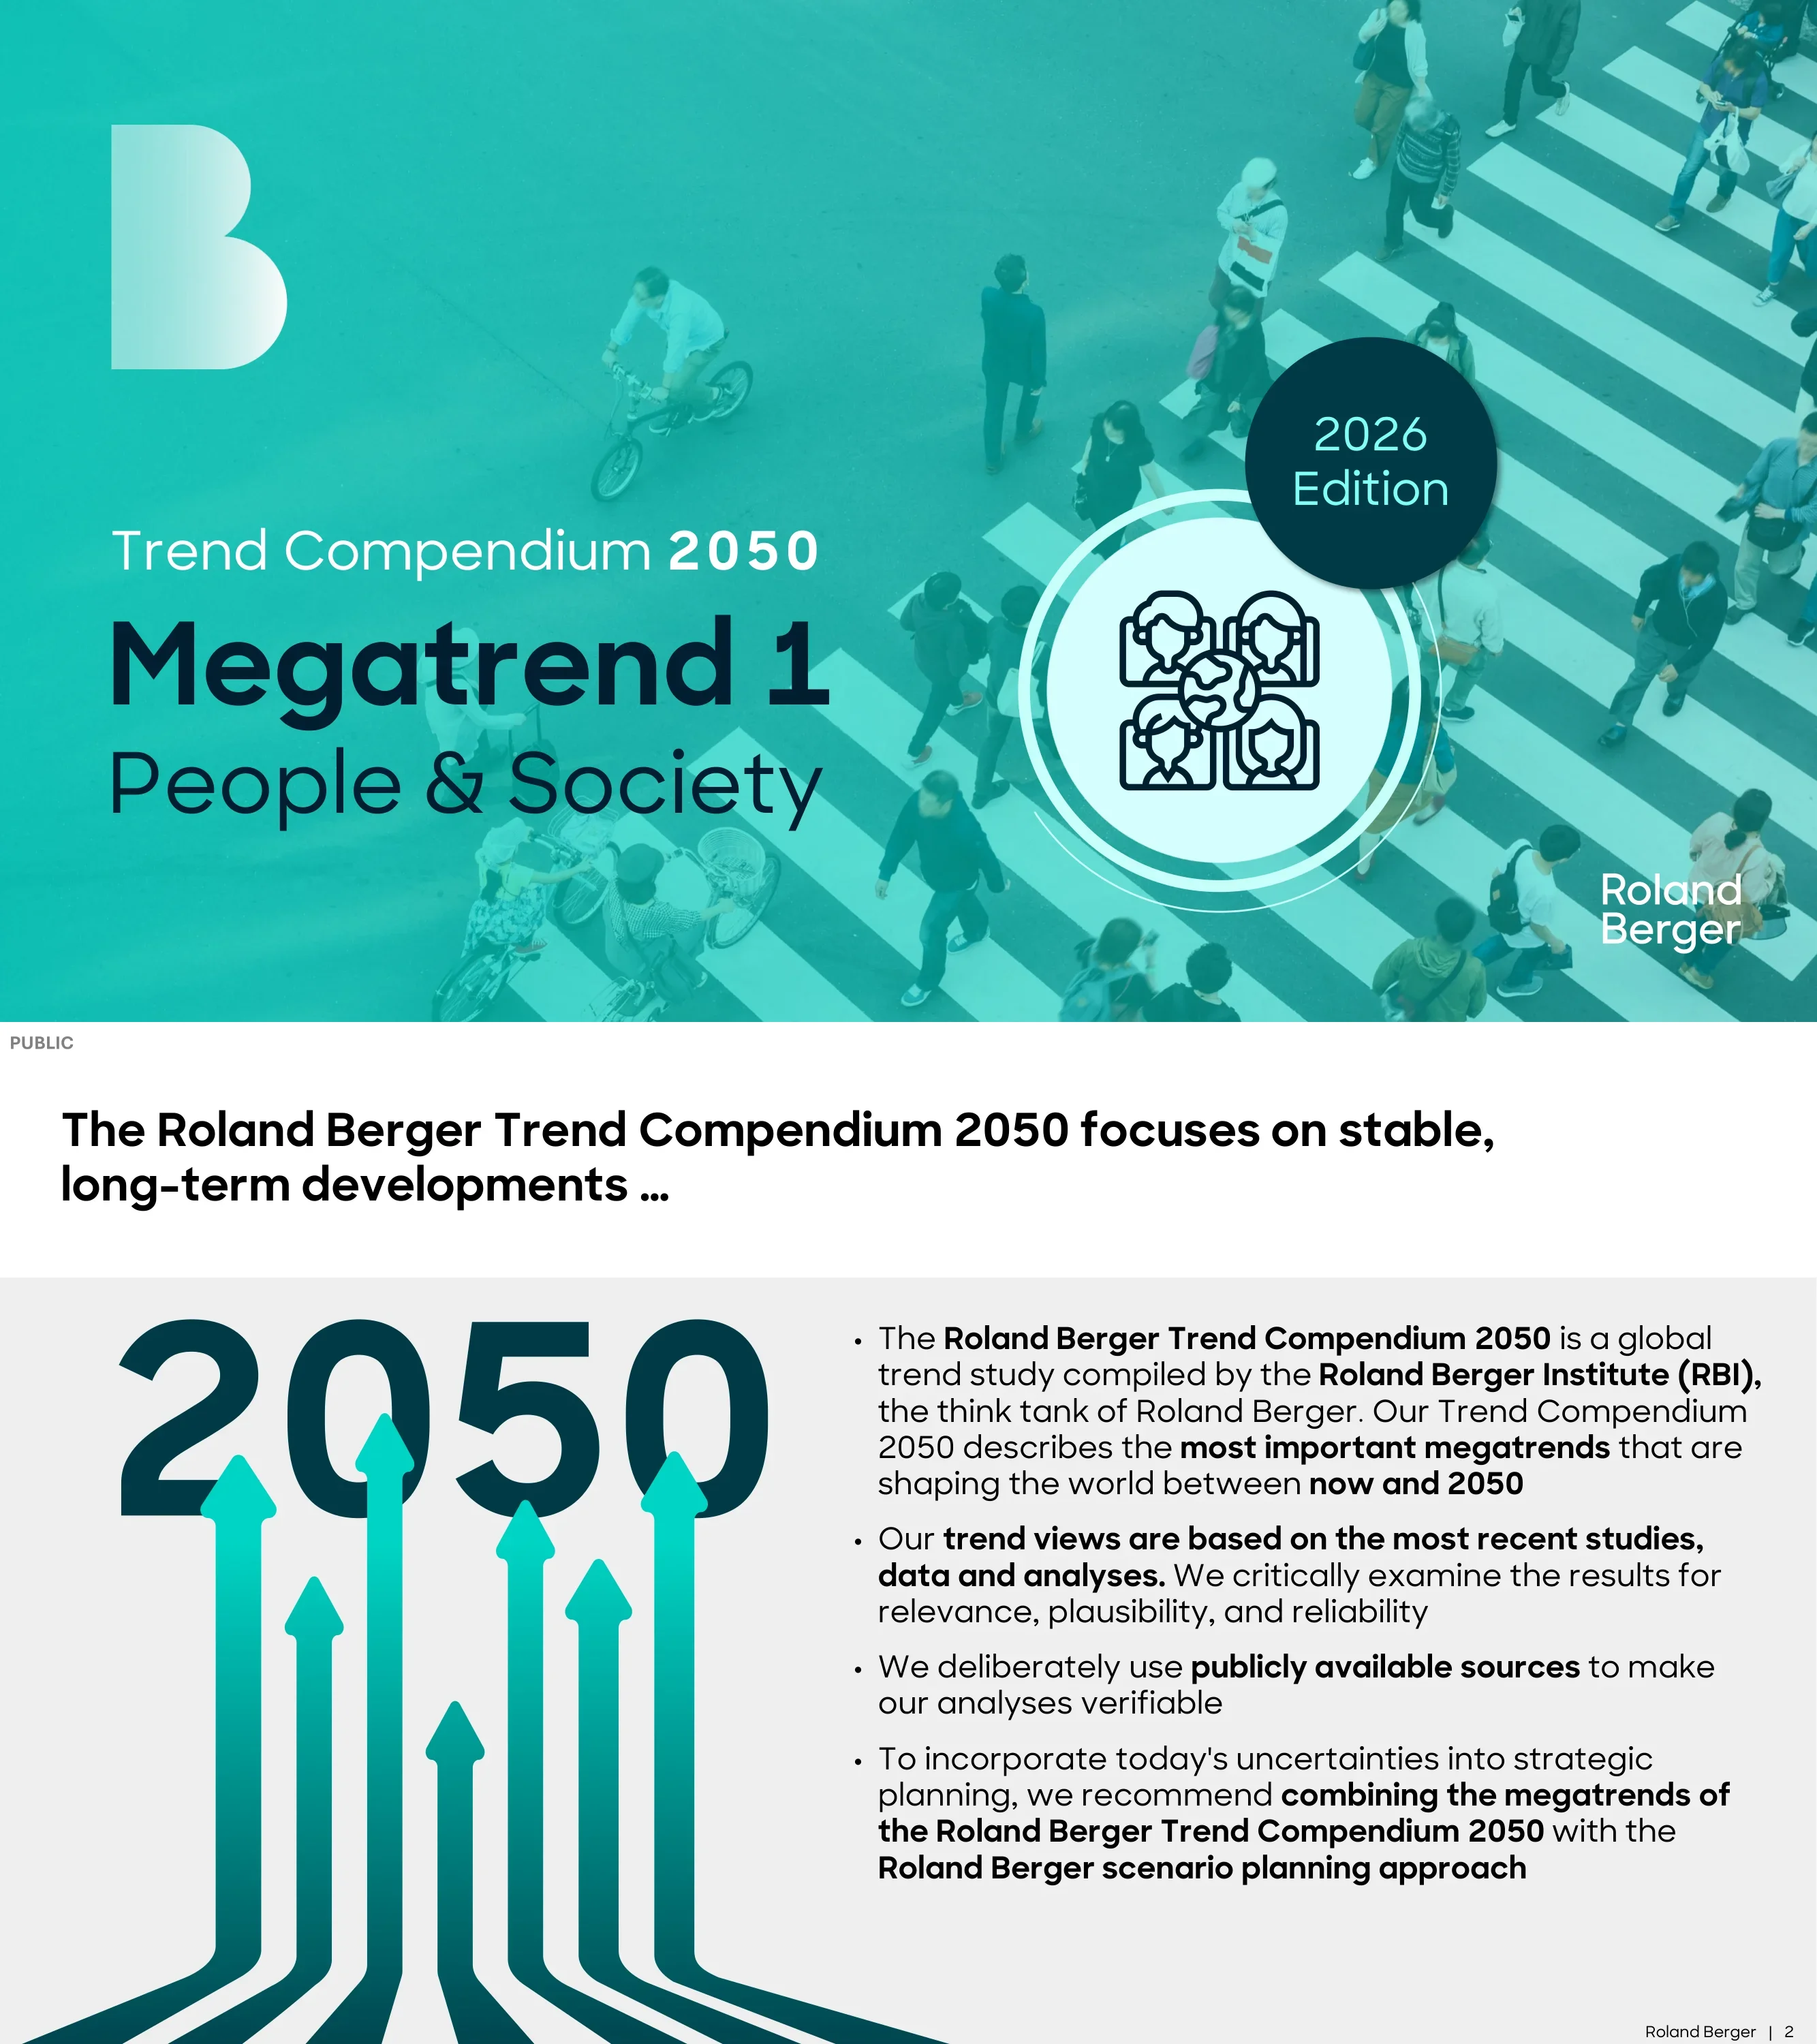
Cover slide naming the Trend Compendium 2050, Megatrend 1 People & Society, with a 2026 Edition badge.
Full-bleed teal-tinted photo of a crosswalk with the title at left and a circular icon badge at right
Explains that the compendium is a global trend study by the Roland Berger Institute (RBI), based on recent public studies and data and meant to be combined with Roland Berger's scenario planning approach.
Large typographic 2050 with rising arrows at left and four bullets at right
Overview of the seven megatrends (People & Society; Politics & Governance; Energy & Resources; Environment & Sustainability; Economics & Business; Technology & Innovation; Health & Care) and their subtrends, with megatrend 1 highlighted.
Seven numbered columns, each with a colored icon circle and a stacked list of subtrends
Introduces the four subtrends: 1.1 Population, 1.2 Migration, 1.3 Education & Labor and 1.4 Values & Culture.
Left navigation rail plus four large numbered icon circles
Headline facts: 1.4 billion more people by 2050 (8.2bn to 9.6bn), Sub-Saharan Africa's population almost doubling, nearly 1.6 billion people over 65 and 2.6 million aged 100+, India at about 1.68 billion in 2050, and median ages from 21.2 (Niger) to 56.7 (South Korea).
Cluster of overlapping fact bubbles in teal and navy
World population rises from 2.5bn (1950) to 8.2bn (2025) and 9.6bn (2050), peaks at 10.29bn in 2086 and falls to 10.19bn by 2100; in 2050, 87% live in less developed regions and 67% in urban areas, the fertility rate falls from 2.24 to 2.10 and life expectancy rises from 73.5 to 77.0.
Line chart at left, four pie charts in the middle, commentary column at right
Between 2025 and 2050 more developed regions shrink from 1.29bn to 1.27bn (-1.0%), less developed regions grow from 5.71bn to 6.44bn (+12.8%) and least developed countries grow from 1.20bn to 1.93bn (+60.9%); over 75% of LDC populations live in poverty.
Three paired bar charts (2025 vs 2050) with percentage-change bubbles and a commentary column
Fertility falls from 4.38 to 2.95 in low-income and from 2.51 to 2.17 in lower-middle-income countries, and edges up from about 1.5 to 1.6 in upper-middle- and high-income countries; the number of countries below replacement rises from 134 to 167, and the slide's callout puts it at 169 by 2050, 94 of them high-income; drivers are contraception, lower child mortality, women's empowerment and changing family attitudes.
Arrow indicators and a stacked bar at left, a grey panel of four driver icons at right, and a boxed key takeaway
India +220.3m (+15%), Nigeria +121.9m (+52%) and Pakistan +116.4m (+46%) lead growth, while China (-152.3m, -11%), Japan (-18.0m, -15%) and Russia (-8.1m, -6%) shrink the most; also shown are the USA (+34.0m), Germany (-6m) and Italy (-7.2m).
World map with labeled country callouts and a commentary column
Four chances (larger human capital pool, market expansion, preventing political paralysis, easing budget pressures) set against four challenges (strain on public health, worsening poverty, conflicts over distribution, environmental damage).
Two-row 4x2 grid labeled Chances (+) and Challenges (-), with icons
Population by continent from 2025 to 2050: Asia 4,821m to 5,278m (+9%), Africa 1,532m to 2,448m (+60%), Europe 745m to 704m (-5%), LatAm 666m to 730m, Northern America 386m to 426m, Oceania 46m to 57m (+24%); India (1,668m) and China (1,266m) top Asia's 2050 list and Nigeria (357m) tops Africa's.
Stacked columns at left and a table of the top five countries per region at right
Population pyramids for 2025 and 2050 for the world and six regions show aging everywhere: Africa stays the youngest, Europe stays the oldest, and Latin America shows the most notable shift from young to old.
Large world pyramid with six small-multiple regional pyramids and a commentary column
Generation sizes for 2025 and 2050 (e.g. Gen Z 2,039m to 1,946m, Gen Beta 129m to 1,931m, Baby Boomers 974m to 180m) and workforce shares (Gen Z 38% in 2025, Gen Beta 23% by 2050); up to seven generations will coexist around 2035.
Clustered column chart above a workforce-share table, with a commentary column
The world's 65+ share rises from 10.0% to 16.0% and the median age from 30.9 to 36.1; more developed regions reach a median age of 45.1 and life expectancy of 83.9, less developed regions 34.8 and 75.9; there were 857 million people aged 65+ in 2025, doubling to 1.6 billion.
Three groups of 100% stacked bars with a metrics table underneath (median age, fertility, life expectancy)
Old-age support ratios fall from 2025 to 2050 in every region: Europe 2.8 to 1.9, Northern America 3.1 to 2.4, Asia 5.8 to 3.1, Latin America 5.9 to 3.1, Africa 12.7 to 9.2; Europe's median age rises to 46.2.
World map background with six regional mini-charts of median age bars and pictogram support ratios
Prospective normal retirement ages range from 74 in Denmark and 70-71 in Estonia, Italy and the Netherlands to 62 in Saudi Arabia and 58 in India; the OECD average rises from 64.7 to 66.4 years for men.
Stacked columns (current plus increase) for 16 countries with a commentary column
Urban share rises from 57.8% to 67.3% globally; Africa gains +13.3pp (46.4% to 59.7%), Asia +11.0pp (53.6% to 64.6%), and Northern America reaches 86.6% and Latin America 87.6%.
Six regional tiles with city-skyline icons and percentage-point change badges
Urbanization in 2050 (2025) for selected countries, e.g. Japan 96.0% (92.3), China 89.7% (66.3), India 43.1% (35.7), Nigeria 83.4% (63.8), Niger 33.8% (18.4) and USA 86.5% (80.2).
Six regional panels with skyscraper graphics labeled by country values
Cities of 50k-1m grow from 1.85bn to 2.42bn (+31.1%), cities of 1-10m from 1.22bn to 1.49bn (+22.6%) and megacities above 10m from 0.63bn to 0.76bn (+22.1%), while world population grows 17.7%; people in cities above 50k grow 26.8% to about 4.7bn.
Row-based flow diagram from 2025 to 2050 values by city size class
Jakarta (41.9m to 51.8m) and Dhaka (36.6m to 52.1m) lead the 20 biggest agglomerations; megacities grew from 8 in 1975 to 33 in 2025, and Tokyo declines from 33.4m to 30.7m.
World map with city pins and 2025/2050 labels, a callout box and a commentary column
Chances and challenges of megacities across five dimensions; for example cities generate over 80% of global GDP but face high living costs, overstretched services, pollution, inequality and administrative complexity.
Five-column matrix (economic, infrastructure, environmental, social, governance) with chance and challenge rows
Nine driver dimensions of migration (demographic, economic, security, environmental, politico-institutional, supranational and others); five-year exit rates are 75% in the Netherlands and 67% in Germany versus 12.5-16% in the US.
Central segmented wheel labeled Drivers with driver lists around it and a commentary column
Defines refugees, asylum seekers, others in need of protection, other international migrants and IDPs; migrant stock rose from 250m (2015) to 304m (2024), +21.6%.
Definition cards at left, stacked column at center, commentary at right
Cumulative net interregional flows from 2025 to 2050 total +/-72.5m (Northern America +38.8m, Europe +29.8m, Asia -45.8m, Africa -18.7m); interregional stock is 152.2m and intraregional 142.2m in 2024; 82.2m IDPs in 2025.
Three stacked charts side by side with a commentary column
Top origins: India 18.5m, China 11.7m, Mexico 11.6m; top destinations: USA 52.4m, Germany 16.8m, Saudi Arabia 13.7m; highest migrant shares: Qatar 76.7%, UAE 74.0%, Kuwait 67.3%.
Three horizontal bar charts side by side with a commentary column
There were 168m labor migrants in 2022 (164m in 2017); 68.4% work in high-income countries, 87.4% are aged 25-64, and migrant employment rates are 68.3% versus 66.8% for non-migrants.
Four-quadrant dashboard (bar, donut, stacked bar, pictogram) plus commentary
61.3% of labor migrants are male and 38.7% female; services account for 80.7% of female and 60.8% of male migrant employment in 2022, with changes from 2019 shown in pp bubbles.
Gender donut at left, male and female stacked columns for 2019 vs 2022 with change bubbles
Remittances to LMICs rose from USD 535bn (2019) to a record USD 683bn (2024); India received USD 129bn and Mexico 68bn, remittances equal 45% of GDP in Tajikistan and 38% in Tonga, and average fees are about 6.5% against the 3% SDG target.
Stacked column time series at left, two ranked column charts at right, commentary column
Selected cross-border FDP groups reached 44.6m in 2025 (118m FDP in total); 65% are hosted by neighboring and 68% by low- and middle-income countries; Venezuela (7.6m), Ukraine (5.3m) and Syria (5.0m) are top origins, and the USA (4.2m) and Germany (3.0m) top hosts.
Column chart, 100% bars and two ranked stacked column charts, with commentary
IDPs rose from 55m (2020) to 82m (2025): 68.6m from conflict (led by Sudan 9.1m and Colombia 7.2m) and disasters accounting for the rest; the infographic labels 13.6m from disasters while the text says 11.7m; conflict displacement flows hit a record 32.2m in 2025.
Column chart at left, two radial burst diagrams of top-10 countries in the middle, commentary at right
Under the World Bank's pessimistic scenario there would be 216m internal climate migrants by 2050: Sub-Saharan Africa 86m, East Asia and Pacific 48m, South Asia 41m, North Africa 19m, Latin America 17m, Eastern Europe and Central Asia 5m; action could cut this by 60-80%.
Column chart with a large pull quote and a commentary column
Permanent immigration to the OECD top 10 in 2024: USA 1.425m, Germany 586k, Canada 483k, UK 435k; family dominates in the US (61%) and Italy (61%), work in Japan (63%), and free movement in Germany and the Netherlands (47%).
Ten 100% stacked columns with flag roundels and totals, plus commentary
US refugee ceilings and admissions from 1980 to 2026, with the FY2026 ceiling at 7,500 (lowest ever); US net migration may fall from a 2.7m peak in 2024 to between -10,000 and 295,000 in 2025, with policy changes including expanded travel bans covering 19 countries.
Line chart with shaded Trump terms at left, a highlighted box below, and a policy-change list at right
Country-by-country policy roundup: the EU Migration and Asylum Pact from June 2026, UK 30-month refugee protection, Japan's Zero Plan, Australia's anti-visa-hopping rule, Brazil's humanitarian visa framework and Tuvalu's climate visa (280 people a year).
Mosaic of light-teal country cards over a map background
AI applications across the four-stage migration cycle (pre-departure, entry, stay, return), such as visa chatbots, biometric checks and job-matching, alongside risks of surveillance and algorithmic bias.
Circular four-step cycle diagram around an AI icon with a commentary column
The adult population with post-secondary education rises from 10% (2000, 4.3bn adults) to 19% (2025, 6.1bn) and 28% (2050, 7.7bn), while no education falls from 19% to 12% to 7%.
Three groups of graduate-cap silhouettes sized by share, with bullets below
Post-secondary shares from 2025 to 2050: North America 39% to 48%, Europe 29% to 41%, Asia 18% to 31%, Latin America 17% to 25%, Africa 8% to 14%, Oceania 33% to 41%; one in four Africans had no education in 2025.
Six regional pairs of 100% stacked columns with continent icons
Post-secondary educated 30-34 year-olds: China 43.3m (2025) rising to 67.7m (2050), India 24.7m to 43.7m; by share, Singapore and South Korea reach 86% in 2050 and Angola 4%.
Four horizontal bar charts (absolute and share, 2025 vs 2050)
Women make up 79% of education graduates and 77% of health and welfare graduates, but only 29% in engineering, manufacturing and construction and 24% in ICT (global average, 2023).
100% horizontal diverging bars by field with a commentary column
Over 6 million international students in 2023 (5.1m in the OECD), projected at 8.5m by 2030; the OECD share rose from 5% to 12%, led by Luxembourg 52%, the UK 23% and Canada 21%.
Clustered column chart for 2015 vs 2023 by country with a commentary column
Inbound leaders in 2023: USA 957k, UK 748k, Australia 467k; outbound leaders: China 1,076k and India 834k.
Two horizontal bar rankings with a commentary column
EdTech VC funding fell from a USD 20.8bn peak in 2021 to 2.4bn in 2025; EdTech unicorns went from 35 (valued at USD 104bn) in 2022 to 14 (USD 34bn) in 2025.
Stacked column time series above two column charts, with a commentary column
Top student and teacher AI use cases (e.g. summarizing information, 45; brainstorming lesson ideas, 45) and concerns (plagiarism, 41-42; misinformation, 37; over-dependence) from Microsoft's AI in Education Report.
Two panels of horizontal bars (use cases vs concerns) split into student and teacher rows
Scatter of years of schooling vs GDP per capita PPP (2023) for countries from Djibouti to Luxembourg; literacy went from 12% of the global population in 1820 to fewer than 12% remaining illiterate by 2023.
Scatter plot with labeled countries and a commentary column
Scatter of average PISA score vs GDP per capita PPP (2025) shows a stronger link between education quality and income, with Singapore, Ireland and Japan among the labeled countries.
Scatter plot with labeled countries and a commentary column
Relative earnings by attainment in 2022: upper-secondary graduates earn 32% more than those without on the OECD average (index 132), and tertiary graduates in Chile earn about 420% more.
Column plus dot chart across countries with the OECD average highlighted
Relative earnings of bachelor's-or-higher holders aged 25-34 vs 45-54 in 2022; the OECD average for 25-34 year-olds is 185 and 45-54 year-olds earn about 85% more, with Chile's premium for 45-54 year-olds at 653%.
Column plus dot chart across countries with a commentary column
Employment rates of 25-35 year-olds in 2023 by attainment; the OECD average is roughly 61% below upper secondary, 79% upper secondary and 87% tertiary (read from the chart).
Dot range chart per country with a commentary column
Annual net workforce inflows from 2025 to 2050: China falls from +4.1m to -11.4m by 2050 and Japan and Germany are negative, while India (16.2m falling to 3.6m), Nigeria (3.8m rising to 5.4m) and Pakistan stay positive.
Four small line charts grouped as negative/mixed vs positive, with a commentary column
Annual working hours in the USA, UK, France, Japan, Canada, Germany, Italy and the OECD from 1970 to 2024, falling to 1,331-1,796 hours by 2024, alongside Gen Z's interest in a four-day week.
Multi-line chart with endpoint values and a commentary column
Five-year moving average labor productivity growth from 1975 to 2025 shows G7 economies sliding toward near zero, while China, India and other BRICS are higher but more volatile.
Two stacked multi-line charts (G7 and BRICS) with bullets underneath
AI could add 0.41-1.28pp a year to US productivity growth depending on adoption speed (UK 0.39-1.27, Japan 0.16-0.82); task gains include writing +40%, software +26.1% and client support +18%; Acemoglu projects 0.7% TFP growth and only 5% of enterprises see above-zero returns.
Grouped horizontal bars over a single-series bar chart, with a commentary column
After ChatGPT launched, US job postings for automation-prone roles fell 13% and augmentation-prone roles rose 20% (Harvard Business School difference-in-differences, 2019-2025).
Two-line time series with a ChatGPT launch marker and a commentary column
Defines values (the why: underlying beliefs) and culture (the how: shared customs and behaviors) and how they interact.
Two text panels flanking a circular arrow graphic with a center statement
Article 2 of the 1948 UDHR and an icon grid of all 30 rights; all 193 UN member states have signed on to its principles.
Quote and bullets at left with a 3x10 icon grid of rights at right
Timeline of core human rights treaties from the UDHR in 1948 through ICERD (1965), the ICCPR and ICESCR (1976), CEDAW (1979), CAT (1984), CRC (1989), the migrant workers convention (1990) and the 2006 disability and enforced disappearance conventions.
Snake-path timeline with year cards and a highlighted takeaway band
The 17 SDGs adopted in 2015, with 169 targets and 232 indicators, and 2020-2030 designated the Decade of Action.
SDG color tile grid with a commentary column
A 2025 SDG dashboard rating achievement level and trend for each of the 17 goals across seven regions plus the world average (156 countries, population-weighted).
Heatmap-style matrix of colored dots and trend arrows
Four success cases: China cut poverty from 50% (2000) to virtually 0 by 2021, India's lower secondary completion rose from about 60% to 88%, Argentina's share of women in parliament rose from 27% to 41%, and Iraq's internet use reached 81% in 2025.
Four rows of SDG icon, country flag, sparkline and explanation
A word cloud of diversity dimensions (gender identity, race/ethnicity, language, ability, age and more) with a Mahatma Gandhi quote on unity in diversity.
Overlapping-circle word cloud with a quote and a commentary column
The Human Freedom Index has trended down since 2000 to 6.17 (2023), dropping from 6.36 in 2019 to 6.16 in 2021; Switzerland scores highest (9.15) and Syria lowest (3.27), with 91 countries declining and 67 improving; a sidebar lists push-and-pull factors toward 2050.
Choropleth map with text below and a dark navy outlook panel at right
Freedom scores by area for 2000 vs 2023, e.g. expression 6.8 to 6.2 and association 7.2 to 6.8 down, sound money 6.8 to 7.4 up; only 13.8% of people live in top-quartile jurisdictions and 39.4% in the bottom quartile.
Two paired horizontal bar charts (personal vs economic) with a commentary column
From 2020 to 2050, Christians grow from 2.46bn to 3.03bn (31.4%) and Muslims from 2.00bn to 2.86bn (29.6%), while the unaffiliated share falls to 13.2%; about 87% will be religiously affiliated by 2050.
Two donut charts (7.86bn and 9.65bn totals) with a commentary column
The WEF Global Gender Gap Index 2025 stands at 69.0% across 148 economies, with 123 years to parity; Iceland leads (gap 7.4%), followed by Finland, Norway, the UK and New Zealand.
World choropleth with a top-10 list and a commentary column
Subindex scores: health and survival 96%, education 95%, economic participation 61% and political empowerment 23%; political parity is 162 years away and economic parity 135 years.
Five horizontal progress bars with a commentary column
Women in parliaments: the world average rose from 22% (2015) to 27% (2025); Rwanda (64%), Cuba, Nicaragua, Bolivia, Mexico and the UAE have parity, while Japan is at 10%; parity is not expected before 2063.
Two ranked horizontal bar charts (2015 vs 2025) with a commentary column
Women held about 30% of managerial positions in 2024 (just under 25% in 2000), led only 163 of the 2,811 MSCI ACWI companies, and board parity may not arrive until 2038; the chart's regional values (e.g. World 45%/55%) do not match the 30% in the text and look like gender splits rather than women's shares.
Clustered columns by region (2000 vs 2024) with a commentary column
LGBTQ+ legal status in 2025: homosexual activity is legal in 131 countries and illegal in 62, same-sex marriage is legal in 38, the right to change legal gender exists in 32 and non-binary recognition in 17.
Five segmented 100% horizontal bars with a commentary column
1.3bn people (16%) live with significant disability; EU employment gaps in 2024 were 24.0pp for disability, 18.1pp foreign-born women vs men, 15.7pp, 10.8pp and 10.0pp women vs men; OECD disability employment is about 40%.
Funnel/staircase graphic of gap sizes with people icons and a commentary column
A 2026 DEI country index map across 188 countries led by Sweden; top risers are Gabon (+16) and Nicaragua (+14), top decliners Liberia (-25) and the United States (-16, from #26 to #43).
High/mid/low choropleth with two mover tables and bullets below
A July 2025 survey found reduced hiring of women of color (37%), LGBTQIA+ people (34%) and men of color (33%) after DEI cuts, along with lower morale (47%) and retention of diverse employees (36%).
Two horizontal bar charts with bullets below
Five DEI benefits: talent attraction, innovation, financial performance, employee engagement, and customer and market growth.
Staggered dark pill headers cascading down with descriptions, large DEI watermark, commentary column
Actions for companies facing a shrinking talent pool (AI-enabled workforce planning, broader hiring) and changing demographics and urbanization (entering high-growth markets, serving aging customers, smart city infrastructure).
Impact headers with action bands and a teal sidebar promoting Roland Berger analyses
Actions for a more diverse workforce from migration (recruitment, resource groups, multilingual support) and for AI-driven productivity (AI strategy, AI talent, the lights-out factory).
Impact headers with action bands and a sidebar of Roland Berger offerings
Actions on evolving DEI expectations: keep DEI fundamentals and transparent reporting, integrate DEI into strategy, rethink talent assessment and engage stakeholders.
Single impact band with a Think:Act magazine sidebar
Lists the main sources: UN World Population Prospects 2024 and World Urbanization Prospects 2025, IOM World Migration Report 2026, IDMC GRID 2026, OECD International Migration Outlook and Education at a Glance 2025, Wittgenstein Centre, ILO, the UN SDGs and the Cato Human Freedom Index 2025.
Text list of sources with URLs beside the navigation rail
Authors from the Roland Berger Institute: Dr. Christian Krys (Senior Expert), Dr. David Born (Manager) and Steffen Geering (Expert).
Three circular headshots with names and contacts over a teal photo band
Image credits: page 1 VTT Studio/Adobe Stock; pages 77-79 vegefox.com/Adobe Stock.
Title with credit lines over a full-width photo
Closing page with the Roland Berger B logo and wordmark over a digital globe image; no text content.
Full-bleed image with logo at bottom left and wordmark at bottom right
Algengar spurningar um þessa glæru og undirliggjandi kynningarefni.
It is Megatrend 1 of Roland Berger's Trend Compendium 2050, which in this edition lists seven megatrends. It covers four subtrends: population (growth, aging, urbanization), migration (international, forced and climate migration, policy, AI), education and labor (attainment, earnings, skills shortages, generative AI and productivity), and values and culture (human rights, SDGs, freedom, religion, gender parity, DEI). It ends with corporate action recommendations.
World population grows from 8.2 billion in 2025 to 9.6 billion in 2050 and peaks at 10.29 billion in 2086. People aged 65+ double from 857 million to 1.6 billion, the global median age rises 5.2 years to 36.1, Africa adds roughly one billion people (+60%), and nearly a third of growth comes from India, Nigeria and Pakistan. The urban share rises from 58% to 67%.
There were 304 million international migrants in 2024 (+21.6% since 2015), and 82.2 million internally displaced people in 2025. Remittances to low- and middle-income countries hit a record USD 683 billion in 2024. Under a pessimistic World Bank scenario, up to 216 million people could become internal climate migrants by 2050. On work, studies cited project AI could add up to about 1.3 percentage points a year to US productivity growth under rapid adoption. After ChatGPT, US postings for automation-prone jobs fell 13% while augmentation-prone jobs rose 20%.
It is compiled by the Roland Berger Institute, the think tank of the strategy consultancy Roland Berger. The Trend Compendium is a long-running series that Roland Berger updates periodically, one volume per megatrend. This People & Society volume is the 2026 Edition, with data through 2025-2026. It deliberately uses public sources such as the UN, OECD, ILO and WEF so the analysis can be checked.
Almost every page uses an action title, a full-sentence headline that states the takeaway, often in two parts joined by a dash. Below it sit one or two sourced charts and a right-hand commentary column. A persistent left rail shows where you are among subtrends 1.1-1.4. Footnotes and sources sit at the bottom of every chart, and the deck closes with impact-and-action pages. It is a useful model for chart-heavy strategy and research decks.
Start from a document, report or outline. 2Slides can turn it into slides with action titles, chart layouts and an executive summary flow. You can then refine each page around one message and one supporting visual, the way this Roland Berger deck does.
The original PDF is published by Roland Berger at rolandberger.com (see the source link on this page). The other megatrend volumes of the Trend Compendium 2050 are available from Roland Berger's publications pages.
It has 79 pages. There is an introduction (pages 1-4), Population (5-21), Migration (22-35), Education & Labor (36-53), Values & Culture (54-72), corporate actions (73-75), then sources, authors and credits (76-79).
Original 2026 Edition report published by Roland Berger / Roland Berger Institute

Create Your Own Slides
Turn your ideas into professional presentations in seconds with 2slides AI.
Sæktu innblástur í faglega hönnun, veldu þinn stíl og búðu til glærur með fullkominni textabirtingu. Knúið af Nano Banana—byrjaðu að búa til kynninguna þína núna.
Þinn AI-þjónn fyrir glærur. Sparaðu tíma, skín hraðar með snjallri kynningargerð.


© 2026 2slides. Allur réttur áskilinn.