
Hluti af safninu Dæmi um fjárfestakynningar · Dæmi um japanskar fjárfestakynningar
Nissan Chemical Corporation's results briefing for the first half (Q2) of fiscal 2026 (year ending March 2027), presented by CFO Hideki Daimon on 2026-11-09. This is a 63-page Japanese-language deck whose original was published on TDnet (Tokyo Stock Exchange timely disclosure). It covers H1 consolidated results, the upwardly revised full-year forecast, segment reviews (Performance Materials, Agricultural Chemicals, Chemicals, Healthcare), ESG topics and reference data.
Notar forsíðu þessarar kynningar sem stílfyrirmynd fyrir glærur úr þínu eigin efni. Eða veldu hvaða síðu sem er hér fyrir neðan og notaðu uppsetningu hennar sem fyrirmynd.
Flýtileiðsögn
Merki
Deila glærunum
Nissan Chemical Corporation's results briefing for the first half (Q2) of fiscal 2026 (year ending March 2027), presented by CFO Hideki Daimon on 2026-11-09. This is a 63-page Japanese-language deck whose original was published on TDnet (Tokyo Stock Exchange timely disclosure). It covers H1 consolidated results, the upwardly revised full-year forecast, segment reviews (Performance Materials, Agricultural Chemicals, Chemicals, Healthcare), ESG topics and reference data.
Ítarleg sýn á hverja glærusíðu, þar á meðal útlit, lykilefni og sjónræna þætti.
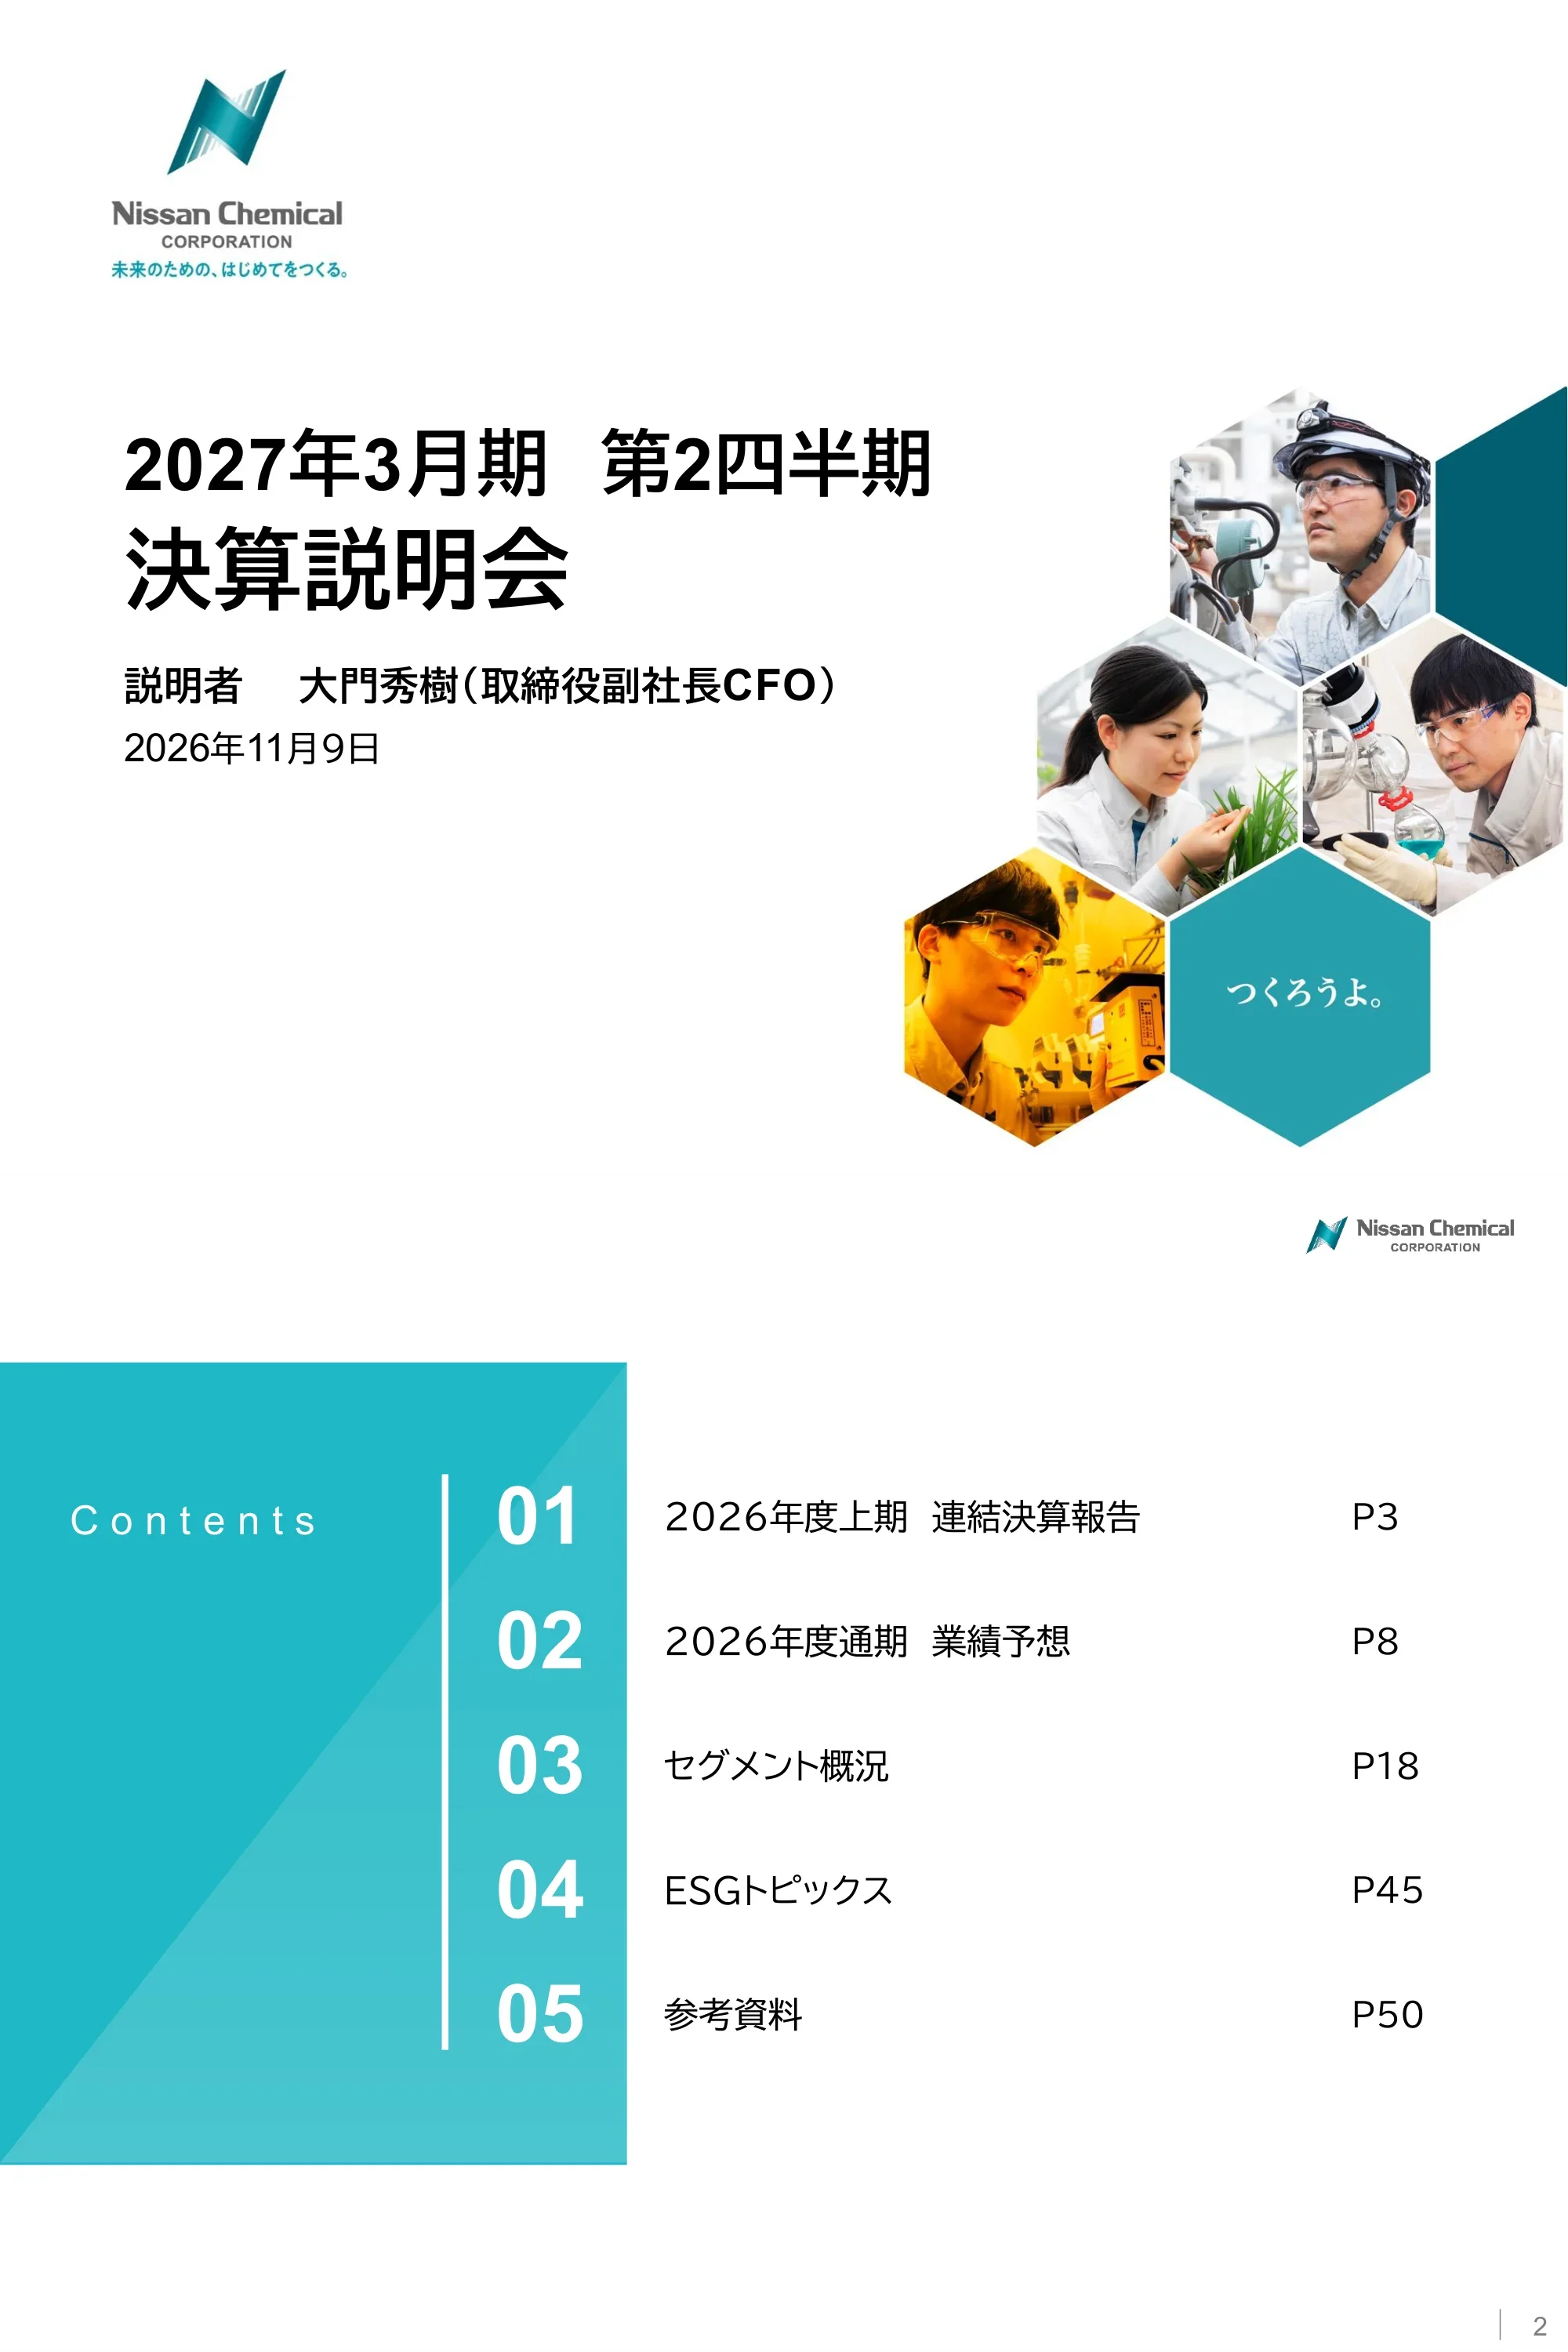
Title page for the briefing on Q2 of the fiscal year ending March 2027, presented by Hideki Daimon (Executive Vice President and CFO) on 2026-11-09.
Left-aligned logo and title block on white, with a honeycomb photo collage on the lower right
Five-part agenda with page numbers: H1 FY2026 consolidated results (p.3), full-year forecast (p.8), segment overview (p.18), ESG topics (p.45) and reference materials (p.50).
Teal panel with large numerals on the left, agenda items and page references on the right
Agenda tracker with section 01, H1 FY2026 consolidated results (p.3), highlighted.
Same contents layout with the active item in full contrast and the others faded
H1 sales rose ¥15.5 billion (155億円, +12%), operating profit ¥4.6 billion (+16%) and net income ¥3.2 billion (+14%), all records. Versus the May forecast: sales +¥14.1 billion, operating profit +¥5.5 billion, net income +¥3.6 billion; interim dividend ¥78 (+¥8) and ¥5.5 billion buyback done (718 thousand shares).
Four teal label blocks on the left with bullet text on the right
H1 sales ¥145.6 billion (1,456億円) vs 1,301; operating profit 342 vs 296; net income 260 vs 228; EBITDA 419; EPS ¥194.70; operating margin 23.5% (+0.7pt). Q2 alone: sales 668, operating profit 123; exchange rate ¥159 per dollar.
Wide financial table grouped by FY2025, FY2026 and year-over-year change columns, with 1Q, 2Q and H1 sub-columns
H1 actuals versus the May 2026 forecast: sales 1,456 vs 1,315 (+141, +11%), operating profit 342 vs 287 (+55, +19%), net income 260 vs 224 (+36, +16%). H1 operating margin 23.5% vs 21.8% forecast.
Same table format as page 5 with forecast, actual and variance column groups
H1 operating profit of ¥34.2 billion (342億円) was +¥4.6 billion year over year and +¥5.5 billion versus forecast. Functional Materials +35 on semiconductor and inorganic volumes; Agrochemicals -1; Chemicals -1; Healthcare +2 versus last year.
Five KPI header boxes over a four-row segment table pairing each variance with a short explanation
Agenda tracker with section 02, FY2026 full-year forecast (p.8), highlighted.
Contents layout with item 02 active
Operating profit forecast raised from ¥66.8 billion to ¥72.4 billion (record). Full year: sales +¥31.5 billion (+11%), operating profit +¥8.8 billion (+14%), net income +¥3.6 billion (+7%), ROE forecast 20.3%. Annual dividend ¥220 (+¥8 versus May), buyback ¥10.5 billion total (¥5.5 billion done), total payout ratio 74.6%.
Upper half: four teal label boxes with bullets for full year and H2; lower half: shareholder-return table
FY2026 forecast: sales 3,111 (+315, +11%), operating profit 724 (+88, +14%), net income 533 (+36, +7%), EBITDA 902, EPS ¥399.93, dividend ¥220, payout ratio 55.0%, ROE 20.3%. H2 operating profit 382 (+42); assumed exchange rate ¥156.
Wide table with FY2025 actuals, FY2026 forecast (H1 actual, 3Q, 4Q, H2, full year) and variance columns
November forecast versus May: sales 3,111 vs 2,897 (+214, +7%), operating profit 724 vs 668 (+56, +8%), net income 533 vs 515 (+18, +3%), EPS ¥399.93 vs 387.11. Ordinary income +33 and special gains -4 versus May.
Table with May forecast, November forecast and variance column groups across H1, H2 and full year
H2 operating profit forecast 382 (+42, +13%): Functional Materials +28, Agrochemicals +15, Chemicals +5, Healthcare -2. Full year 724 (+88, +14%): Functional Materials +63, Agrochemicals +14, Chemicals +4, Healthcare flat; +56 versus the May forecast of 668.
Two stacked blocks (H2 and full year), each with KPI header boxes and segment rows with explanations
Full-year non-operating result forecast -¥0.3 billion (-3.0) vs +23.5 last year, driven by FX loss of -28.6 vs +6.1; equity-method gains 21.1. Special gains 3.1 in H2. Footnote lists period-end exchange rates (e.g. 157.33 at end of September 2026).
Two stacked tables (non-operating, special items) with FY2025, FY2026 forecast and change columns
Versus May, full-year non-operating result moves from +20.0 to -3.0 (-23.0), mainly FX loss of -28.6 against a zero assumption. Special gains cut from 6.5 to 3.1 (-3.4).
Same two-table layout as page 13 with May forecast as the baseline
FY2026 forecast free cash flow is ¥32.4 billion (324億円), down 106 year over year, versus 268 in the May forecast. Operating cash flow 625, capex 257, shareholder returns 282 in dividends and 105 in buybacks; H1 free cash flow was 431. Year-end cash 345.
Headline sentence above a dense cash-flow table with an extra May-forecast column on the right
At end of September 2026 total assets were ¥353.6 billion (3,536) and net assets 2,652; equity ratio 73.8% and net D/E -0.08x. Policy-held shares were 8.9% of net assets versus 17.0% at March 2018; listed shares 218 across 24 names.
Assets table on the left, liabilities and net assets on the right, investment-securities breakdown and reference column below
FY2026 forecast capex ¥25.7 billion (257), depreciation 178 and R&D 254, versus FY2025 197, 155 and 214. Functional Materials capex 137 and R&D 136; capex content includes ¥5.5 billion for semiconductor R&D and manufacturing equipment and ¥1.6 billion for NBR agrochemical production.
Headline text, segment-by-year table in three blocks, then capex details and depreciation-method footnotes
Agenda tracker with section 03, segment overview (p.18), highlighted.
Contents layout with item 03 active
FY2026 forecast: Performance Materials (機能性材料) sales ¥136.8 billion of ¥311.1 billion total and operating profit 416 of 724. Segment margin is 30.4% forecast versus 31.1% in FY2025; sales rose from 588 in 2017 to 1,134 in 2025.
Two donut charts (sales and operating profit mix) above a combined bar-and-line trend chart
Semiconductor materials grew +27% in FY2024 and +37% in FY2025, with +15% forecast to follow for inorganic colloids; display materials were roughly flat at -1% to -2%. Segment EBITDA margin stays at 34%-37% (36% in the FY2026 forecast).
Four bullets on top; stacked bar chart of sub-segments with growth-rate annotations and an EBITDA margin line
FY2026 forecast operating profit rises from 353 to 416 (+18%): volume +127, price and other +11, fixed costs -75 (including R&D and depreciation -72). The May forecast was 386 (+9%).
Waterfall chart with a callout box above and a reference row for the May forecast below
Nissan Chemical's semiconductor materials sales are targeted at +20% or more CAGR for 2024-2030, versus market growth of +10% (about +10pt outperformance), with an upside case of +26%. Leading-edge and advanced generations rise from 51% of sales in 2024 to 55% in 2026 and about 63% in 2030; unchanged from May.
Top line chart of sales path with upside band, bottom left market-versus-company comparison, bottom right generation-mix bars
Semiconductor materials grew 49% in H1 and are forecast +37% for the full year (May forecast +18%); ARC +29%, multilayer +51%, EUV +33%. Display materials -8% in H1 and -2% for the year; inorganic colloids +16% in H1 and +15% for the year; segment total +21%.
Three bullets above a growth-rate table comparing May and November forecasts by quarter and period
Segment sales 1,368 (+234) and operating profit 416 (+63) forecast for the year; H1 actuals 670 and 209. Semiconductor materials show growth in H1, H2 and the full year; display is down in H1 and up in H2; inorganic colloids see profit pressure in H2 from higher fixed costs.
Small results table on top, then three labelled commentary blocks (semiconductor, display, inorganic colloids)
Versus the May forecast, segment sales are 1,368 vs 1,261 (+107) and operating profit 416 vs 386 (+30). Semiconductor materials beat on customer utilization; display missed because of memory price increases; ¥0.7 billion of inventory-related cost shifts from H1 to H2.
Results table on top with three commentary blocks beneath
FY2026 forecast: Agricultural Chemicals sales ¥100.2 billion (1,002) and operating profit 274, a 27.3% margin versus 27.0% in FY2025 (sales 962, profit 260). Links are provided to the January 2026 agrochemical business briefing and the Roundup briefing.
Two donut charts above a sales, profit and margin trend chart for 2017-2026
Full-year sales forecast +4% (H1 -2%, H2 +9%). Verdor (ベルダー) +85% and Roundup +8% lead, Raimei -17%; fluralaner +6%. Domestic +5% and overseas +1% for the year.
Product growth table at top, regional growth table bottom left, product mix bar chart bottom right
Full-year sales 1,002 (+40) and operating profit 274 (+14); H1 sales 414 (-9), H2 588 (+49). Volume growth in Roundup, Altair, Verdor and Grachia drives the year, offset by weather-related weakness for Raimei in Europe.
Results table on top followed by H1, H2 and full-year commentary blocks, each in two columns by product
Full-year sales 1,002 vs 972 forecast (+30) and operating profit 274 vs 270 (+4). H1 beat on Altair, Verdor and Grachia expansion; H2 profit is -4 versus forecast on ¥0.6 billion higher fixed costs.
Results table at top, then H1 and H2 commentary in two-column product lists
Product launch table from Roundup (2002) to the pipeline of Grachia (2018), Quintec, Daisen, Verdor (2024), Rizonic (2027) and Precio (2028). The new-product group has a combined peak sales target of ¥41.0 billion (410億円), with Rizonic's target raised from 100 to 150 in January 2026.
Table of launch year, product, class, development route and notes; pipeline rows boxed in gold with a callout
Nissan Chemical ranks first in Japanese agrochemical sales; FY2025 overseas ratio is 36% (Asia 47%, Europe and Africa 38%, Americas 15%), excluding fluralaner. Company sales mix is 58% herbicides, 20% insecticides and 20% fungicides versus 41%, 29% and 27% for the global market.
Two donut charts at top, a sales trend bar chart bottom left and a product-mix comparison bar bottom right
Fluralaner, invented by Nissan Chemical, is the active ingredient in the BRAVECTO and EXZOLT products, sold in over 100 countries. BRAVECTO offers up to 12 weeks of efficacy versus about one month for competitors; the long-term MAH supply agreement was extended in April 2025.
Bullets at top, a flow diagram from active ingredient to three product lines beside product packshots, then three detail columns
Fluralaner sales combine raw material sales to MAH and running royalties. FY2025 sales rose 10% (raw material +37% with shipment timing), and FY2026 is forecast +6% at an assumed ¥152 per dollar in H2; H2 is expected to be about the same as H1.
Two bar charts (quarterly and annual) with commentary boxes beneath, plus a development note at the bottom
FY2026 forecast: Chemicals sales ¥45.6 billion (456) and operating profit 15, a 3.3% margin versus 2.8% in FY2025 (393 and 11). Margin peaked at 10.1% in 2021 and fell to 0.1% in 2023.
Two donut charts above a bar-and-line segment trend chart
Full-year sales 456 (+63) and operating profit 15 (+4); fine chemicals 159 and basic chemicals 297. H1 was -2 operating profit, with H2 +17 as Fine Oxo Alcohol, TEPIC, environmental chemicals and price revisions contribute.
Results table with fine and basic chemicals sub-rows, then three commentary blocks (H1, H2, full year)
Full-year sales 456 vs 414 forecast (+42) and operating profit 15 vs 13 (+2). H1 profit was -5 versus forecast (raw material costs in basic chemicals) while H2 is +7 on cosmetics-related Fine Oxo Alcohol and sulfuric products.
Results table with fine and basic chemicals rows plus H1 and H2 commentary blocks
Flow chart showing natural gas to ammonia, urea, AdBlue, nitric products, cyanuric acid, TEPIC, melamine cyanurate and Hi-Lite, plus a sulfur to high-purity sulfuric acid line. Domestic ammonia capacity share is only 11%, so the strategy focuses on high-value products such as high-purity sulfuric acid; unchanged from May.
Left-to-right process flow with colored boxes for purchased raw materials, basic chemicals and fine chemicals plus a legend
FY2026 forecast: Healthcare sales ¥5.8 billion (58) and operating profit 14, a 24.1% margin versus 26.9% in FY2025 (52 and 14). Sales were 75 in 2017 and operating margin peaked at 44.8% in 2022.
Two donut charts above a bar-and-line trend chart
Full-year sales 58 (+6) and operating profit 14 (flat); H1 sales 31 and profit 9, H2 27 and 5. H1 profit rose on lower fine-tech fixed costs, while H2 is slightly lower on higher fixed costs.
Compact results table with three commentary labels (H1, H2, full year) and short text
Full-year sales 58 vs 55 forecast (+3) and operating profit 14 vs 11 (+3). H1 beat on fine-tech shipments pulled forward from H2, which lowers the H2 sales forecast.
Compact table with H1 and H2 commentary blocks
H1 sales: Performance Materials 670 (+126, +23%), Agrochemicals 414 (-9), Chemicals 206 (+18), Healthcare 31 (+3), total 1,456 (+155, +12%). H1 operating profit 342 total: Performance Materials 209 (+35), Agrochemicals 119 (-1), Chemicals -2, Healthcare 9.
Segment-by-metric table with FY2025 and FY2026 1Q, 2Q and H1 columns plus change columns
H1 versus the May forecast: Performance Materials sales +68 and operating profit +31; Agrochemicals +22 and +8; Chemicals +10 and -5; Healthcare +6 and +4. Group total sales +141 (+11%) and operating profit +55 (+19%).
Same table as page 41 with forecast, actual and variance column groups
FY2026 forecast by segment: sales 1,368 / 1,002 / 456 / 58 for Performance Materials, Agrochemicals, Chemicals and Healthcare; operating profit 416 / 274 / 15 / 14. Group sales 3,111 (+315) and operating profit 724 (+88).
Large table with FY2025 actuals, FY2026 forecast (including 3Q and 4Q) and year-over-year change by segment
November versus May forecast: Performance Materials operating profit 416 vs 386 (+30), Agrochemicals 274 vs 270 (+4), Chemicals 15 vs 13 (+2), Healthcare 14 vs 11 (+3). Group sales 3,111 vs 2,897 and operating profit 724 vs 668 (+56, +8%).
Same segment table with May forecast, November forecast and variance column groups
Agenda tracker with section 04, ESG topics (p.45), highlighted.
Contents layout with item 04 active
Chronological list across Environment/Social and Governance: 2050 carbon neutral goal (May 2022), Integrated Report 2026 published October 2026, and the April 2026 pay-mix revision from 65/28/7 to 50/30/20 (base/performance/share). Two female outside directors re-elected out of 10 directors in June 2026.
Two stacked grey category bars (E/S and G) with date boxes and descriptions in rows
Inclusion in Dow Jones Best-in-Class Asia Pacific (8 years), S&P/JPX Carbon Efficient (8 years), FTSE4Good and FTSE Blossom Japan (7 years), MSCI ESG rating raised from A to AA (May 2025), and CDP A List for water security (January 2026). Also Health and Productivity Outstanding Organizations White 500 for the tenth consecutive year.
Two-column grid of grey-headed boxes, one per index or certification, with logos
Three materiality themes with targets: sustainable agenda product share of sales 60% or more (raised from 55%), employee survey positive response rate 65% or more and research-lab female career-track ratio 18% or more, and GHG emissions down 30% or more versus FY2018. Corporate governance, risk management and compliance form the base; unchanged from May 2025.
Three teal columns with white target cards above a pyramid-style base banner
Single-entity Scope 1+2 emissions were 363 kt-CO2e in FY2018 and 331 in FY2025 (temporarily higher after the nitric acid plant trouble), against a FY2027 target of 254 (-30%). A ¥830 million N2O abatement investment at the nitric acid plant starts operating in August 2026.
Bullets at top, bar chart of annual emissions with a target arrow, peer comparison table and initiatives box at the bottom
Agenda tracker with section 05, reference materials (p.50), highlighted.
Contents layout with item 05 active
FY2025-27 cumulative cash-in of about ¥250.0 billion (2,500億円) from operating cash flow before R&D, against cash-out of R&D 700, capex 800 and shareholder returns 1,000, plus debt-funded M&A capacity. Total payout ratio target is 75% or more; unchanged from May 2025.
Two stacked columns (cash in and cash out) on the left with allocation principles listed on the right
ROE is the top-priority management metric, with a medium-term target of 18% or more. It rose from 9.5% in FY2011 to 20.3% in FY2025 and is forecast at 20.3% for FY2026, with net income of ¥53.3 billion (533).
Three bullets above a combined bar (net income) and line (ROE) chart for 2011-2026
Medium-term target is a 75% or higher total payout ratio; FY2025 actual was 75.7% and FY2026 is forecast at about 75%. FY2026 forecast: dividends 293 (55%) and buyback 105 (20%); the ratio peaked at 86% in 2023.
Two bullets above a stacked bar chart (dividends and buybacks) with a payout ratio line for 2011-2026
Payout target raised from 45% to 55% or more in May 2022 and kept at 55% or more. Dividends per share: ¥174 in FY2024, ¥202 in FY2025 and ¥220 forecast for FY2026 (three consecutive increases); EPS forecast ¥399.93.
Four bullets above a bar-and-line chart of EPS, dividend and payout ratio for 2011-2026
Buybacks since FY2006 total ¥145.5 billion (1,455億円) and 52.28 million shares (27.9% of shares issued before the program), all retired. The FY2026 ¥10.5 billion buyback is capped at 2.1 million shares, with ¥5.5 billion done from April to July 2026.
Bullets at top, a long annual table 2006-2025, a 2021-2026 half-year table and a cash management policy line
R&D expense rises from ¥13.6 billion (136) in FY2011 to 214 in FY2025 and a forecast 254 in FY2026; R&D-to-sales ratio stays in the 7%-9% range (8.2% forecast). Growth centers on semiconductor-led Performance Materials and Agrochemicals.
Two bullets above a bar chart (R&D) with a ratio line across 2011-2026
About 40% of career-track employees work in R&D (490 of 1,350 as of September 2026). FY2025 R&D was 214 (7.7% of sales): Performance Materials 103 (9.1%), Agrochemicals 45 (4.7%), corporate and other 66, while total operating margin remained 22.7%.
Two bullets, a segment R&D table, and two donut charts (headcount mix and lab headcount by segment)
Single table from FY2007 to the FY2026 forecast: sales from 1,692 to 3,111, operating profit from 248 to 724, ROE 20.3%, EPS ¥399.93, dividend ¥220 and R&D 254. Equity ratio was 71.9% at FY2025.
Dense year-by-metric table with teal header row and alternating row shading
Segment tables for 2014-2026 forecast: Performance Materials operating profit rises from 120 to 416 with a 30.4% forecast margin; Agrochemicals 92 to 274. FY2025 ROA by segment is 45.7% for Performance Materials and 23.3% for Agrochemicals, 17.9% overall.
Three stacked tables (sales, operating profit, margin) with segment assets and ROA side columns
Quarterly sales FY2023 to FY2026 forecast by segment, with the May forecast on the right. FY2026 actual 1Q and 2Q Performance Materials sales were 326 and 344, versus 296 and 306 in the May forecast.
Wide table with year blocks (1Q-4Q plus full year), highlighted FY2026 block and May forecast block
Quarterly operating profit FY2023 to FY2026 forecast: group total 482 (FY2023), 568, 636 and a 724 forecast. FY2026 1Q and 2Q group operating profit were 219 and 123 versus 168 and 119 in the May forecast.
Same quarterly grid as page 60 for operating profit
Reference list of products by segment and use: semiconductor ARC, OptiStack multilayer, EUV and 3D packaging materials, display polyimide alignment (SUNEVER), colloidal silica (SNOWTEX), agrochemicals (Roundup, Grachia, Raimei), fluralaner, TEPIC, AdBlue, high-purity sulfuric acid and the cholesterol drug Livalo raw material.
Three-column table (segment, product, main use) with grouped sections and trademark footnotes
States that forward-looking statements are based on available information and are not guarantees, that the deck is not an investment solicitation, and that all content is owned by Nissan Chemical Corporation.
Centered text block between teal rules with the corporate logo below
Algengar spurningar um þessa glæru og undirliggjandi kynningarefni.
The slides are in Japanese; this page provides an English-language analysis. The original was published on TDnet, the Tokyo Stock Exchange's timely disclosure system, as Nissan Chemical's results briefing materials (決算説明会資料) for Q2 of the fiscal year ending March 2027, presented on 2026-11-09.
Nissan Chemical names its fiscal year by the calendar year in which it starts, so FY2026 (2026年度) runs from April 2026 to March 2027. H1 FY2026 is April to September 2026, and the deck compares it with FY2025 (April 2025 to March 2026).
H1 sales were ¥145.6 billion (+12%), operating profit ¥34.2 billion (+16%) and net income ¥26.0 billion (+14%), all records. The full-year operating profit forecast was raised from ¥66.8 billion to ¥72.4 billion on sales of ¥311.1 billion and net income of ¥53.3 billion.
Four segments: Performance Materials (semiconductor, display and inorganic colloid), Agricultural Chemicals (including fluralaner animal health), Chemicals and Healthcare. Performance Materials drives growth, with FY2026 forecast operating profit of ¥41.6 billion of the ¥72.4 billion total and semiconductor materials sales forecast +37%.
The annual dividend forecast is ¥220 per share (interim ¥78, year-end ¥142), a 55.0% payout ratio, with a ¥10.5 billion buyback of which ¥5.5 billion is done. The total payout ratio is forecast at 74.6% against a medium-term target of 75% or more.
Management targets +20% or more CAGR for semiconductor materials sales in 2024-2030, about 10 points above the +10% market growth, with an upside case of +26%. Leading-edge and advanced generations are expected to reach roughly 63% of sales by 2030; the outlook is unchanged from May 2026.
Yes. It pairs a consistent teal-and-grey palette and a contents tracker with dense variance tables, waterfall bridges, donut mix charts and bar-line trends on every segment page. It suits chemicals, materials and manufacturing IR decks that need many tables.
The disclaimer states that all content in the original deck is owned by Nissan Chemical Corporation and that it is not an investment solicitation. Use the figures for research with attribution to the original TDnet filing, and treat the layout structures as inspiration for your own original deck.

Create Your Own Slides
Turn your ideas into professional presentations in seconds with 2slides AI.
Sæktu innblástur í faglega hönnun, veldu þinn stíl og búðu til glærur með fullkominni textabirtingu. Knúið af Nano Banana—byrjaðu að búa til kynninguna þína núna.
Þinn AI-þjónn fyrir glærur. Sparaðu tíma, skín hraðar með snjallri kynningargerð.


© 2026 2slides. Allur réttur áskilinn.