2Slides merki
Preview

Morgan Stanley The BEAT Q4 2026 Global Market and Asset Allocation Guide

92 glærur

Morgan Stanley Investment Management's The BEAT (Bonds | Equities | Alternatives | Transition), a 92-page quarterly global market and asset allocation guide for Q4 2026 (November edition). It pairs Top Views and tactical allocation grids with chart-driven sections on bonds, equities and alternatives, a data-heavy Market Monitor and full disclosures.

4 líkar við
0 niðurhöl

Notar forsíðu þessarar kynningar sem stílfyrirmynd fyrir glærur úr þínu eigin efni. Eða veldu hvaða síðu sem er hér fyrir neðan og notaðu uppsetningu hennar sem fyrirmynd.

Flýtileiðsögn

Merki

Market outlook
Asset allocation
Quarterly report
Investment management
Financial presentation

Deila glærunum

Lýsing

Meginviðfangsefni

Morgan Stanley Investment Management's The BEAT (Bonds | Equities | Alternatives | Transition), a 92-page quarterly global market and asset allocation guide for Q4 2026 (November edition). It pairs Top Views and tactical allocation grids with chart-driven sections on bonds, equities and alternatives, a data-heavy Market Monitor and full disclosures.

Helstu kostir

  • •A complete model for a quarterly market outlook: contents page, top views, allocation signals, thematic chart pages, data appendix and disclosures
  • •Reusable overweight/underweight signal grids with dot markers, a change-from-previous arrow and numbered Points of Focus panels
  • •Colour-coded sections (Top Views, Bonds, Equities, Alternatives, Transition, Market Monitor) that make a long deck easy to navigate
  • •Chart-plus-takeaway pages where a headline, one-sentence subtitle, titled chart and source footnote repeat on every page
  • •Dense table and heat-map layouts for yields, spreads, returns, valuations, correlations and fund flows
  • •Built-in compliance pages: index definitions, risk considerations and regional distribution notices

Markhópur

  • •Asset managers and investment strategists writing quarterly outlooks
  • •Wealth managers and financial advisors preparing client market reviews
  • •Investment committee and research teams building asset allocation presentations
  • •Finance students and analysts studying how institutional market guides are structured
  • •Presentation designers creating data-dense financial reports

Notkunartilvik

  • •Quarterly or monthly market outlook and asset allocation guide
  • •Client review meetings that summarise views across bonds, equities and alternatives
  • •Investment committee packs with tactical overweight/underweight grids
  • •Desk-reference market monitors with yield, spread, return and valuation tables
  • •Financial research reports that need a standard disclosure and index-definition appendix

Einstök virðistilboð

  • •A real institutional example of a 92-page 4:3 PowerPoint guide covering four asset-class pillars plus a data monitor
  • •Interactive-style contents page with coloured section boxes and page numbers for jump navigation
  • •Consistent header, section label, headline, source and footer system across more than 80 content pages
  • •Mix of line, bar, column, waterfall and quilt-style charts with matching table layouts, ready to repurpose
  • •Clear separation of commentary pages (Top Views to Transition) from the reference-style Market Monitor

Glærusíður (92)

Ítarleg sýn á hverja glærusíðu, þar á meðal útlit, lykilefni og sjónræna þætti.

Síða 1
title slide

The BEAT Cover

Efni

Cover for the Quarterly Global Market and Asset Allocation Guide, Q4 2026 - November, expanding BEAT as Bonds | Equities | Alternatives | Transition.

Uppbygging útlits

Left-aligned title block with bottom banner

Helstu sjónrænir þættir

  • •Large The BEAT wordmark
  • •Purple and crimson corner blocks
  • •Dark gradient banner with glowing wave lines
Síða 2
agenda

Contents and Introduction

Efni

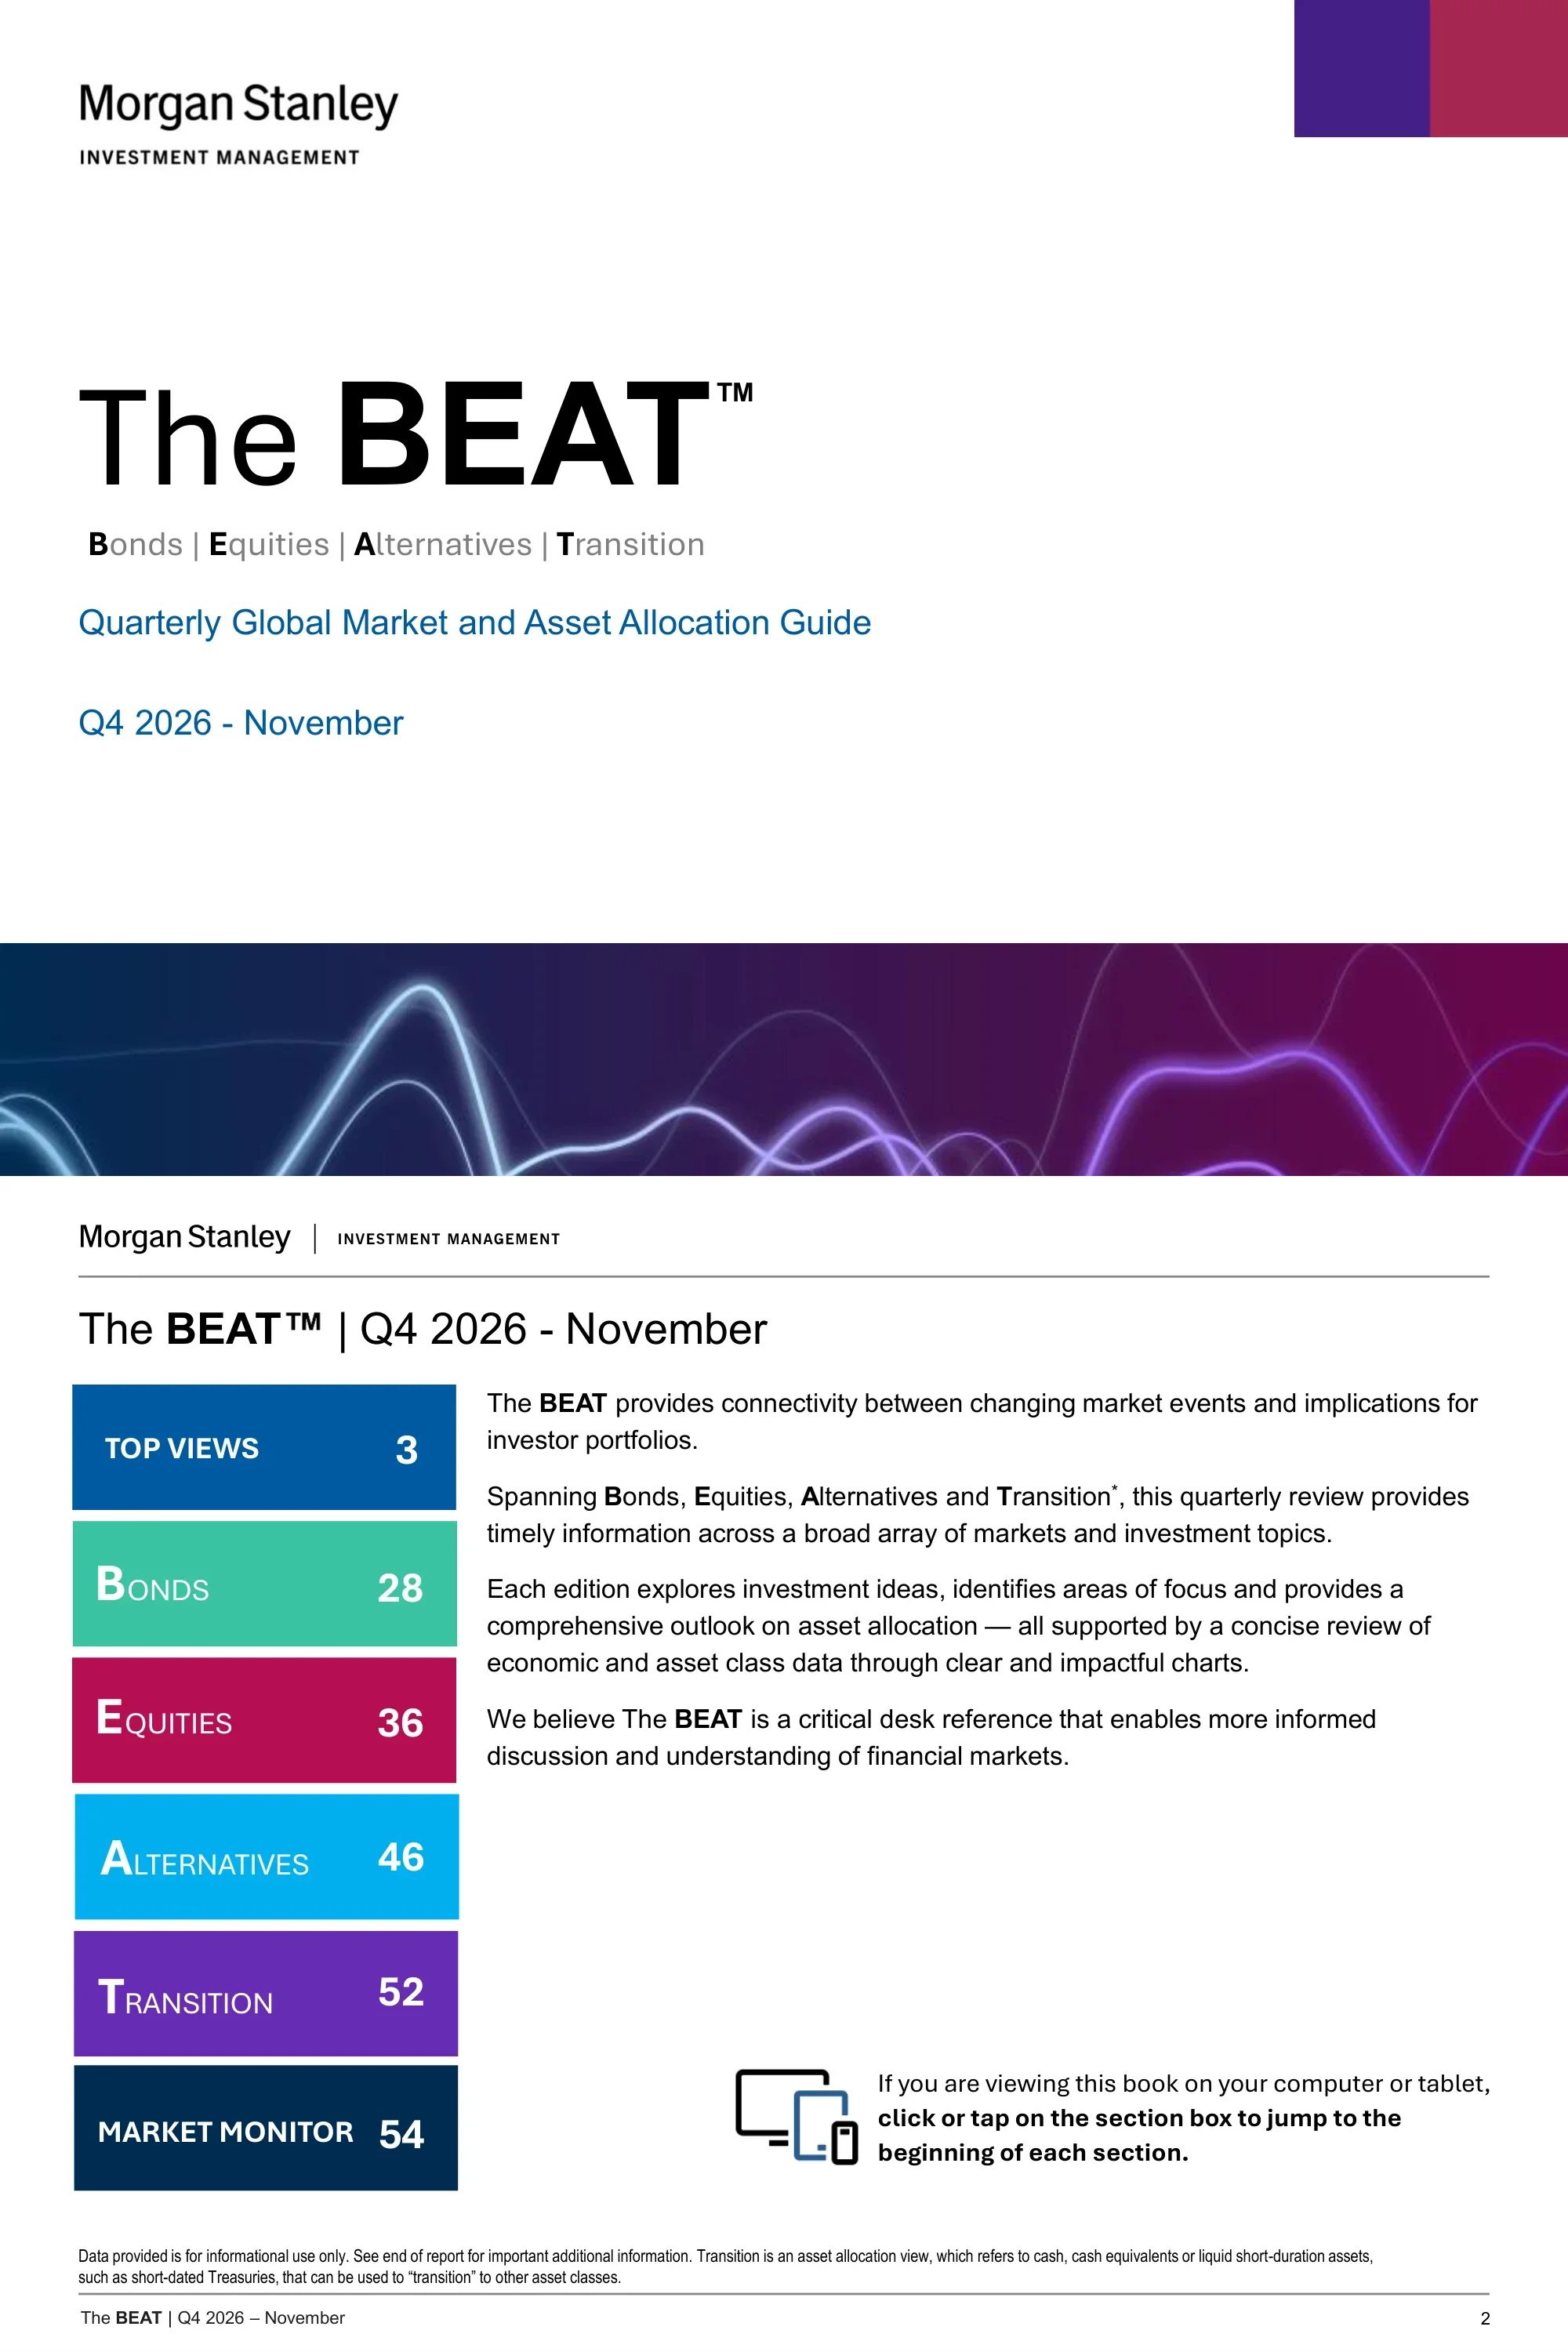
Introduces The BEAT as a desk reference and indexes its sections: Top Views (p.3), Bonds (28), Equities (36), Alternatives (46), Transition (52) and Market Monitor (54).

Uppbygging útlits

Colour-box contents list beside intro text

Helstu sjónrænir þættir

  • •Six stacked colour-coded section boxes with page numbers
  • •Intro paragraph with bold BEAT initials
  • •Device icon with click-to-jump instruction
Síða 3
section divider

Top Views Divider

Efni

Section divider opening the Top Views part of the guide.

Uppbygging útlits

Title-only divider

Helstu sjónrænir þættir

  • •Section name over branded banner
  • •Guide title line
  • •Minimal layout
Síða 4
conclusion

Rates Are Up. Growth Is Strong. Stay Constructive.

Efni

Summarises the constructive stance: yields are rising largely because nominal growth is strong, with eight themes from equities to EM external debt.

Uppbygging útlits

Intro paragraph above two-column theme list

Helstu sjónrænir þættir

  • •Blue intro paragraph
  • •Eight bold-label theme blocks in two columns
  • •Top Views section tag
Síða 5
conclusion

Top Active Views

Efni

Lists seven ranked active views, from overweight global equities versus fixed income to MBS/residential non-agency as the highest-conviction bond overweight.

Uppbygging útlits

Numbered list of seven views

Helstu sjónrænir þættir

  • •Numbered markers 1 to 7
  • •Bold view headline with one-line rationale
  • •Abbreviation note in footer
Síða 6
table

Capital Markets Investment Framework

Efni

Allocation grid placing duration, corporate credit, equity risk level, private markets, hedge funds, commodities and cash on an underweight-to-overweight scale, with three points of focus.

Uppbygging útlits

Signal grid with side panel

Helstu sjónrænir þættir

  • •Dot-matrix grid from -- to ++
  • •Arrow showing change from previous
  • •Shaded Points of Focus panel with numbered squares
Síða 7
comparison

Representative Allocations: Commentary

Efni

Commentary beside the asset allocation grid, noting U.S. 10-year yields back near 5% and a slightly underweight duration view.

Uppbygging útlits

Mini grid with commentary column

Helstu sjónrænir þættir

  • •Row labels for Bonds, Equities and Alternatives
  • •Commentary paragraphs by asset class
  • •Disclosure footnote
Síða 8
table

Global Fixed Income Signals

Efni

Views grid for Treasuries, TIPS, eurozone government bonds, EM debt, municipals, IG, MBS/ABS, high yield and bank loans, with MBS/ABS as the highest-conviction fixed income overweight.

Uppbygging útlits

Signal grid with side panel

Helstu sjónrænir þættir

  • •Dot markers on five-point scale
  • •Public Credit sub-header
  • •Five numbered Points of Focus
Síða 9
comparison

Global Fixed Income Commentary

Efni

Written rationale for each fixed income view, including slightly underweight U.S. duration and an overweight to inflation-linked bonds.

Uppbygging útlits

Row labels with commentary text

Helstu sjónrænir þættir

  • •Asset-class labels in left column
  • •Bold view heading per paragraph
  • •Disclosure footer
Síða 10
table

Global Equity Signals

Efni

Views grid for U.S., eurozone, Japan, EM and style tilts such as growth versus value, with four points of focus including overweight U.S. and small/mid-cap.

Uppbygging útlits

Signal grid with side panel

Helstu sjónrænir þættir

  • •Regional and Style group headers
  • •Dot markers with overweight/underweight legend
  • •Numbered focus panel
Síða 11
comparison

Global Equity Commentary

Efni

Region-by-region commentary: overweight U.S. on earnings strength, underweight Europe on energy headwinds, neutral Japan and neutral EM.

Uppbygging útlits

Row labels with commentary text

Helstu sjónrænir þættir

  • •Regional labels
  • •Bold view heading per paragraph
  • •Tactical-views disclaimer
Síða 12
comparison

Our Top Investment Views

Efni

Maps top views into themes such as U.S. Productivity Boom, EU Renaissance, Japan's Revival, Global Power/Electrification and AI Winners.

Uppbygging útlits

Themed card grid

Helstu sjónrænir þættir

  • •Theme cards with icons
  • •Country, global macro and market-specific groupings
  • •Overweight/underweight bullets
Síða 13
table

The Macro Narrative Highlights

Efni

Backdrop of resilient growth, sticky inflation, gradual Fed tightening and expansionary fiscal policy, leading to overweight equities, underweight duration and an oil supply shock as key risk.

Uppbygging útlits

Two stacked summary panels

Helstu sjónrænir þættir

  • •Macro Backdrop rows
  • •Market Views row for equities, credit and duration
  • •Highlighted Key Risk box
Síða 14
data visualization

A High Nominal Growth World

Efni

Line chart of consensus nominal GDP growth for 2025, 2026 and 2027, with the 2026 estimate rising toward roughly 5.8%.

Uppbygging útlits

Headline, subtitle and full-width line chart

Helstu sjónrænir þættir

  • •Three-line time series in blue shades
  • •Percent axis from 4.0% to 6.0%
  • •Source footnote
Síða 15
data visualization

Rate Recalibration Seeks Neutral

Efni

Compares Fed funds with nominal growth, noting that nominal growth is nearly 3% above the policy rate and past recessions followed over-tightening.

Uppbygging útlits

Headline, subtitle and line chart

Helstu sjónrænir þættir

  • •Fed funds versus nominal growth lines
  • •Shaded or flagged over-tightening periods
  • •Source footnote
Síða 16
data visualization

Global Growth Remains Solid

Efni

Shows S&P Global World Services and Manufacturing PMIs, with activity accelerating rather than slowing despite higher energy prices and rates.

Uppbygging útlits

Headline, subtitle and line chart

Helstu sjónrænir þættir

  • •Services and manufacturing PMI lines
  • •Date axis
  • •Source footnote
Síða 17
data visualization

Consumers Remain Resilient

Efni

Real core retail sales (control group, 3M moving average) keep growing despite the energy shock, with August sales beating expectations.

Uppbygging útlits

Headline, subtitle and line chart

Helstu sjónrænir þættir

  • •Single line chart from Jun 2022 to Jun 2026
  • •YoY percent axis
  • •Control group definition in footnote
Síða 18
data visualization

Labor Markets Show Directional Firming

Efni

Monthly net change in nonfarm payrolls, with headline prints choppy but trends firming once one-off impacts are excluded.

Uppbygging útlits

Paired bar charts with callouts

Helstu sjónrænir þættir

  • •Total nonfarm payrolls bars
  • •Payrolls ex Government, Leisure and Hospitality bars
  • •Two annotation callouts
Síða 19
data visualization

The Labor Market Is Not Overheating

Efni

Atlanta Fed wage growth and JOLTS-quit-rate-modelled wages show wage growth has stabilised even as labor demand firms.

Uppbygging útlits

Headline, subtitle and line chart

Helstu sjónrænir þættir

  • •Wage growth lines
  • •Model versus actual comparison
  • •Source footnote
Síða 20
data visualization

Strong Productivity Supports Growth

Efni

U.S. nonfarm productivity YoY stays healthy, supporting growth without reigniting inflation.

Uppbygging útlits

Headline, subtitle and multi-year line chart

Helstu sjónrænir þættir

  • •Productivity lines for 2026, 2023, 2020 and 2017
  • •Axis from -3 to 8
  • •Source footnote
Síða 21
data visualization

Inflation Above Targets but In Line

Efni

The Citi Inflation Surprise Index shows recent U.S. inflation releases have been in line with or slightly better than consensus.

Uppbygging útlits

Headline, subtitle and line chart

Helstu sjónrænir þættir

  • •Surprise index line around zero
  • •Axis from (40) to 80
  • •Source footnote
Síða 22
data visualization

Core PCE Versus Trimmed Mean

Efni

Core PCE has surged to 3.3%, but trimmed mean inflation points to persisting disinflationary pressure, with inflation concentrated in AI and tariff-related categories.

Uppbygging útlits

Two side-by-side charts

Helstu sjónrænir þættir

  • •Core PCE line chart
  • •Category breakdown chart
  • •Two-line headline
Síða 23
data visualization

Synchronized Tightening Priced In

Efni

Forwards price rate hikes from all four major central banks (Fed, ECB, BoJ, BoE) by mid-2027, driven by the energy shock.

Uppbygging útlits

Clustered column chart

Helstu sjónrænir þættir

  • •Columns for Current, Dec-26 and Jun-27
  • •Four central bank groups
  • •Policy rate axis 0% to 5%
Síða 24
data visualization

Oil Prices Contained, Pressure Building

Efni

Crude prices have been rangebound while inventories decline, with the main risk in refined products due to lost refining capacity.

Uppbygging útlits

Two side-by-side charts

Helstu sjónrænir þættir

  • •Oil spot price versus inventories chart
  • •Crude versus product price index chart
  • •Source footnote
Síða 25
data visualization

Europe's Outlook Tied to Energy

Efni

E.U. versus U.S. economic surprise moves with oil prices, and unusually low gas storage leaves Europe vulnerable entering winter.

Uppbygging útlits

Dual-chart page

Helstu sjónrænir þættir

  • •Surprise-versus-oil overlay chart
  • •Gas storage chart
  • •Source footnote
Síða 26
data visualization

AI and Tech Drive Asia's Export Boom

Efni

AI and tech exports account for roughly 70% of Asia's export growth, led by Taiwan packaging, Korean memory and Chinese optical modules.

Uppbygging útlits

Stacked column chart with line

Helstu sjónrænir þættir

  • •Monthly stacked columns Jan-23 to Aug-26
  • •AI/Tech versus Other exports
  • •Asia export YoY growth line
Síða 27
data visualization

China's Export Engine Enters a New Phase

Efni

China's manufacturing exports accelerate while imports lag, widening the trade surplus and marking a China Shock 2.0 period.

Uppbygging útlits

Long-run line chart with era labels

Helstu sjónrænir þættir

  • •Exports, imports and trade balance lines from 1991
  • •China Shock 1.0 and 2.0 annotations
  • •USD trillion axis
Síða 28
section divider

Bonds Divider

Efni

Section divider opening the Bonds part of the guide.

Uppbygging útlits

Title-only divider

Helstu sjónrænir þættir

  • •Section name over branded banner
  • •Guide title line
  • •Minimal layout
Síða 29
data visualization

The Lost Decade in U.S. Treasuries

Efni

Rolling 10-year annualised returns of the 10-year UST are near their lowest since the 1800s, but higher yields offer a more attractive starting point.

Uppbygging útlits

Headline, subtitle and long-history line chart

Helstu sjónrænir þættir

  • •Rolling 10-year CAGR line from 1800 to 2020
  • •Percent axis 0% to 16%
  • •Source footnote
Síða 30
data visualization

Term Premiums Point to Fed Expectations

Efni

The UST 10-year term premium has moved sideways over the past year, while Japan's has risen and the U.S. and Germany stay broadly stable.

Uppbygging útlits

Headline, subtitle and multi-line chart

Helstu sjónrænir þættir

  • •Term premium lines for U.S., Germany and Japan
  • •Percent axis
  • •Source footnote
Síða 31
data visualization

Higher Yields Reflect Stronger Nominal Growth

Efni

Two charts show 10-year UST yields reconnecting with nominal GDP running near 6% and nominal growth supporting S&P 500 EPS growth.

Uppbygging útlits

Two side-by-side line charts

Helstu sjónrænir þættir

  • •Nominal GDP versus 10-year yield from 1966
  • •Dual-axis EPS growth versus nominal GDP from 1992
  • •Diamond marker for latest nominal GDP
Síða 32
data visualization

Broad EM Value Has Compressed

Efni

EM sovereign spreads are near historical tights, while Brazil's high real rates stand out across local bond markets.

Uppbygging útlits

Two charts side by side

Helstu sjónrænir þættir

  • •EMBI spread percentile chart for IG and non-IG
  • •Local yield, inflation and real rate bars with diamonds
  • •Source footnote
Síða 33
data visualization

U.S. MBS as an Alternative to Corporate Credit

Efni

U.S. IG option-adjusted spreads are near historical tights, creating poor risk/reward versus MBS if growth slows.

Uppbygging útlits

Two charts side by side

Helstu sjónrænir þættir

  • •MBS and IG OAS lines
  • •MBS-IG spread versus output gap chart
  • •Source footnote
Síða 34
data visualization

European Core-Periphery Convergence

Efni

Spain and Portugal are expected to keep outgrowing EU peers while running a primary surplus, supporting continued peripheral spread tightening.

Uppbygging útlits

Scatter or bar chart with commentary

Helstu sjónrænir þættir

  • •2026-28 average primary balance versus real GDP growth
  • •Country-labelled points
  • •Source footnote
Síða 35
data visualization

High Yield Expensive Versus Credit Losses

Efni

High yield spreads remain tight relative to expected credit losses, leaving little margin of safety.

Uppbygging útlits

Dual-axis line chart

Helstu sjónrænir þættir

  • •Credit loss line on left axis
  • •HY OAS line on right axis in basis points
  • •Data from 2006 to 2026
Síða 36
section divider

Equities Divider

Efni

Section divider opening the Equities part of the guide.

Uppbygging útlits

Title-only divider

Helstu sjónrænir þættir

  • •Section name over branded banner
  • •Guide title line
  • •Minimal layout
Síða 37
data visualization

2026 YTD Upside Driven by Earnings, Not P/E

Efni

MSCI ACWI forward EPS is up 30% YTD while the forward P/E is down 14%, so returns reflect earnings rather than multiples.

Uppbygging útlits

Stacked column chart with line

Helstu sjónrænir þættir

  • •EPS, multiple and dividend contribution columns
  • •Cumulative YTD total return line
  • •Monthly axis 01/2026 to 09/2026
Síða 38
data visualization

2026-27 Earnings Revisions Skew to Growth/Tech

Efni

Growth/Tech leads EPS revisions up about 29% for CY2026 and about 19% for CY2027, with upgrades widening into cyclicals.

Uppbygging útlits

Two side-by-side bar charts

Helstu sjónrænir þættir

  • •CY2026 and CY2027 revision bars
  • •Growth/Tech, Cyclicals ex Energy, Defensives categories
  • •Source footnote
Síða 39
data visualization

AI Demand Accelerates With Agentic AI

Efni

OpenRouter token demand reached 113 trillion per week at end of August, up 25x YoY and 2x MoM.

Uppbygging útlits

Headline, subtitle and growth chart

Helstu sjónrænir þættir

  • •Weekly token volume chart
  • •Month axis 1-Sep to 1-Aug
  • •Trillions-of-tokens axis 0 to 120
Síða 40
data visualization

Nvidia Benefits From Surging AI Demand

Efni

Nvidia's revenue guidance of 70% growth for fiscal 2028 beat consensus expectations of 45%.

Uppbygging útlits

Combo column and line chart

Helstu sjónrænir þættir

  • •Trailing 12M revenue columns in millions
  • •YoY growth line on right axis
  • •Forecast period marked to Jan-28
Síða 41
data visualization

Cyclical Rebound or Data Deterioration?

Efni

Cyclicals have underperformed defensives since July after the U.S.-Iran MOU unraveled, though manufacturing data remains supportive.

Uppbygging útlits

Dual-axis line chart

Helstu sjónrænir þættir

  • •Cyclical minus defensive 12-month return line
  • •Global manufacturing PMI change line
  • •Data from 10/2012 to 10/2025
Síða 42
data visualization

Underweight Europe, Japan Most Attractive

Efni

European equities show weaker EPS growth and are the only market more expensive since the start of the Iran war.

Uppbygging útlits

Chart set with headline and subtitle

Helstu sjónrænir þættir

  • •Regional EPS and valuation charts
  • •Equities section tag
  • •Source footnote
Síða 43
data visualization

Upgrading Conviction in Japanese Banks

Efni

The forward market is warming to a 2% BoJ policy rate era, with higher rates and capital reforms expected to drive re-rating and ROE uplift.

Uppbygging útlits

Two charts with callout labels

Helstu sjónrænir þættir

  • •BoJ policy rate versus forward swap line
  • •Topix Banks forward P/B versus ROE
  • •We Are Here marker and NIRP annotations
Síða 44
data visualization

EM Semiconductor Premium Has Unwound

Efni

EM semiconductor forward P/E is back roughly in line with the rest of EM even as earnings continue to soar.

Uppbygging útlits

Two stacked line charts

Helstu sjónrænir þættir

  • •Semi versus ex-semi forward EPS rebased to 2010
  • •Semi versus ex-semi forward P/E
  • •ChatGPT Launched marker
Síða 45
data visualization

Underweight Indian Equities

Efni

India's forward EPS growth looks subpar versus EM while its P/E premium remains close to 100%.

Uppbygging útlits

Column chart with premium line

Helstu sjónrænir þættir

  • •India and EM EPS CAGR columns by period
  • •Median P/E premium line
  • •Modi term period labels
Síða 46
section divider

Alternatives Divider

Efni

Section divider opening the Alternatives part of the guide.

Uppbygging útlits

Title-only divider

Helstu sjónrænir þættir

  • •Section name over branded banner
  • •Guide title line
  • •Minimal layout
Síða 47
comparison

Private Markets: 4Q 2026 Positioning

Efni

Rates private equity Neutral to Positive and private credit Neutral, noting AI takes over two-thirds of U.S. VC dollars but under half of deals.

Uppbygging útlits

Rating labels with bulleted commentary

Helstu sjónrænir þættir

  • •Private Equity and Private Credit rating tags
  • •Bulleted commentary
  • •PIK definition in footnote
Síða 48
data visualization

Private Equity

Efni

Stable view as valuations reset and distributions lag, with AI accounting for 70% of VC deal value and PE distribution yield at 13.2% versus 5.4% for VC.

Uppbygging útlits

Rating grid, focus panel and two charts

Helstu sjónrænir þættir

  • •Shaded Buyout, Growth and Venture Capital rating grid
  • •Median EV/EBITDA clustered columns by deal size
  • •Distribution yield line chart
Síða 49
data visualization

Private Credit

Efni

Direct lending concerns are receding as the tech maturity wall extends and defaults stay concentrated in 2021 and 2022 vintages.

Uppbygging útlits

Rating grid, focus panel and two charts

Helstu sjónrænir þættir

  • •Ratings for Direct Lending, Real Estate Debt, Special Situations and ABS
  • •Tech loan maturity chart
  • •Default rates by LMM versus MM
Síða 50
data visualization

Infrastructure

Efni

Positive on Energy, selective on Digital and Transport, with a potential 38 GW shortage between 68 GW of power needed and grid supply for U.S. datacenters.

Uppbygging útlits

Rating grid, focus panel and two charts

Helstu sjónrænir þættir

  • •Ratings for Transport, Digital, Renewables and Power
  • •Waterfall chart of datacenter power shortfall
  • •Global EV/EBITDA multiples line
Síða 51
data visualization

Real Estate

Efni

Healthy fundamentals with selective sector and financing exposure: pipelines are declining and residential rent growth is reaccelerating.

Uppbygging útlits

Rating grid, focus panel and two charts

Helstu sjónrænir þættir

  • •Ratings for Industrial, Residential, Office and Retail
  • •Under-construction pipeline chart
  • •Rental growth YoY lines
Síða 52
section divider

Transition Divider

Efni

Section divider opening the Transition part of the guide, covering cash and short-duration assets.

Uppbygging útlits

Title-only divider

Helstu sjónrænir þættir

  • •Section name over branded banner
  • •Guide title line
  • •Minimal layout
Síða 53
table

Major Asset Classes Correlation Table

Efni

Correlation matrix across nine asset classes for the 5 and 10 years ended Oct 31, 2026, for example S&P 500 versus International at 0.83 over ten years.

Uppbygging útlits

Full-slide correlation matrix

Helstu sjónrænir þættir

  • •Purple upper triangle for 10-year values
  • •Grey lower triangle for 5-year values
  • •Legend for the two periods
Síða 54
section divider

Market Monitor Divider

Efni

Section divider titled Market Monitor - November 2026, opening the data appendix.

Uppbygging útlits

Title-only divider

Helstu sjónrænir þættir

  • •Section name over branded banner
  • •Date in title
  • •Minimal layout
Síða 55
data visualization

Sovereign Bond Yields

Efni

Bar charts compare 10-year yields for developed and emerging markets now, one month ago and 12 months ago.

Uppbygging útlits

Two side-by-side bar charts

Helstu sjónrænir þættir

  • •Developed Markets 10-year yield bars
  • •Emerging Markets 10-year yield bars
  • •Oct '26, 1 Mo. Ago and 12 Mo. Ago series
Síða 56
table

Key Rates

Efni

Table of money market and sovereign rates, with the 10-year Treasury at 4.91 versus 4.09 twelve months earlier.

Uppbygging útlits

Full-width data table

Helstu sjónrænir þættir

  • •Columns for Current, 12-Mo. Ago, Average, Minimum and Maximum
  • •SOFR, Treasury, Japan, Bund and Gilt rows
  • •Bloomberg index yield rows
Síða 57
data visualization

Monetary Policy

Efni

Central bank policy rates: Fed 4.00%, BOE 3.75%, BOJ 1.25% and ECB 2.65%, alongside market expectations and long-run history.

Uppbygging útlits

Charts with summary table

Helstu sjónrænir þættir

  • •Expected rate path columns by horizon
  • •Policy rate history since 1998
  • •Current versus 1-month and 12-month table
Síða 58
data visualization

U.S. Treasury Yields

Efni

Treasury yield curve and a yields-and-total-return table, with the 10-year at 4.91% and the 30-year at 5.29%.

Uppbygging útlits

Curve chart above data table

Helstu sjónrænir þættir

  • •Yield curve for Oct '26, 1-Mo. Ago and 12-Mo. Ago
  • •Yield and total return columns
  • •3-month to 30-year rows
Síða 59
table

Developed Market Currencies and Yields

Efni

Table of spot returns versus USD and EUR plus local interest rates for eleven currencies, with a long-run U.S. Dollar Index chart.

Uppbygging útlits

Matrix table with chart

Helstu sjónrænir þættir

  • •Spot return columns by horizon
  • •Local interest rate column
  • •U.S. Dollar Index line from 1970
Síða 60
table

Characteristics and Performance Analysis

Efni

Bond index table: the Bloomberg U.S. Aggregate shows a 5.24% yield to worst, 32 bps spread and 5.8-year duration, with returns from 1 month to 10 years.

Uppbygging útlits

Grouped data table

Helstu sjónrænir þættir

  • •Teal group header bands
  • •Averages and Total Returns column blocks
  • •U.S. High Grade, High Yield, EM and Global rows
Síða 61
data visualization

Spread Analysis (bps)

Efni

Spread ranges for Aggregate, MBS, ABS, CMBS, Corporate, Preferred, Loans, EM and High Yield, with most maximum spreads dated March 2020.

Uppbygging útlits

Range chart with date table

Helstu sjónrænir þættir

  • •Ten-year spread range bars
  • •Max and Min Spread Date rows
  • •12/31/25 and 12/31/24 spread rows
Síða 62
table

Corporate Bond Market Update: Quality Detail

Efni

Corporate index table by rating: U.S. IG yields 5.79% at a 90 bps spread, while U.S. High Yield yields 8.30% at 344 bps.

Uppbygging útlits

Grouped data table

Helstu sjónrænir þættir

  • •AAA to BBB and BB to CCC rows
  • •Averages and Total Returns blocks
  • •Group headers
Síða 63
data visualization

Corporate Bond Market Update: Spreads and Defaults

Efni

HY corporate spread is 344 bps versus 294 a year ago, with the HY annual default rate at 1.95% and loans at 0.55%.

Uppbygging útlits

Bar charts with summary tables

Helstu sjónrænir þættir

  • •Average spread bars for HY, Loans and IG
  • •Annual default rate bars
  • •Current, 1-Mo. Ago, 12-Mo. Ago and Median tables
Síða 64
table

Municipal Bond Market Update: Index Table

Efni

Municipal table showing the Bloomberg Municipal Bond Index at a 4.21% yield to worst, with rating, maturity and high yield sub-indices.

Uppbygging útlits

Grouped data table

Helstu sjónrænir þættir

  • •AAA to BBB rating rows
  • •5-year to 22+ year rows
  • •High Yield Municipal sector rows
Síða 65
data visualization

Municipal Bond Market Update: Ratios and Spreads

Efni

AAA muni-to-Treasury yield ratios of 63, 69 and 91 for 5Y, 10Y and 30Y, plus credit quality spreads versus AAA.

Uppbygging útlits

Two charts with data tables

Helstu sjónrænir þættir

  • •Yield ratio history from 2016
  • •AA, A and BBB spread bars
  • •Current, 1-Mo. Ago, 12-Mo. Ago and Median tables
Síða 66
data visualization

Emerging Markets Bond Market Update

Efni

EM debt table and charts: the EMBI Global Diversified yields 7.09% with a 208 bps average spread, versus a 352 bps median.

Uppbygging útlits

Index table above three charts

Helstu sjónrænir þættir

  • •Sovereign, corporate and local EMD summary boxes
  • •Index table with returns to 10Y
  • •Three history charts from 2016
Síða 67
data visualization

Local Sovereign Currency Yields

Efni

Bar charts of one-year local interest rates, current versus one year prior, for eleven developed and fourteen emerging market currencies.

Uppbygging útlits

Two side-by-side bar charts

Helstu sjónrænir þættir

  • •Developed market rate bars
  • •Emerging market rate bars
  • •Current versus 1 yr prior series
Síða 68
data visualization

Asset Class Return Analysis: Bonds

Efni

Annual return rankings for bond asset classes from 2016 to YTD 2026, from high yield and EM local to Treasuries and bank loans.

Uppbygging útlits

Ranked quilt chart by year

Helstu sjónrænir þættir

  • •Year columns from 2016 to YTD 2026
  • •Colour-coded asset class cells ranked high to low
  • •Index definitions in footnote
Síða 69
data visualization

Performance: Market Barometer

Efni

Heat maps of 1-month, 1-year and 3-year returns by size and style, for example Large Cap Value at 28.67% over one year versus Large Cap Growth at -2.59%.

Uppbygging útlits

Three heat-map grids with legend

Helstu sjónrænir þættir

  • •Value, Core and Growth grids by cap size
  • •Global, U.S., International and EM tiles
  • •Six-step colour scale legend
Síða 70
data visualization

Dividend Yields and Volatility Analysis

Efni

Historical and current dividend yields for equity indices versus the 10-year Treasury at 4.91%, with S&P 500 correlation and VIX history.

Uppbygging útlits

Four-panel chart grid

Helstu sjónrænir þættir

  • •Historical yield lines
  • •Current yield bars
  • •Correlation and VIX line charts
Síða 71
data visualization

Valuation Analysis: Regions and Styles

Efni

Current NTM P/E versus 10-year high, low and average for major regional and style indices, with high and low dates.

Uppbygging útlits

Range bars with date table

Helstu sjónrænir þættir

  • •High-low range bars with current and average markers
  • •MSCI World reference line
  • •High Date and Low Date rows
Síða 72
data visualization

Valuation Analysis: S&P 500 Sectors

Efni

Current NTM P/E versus 10-year high, low and average for each S&P 500 sector, shown with high and low dates.

Uppbygging útlits

Range bars with date table

Helstu sjónrænir þættir

  • •Eleven sector range bars
  • •S&P 500 current P/E reference
  • •Not to scale note
Síða 73
data visualization

Corporate Earnings Growth

Efni

Expected versus 2025 EPS growth by region, style and S&P 500 sector, shown as paired horizontal bars.

Uppbygging útlits

Two paired bar charts

Helstu sjónrænir þættir

  • •Regions/Styles bars
  • •S&P 500 Sectors bars
  • •Expected and 2025 EPS growth series
Síða 74
data visualization

S&P 500 Index: 1-Month Return Analysis

Efni

Breakdown of the S&P 500's -0.9% one-month return by earnings growth, market cap, P/E, beta, ROE and dividend yield buckets.

Uppbygging útlits

Six small bar charts

Helstu sjónrænir þættir

  • •Six factor panels
  • •S&P 500 reference bar in each
  • •Bucketed ranges in legend
Síða 75
data visualization

S&P 500 Index: YTD Analysis

Efni

The same six factor breakdowns applied to the S&P 500's 11.8% year-to-date return.

Uppbygging útlits

Six small bar charts

Helstu sjónrænir þættir

  • •Six factor panels
  • •S&P 500 reference bar in each
  • •Bucketed ranges in legend
Síða 76
data visualization

Index Sectors: Return Analysis

Efni

Sector return bars for the S&P 500 and MSCI World over 1 month and 1 year.

Uppbygging útlits

Two side-by-side bar charts

Helstu sjónrænir þættir

  • •S&P 500 sector bars
  • •MSCI World sector bars
  • •1 month and 1 year series
Síða 77
table

Current Characteristics and Sector Weights

Efni

Comparison table of ten equity indices (e.g. 503 S&P 500 holdings, 18.35 NTM P/E) with sector weights such as Information Technology at 30% of the S&P 500.

Uppbygging útlits

Characteristics table with weights

Helstu sjónrænir þættir

  • •Index columns from S&P 500 to MSCI Asia Pac
  • •Holdings, valuation and growth rows
  • •Sector weight percentages
Síða 78
table

Asset Class Return Analysis: Equities

Efni

Return table for U.S., global and sector equities, e.g. S&P 500 +11.77% YTD, Russell 1000 Value +24.50% and Russell 1000 Growth -0.17%.

Uppbygging útlits

Grouped return table

Helstu sjónrænir þættir

  • •U.S. Equities, Global Equities and Sectors groups
  • •1-Mo. to 10Y plus 2021-2025 columns
  • •Alternating row shading
Síða 79
data visualization

Asset Class Return Analysis: Calendar Years

Efni

Annual equity style and region return rankings from 2016 to YTD 2026.

Uppbygging útlits

Ranked quilt chart by year

Helstu sjónrænir þættir

  • •Year columns 2016 to YTD 2026
  • •Ranked cells for small-cap, growth, value, EM and more
  • •Index definitions in footnote
Síða 80
table

Commodities Return Analysis

Efni

Commodity sub-index returns: the Bloomberg Commodity Index is up 32.75% YTD and 36.57% over one year, with Brent crude up 151.52% YTD.

Uppbygging útlits

Grouped return table

Helstu sjónrænir þættir

  • •Agriculture, energy and metals sub-index groups
  • •1-Mo. to 5Y columns
  • •Individual commodity rows
Síða 81
data visualization

Asset Class Return Analysis: Alternatives

Efni

Annual return rankings for hedge fund strategies, MLPs and commodities from 2016 to YTD 2026, as of 9/30/2026 with a one-month lag on YTD data.

Uppbygging útlits

Ranked quilt chart by year

Helstu sjónrænir þættir

  • •Year columns 2016 to YTD 2026
  • •Colour-coded strategy cells
  • •Index definitions in footnote
Síða 82
data visualization

Digital Assets: Growth and Correlation

Efni

Growth of $10K for Bitcoin, Ethereum and Solana indices from 7/1/2021, with a correlation table across S&P 500, Nasdaq, Gold, DXY, U.S. Agg and Bitcoin.

Uppbygging útlits

Bar chart beside correlation matrix

Helstu sjónrænir þættir

  • •Growth of $10K horizontal bars
  • •Six-asset correlation matrix
  • •5-year and since-2016 periods
Síða 83
comparison

Digital Assets: Small Allocations Can Impact Portfolios

Efni

Hypothetical comparison of a 60/40 portfolio with 1% and 3% Bitcoin added, across return, volatility and Sharpe ratio for 1 to 10 years.

Uppbygging útlits

Three comparison tables

Helstu sjónrænir þættir

  • •Return, Sharpe ratio and volatility blocks
  • •60/40, 1% Bitcoin and 3% Bitcoin rows
  • •1, 3, 5 and 10 year columns
Síða 84
table

Fund and ETF Flows by Category

Efni

Top and bottom ten mutual fund and ETF categories by monthly flows, with Nontraditional Bond leading mutual fund inflows at $1,647MM and Large Blend seeing -$23,027MM.

Uppbygging útlits

Four ranked flow tables

Helstu sjónrænir þættir

  • •Top 10 and Bottom 10 mutual fund tables
  • •Top 10 and Bottom 10 ETF tables
  • •1 Mo., 3 Mo. and 12 Mo. flow columns
Síða 85
data visualization

Major Asset Class Return Analysis

Efni

Annual return rankings for major asset classes and a diversified Asset Allocation portfolio (25% S&P 500, 25% U.S. Aggregate and others), 2016 to YTD 2026.

Uppbygging útlits

Ranked quilt chart by year

Helstu sjónrænir þættir

  • •Year columns 2016 to YTD 2026
  • •Colour-coded asset class cells
  • •Portfolio weights in footnote
Síða 86
conclusion

Portfolio Solutions Group

Efni

Introduces the multi-asset Portfolio Solutions Group, led by CIO Jim Caron, and its ten-person team.

Uppbygging útlits

Intro text beside headshot grid

Helstu sjónrænir þættir

  • •Ten portrait photos
  • •Name and title captions
  • •Descriptive text column
Síða 87
conclusion

Asset Allocation Committee

Efni

Describes the independent Asset Allocation Committee of senior MSIM and Eaton Vance professionals that vets the Portfolio Solutions Group's ideas.

Uppbygging útlits

Description with name roster

Helstu sjónrænir þættir

  • •Committee member list with titles
  • •Description text block
  • •Header and footer system
Síða 88
disclosure

Index Definitions

Efni

Glossary defining indices used in the guide, from the Bloomberg Commodity Index to the Bloomberg U.S. Aggregate Index.

Uppbygging útlits

Text-only glossary

Helstu sjónrænir þættir

  • •Bold index names
  • •Definition paragraphs
  • •Single-column text
Síða 89
disclosure

Index Definitions, Terms and About Risk

Efni

Continues index definitions with MSCI, Morningstar LSTA, Nikkei 225, Russell and S&P indices.

Uppbygging útlits

Text-only glossary

Helstu sjónrænir þættir

  • •Index name and definition paragraphs
  • •Single-column text
  • •Header and footer system
Síða 90
disclosure

Risk Considerations

Efni

Standard risk disclosures covering equity, foreign, EM, fixed income and alternative investment risks, stating that diversification does not eliminate the risk of loss.

Uppbygging útlits

Two-column disclosure text

Helstu sjónrænir þættir

  • •Dense two-column legal text
  • •Bold key warnings
  • •Title with header rule
Síða 91
disclosure

Distribution and Legal Notices

Efni

Copyright, redistribution restrictions and issuing-entity notices for MSIM affiliates, including the EMEA section.

Uppbygging útlits

Text-only disclosure

Helstu sjónrænir þættir

  • •Legal paragraphs
  • •Regional heading
  • •Footer with page number
Síða 92
disclosure

Asia Pacific Notices

Efni

Closing regional disclosures for Hong Kong, Singapore and Australia.

Uppbygging útlits

Text-only disclosure

Helstu sjónrænir þættir

  • •ASIA PACIFIC heading
  • •Country-by-country legal paragraphs
  • •Footer with page number

Algengar spurningar

Algengar spurningar um þessa glæru og undirliggjandi kynningarefni.

What does this presentation cover?

It is Morgan Stanley Investment Management's The BEAT, a Quarterly Global Market and Asset Allocation Guide for Q4 2026 - November. It spans Top Views, Bonds, Equities, Alternatives, Transition and a Market Monitor of data tables and charts.

How many pages is the deck and what format is it?

The deck has 92 pages in 4:3 (720x540) format, made in PowerPoint.

Who is this deck suited for?

It suits investment strategists, wealth managers, advisors and research teams who produce market outlooks or asset allocation reviews. It is also a useful study example for analysts and presentation designers.

How are the charts and tables laid out?

Most commentary pages use a headline, a one-sentence subtitle, a titled chart and a source footnote. The Market Monitor uses full-width tables, heat maps and ranked quilt charts of annual returns.

Does the deck include allocation views?

Yes. Pages 6, 8 and 10 show grids that rate assets from high conviction underweight to high conviction overweight, with dot markers, a change-from-previous arrow and numbered Points of Focus.

Can I reuse the structure for my own quarterly report?

Yes. The contents page, section dividers, colour-coded section tags, chart pages, data tables and closing disclosure pages can be swapped for your own content and data.

Does it include disclosures and index definitions?

Yes. Pages 88 to 92 contain index definitions, risk considerations, distribution notices and Asia Pacific notices, and most chart pages carry source and disclaimer footnotes.

Is the content investment advice?

No. The slides state the views are those of the portfolio management team, may change, and are not an investment or research recommendation. Treat the deck as an example of structure and design.

Heimildir og frekari lesning

  • The BEAT — Morgan Stanley Investment Management

    Publisher's series page for this quarterly market and asset allocation guide.

2slides

Create Your Own Slides

Turn your ideas into professional presentations in seconds with 2slides AI.

Búðu til glærur á heimsmælikvarða á nokkrum sekúndum

Sæktu innblástur í faglega hönnun, veldu þinn stíl og búðu til glærur með fullkominni textabirtingu. Knúið af Nano Banana—byrjaðu að búa til kynninguna þína núna.

2Slides logo

Þinn AI-þjónn fyrir glærur. Sparaðu tíma, skín hraðar með snjallri kynningargerð.

Draga saman með AI

ChatGPTClaudeGrokPerplexity
Öll þjónusta í gangi

Vörur

Eiginleikar

Safn

Sniðmát

Samþættingar

Auðlindir

Samanburður

© 2026 2slides. Allur réttur áskilinn.