
Hluti af safninu Dæmi um fjárfestakynningar · Dæmi um japanskar fjárfestakynningar
Kyocera H1 FY2026 Earnings Presentation (fiscal year ending March 2027): first-half results to September 2026, a raised full-year sales forecast, segment performance, one-time items and shareholder returns, presented by President and CEO Shiro Sakushima on November 2, 2026. This is a Japanese-language deck published on TDnet, the Tokyo Stock Exchange's timely disclosure system.
Notar forsíðu þessarar kynningar sem stílfyrirmynd fyrir glærur úr þínu eigin efni. Eða veldu hvaða síðu sem er hér fyrir neðan og notaðu uppsetningu hennar sem fyrirmynd.
Flýtileiðsögn
Merki
Deila glærunum
Kyocera H1 FY2026 Earnings Presentation (fiscal year ending March 2027): first-half results to September 2026, a raised full-year sales forecast, segment performance, one-time items and shareholder returns, presented by President and CEO Shiro Sakushima on November 2, 2026. This is a Japanese-language deck published on TDnet, the Tokyo Stock Exchange's timely disclosure system.
Ítarleg sýn á hverja glærusíðu, þar á meðal útlit, lykilefni og sjónræna þætti.
Title page for Kyocera's first-half earnings briefing (2027年3月期 上期 決算説明会) dated November 2, 2026, presented by Shiro Sakushima, Representative Director, President and CEO, with a forward-looking statements caution referring readers to the last page.
Large blue diagonal triangle over a grey triangle on white; Kyocera logo top left, disclaimer text top right, date and presenter name bottom right, Japanese company name bottom left.
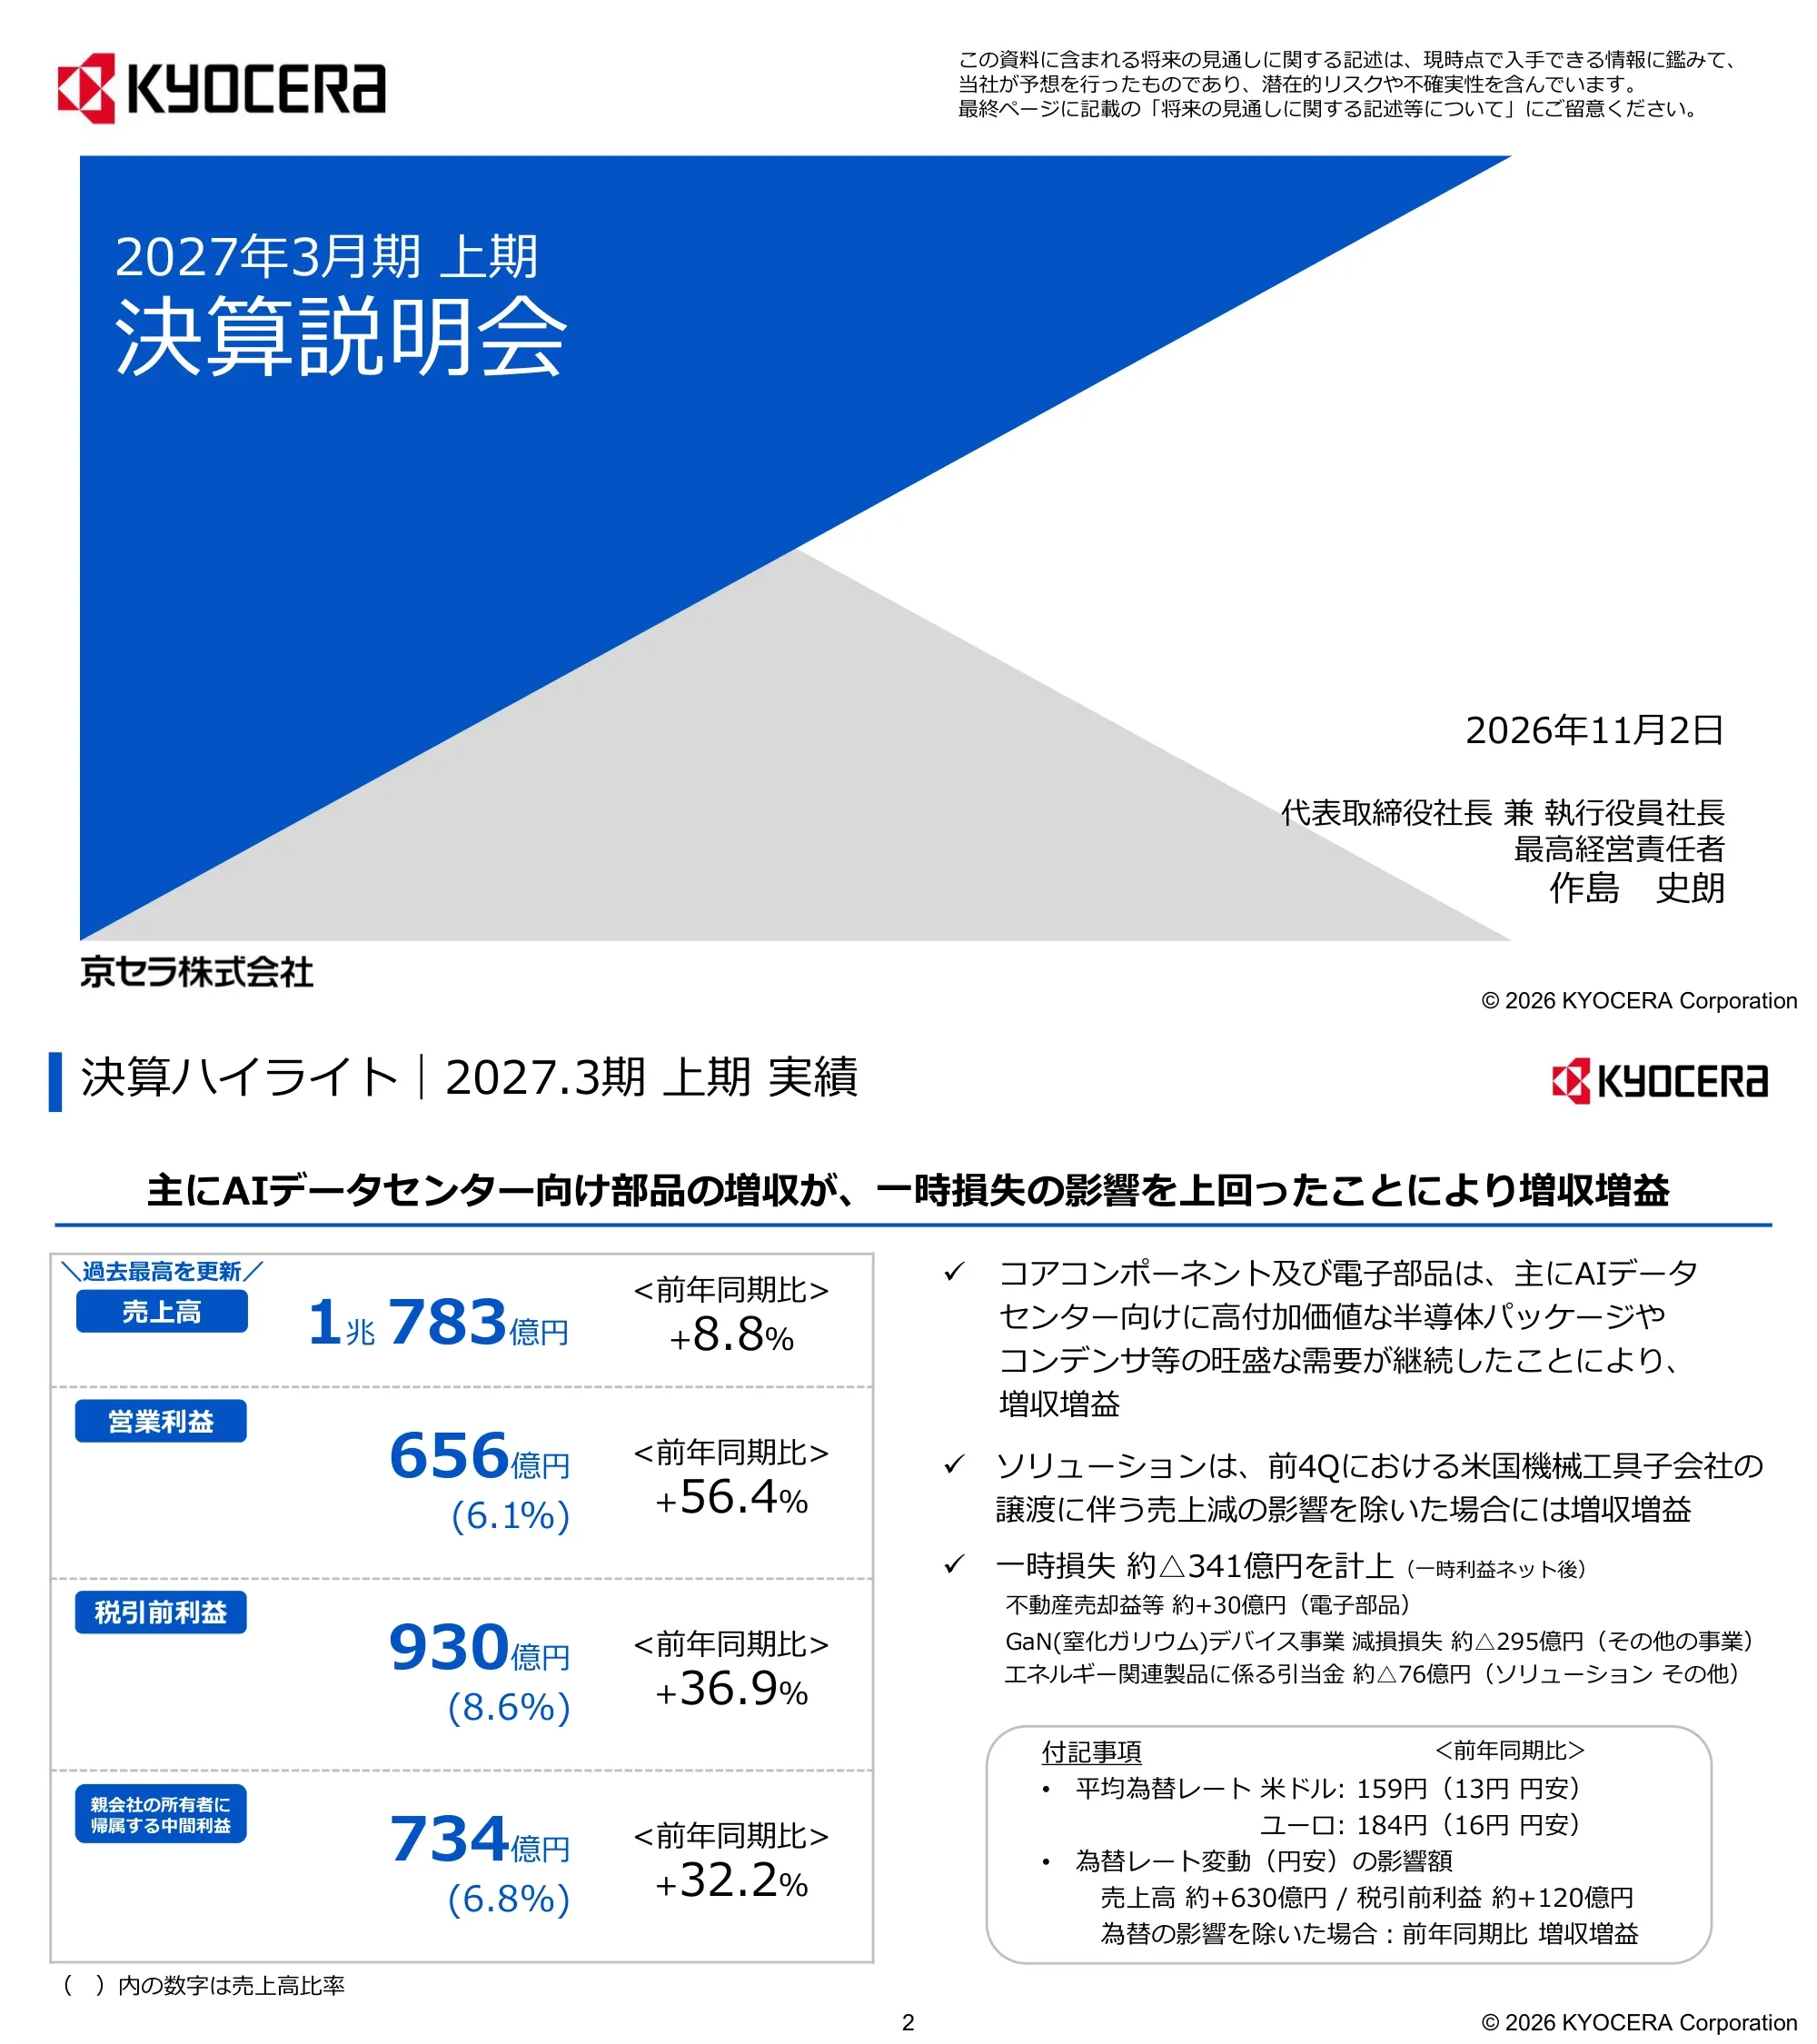
Headline: sales and profit rose because higher sales of AI data-center components outweighed one-time losses. Record sales of 1兆783億円 (+8.8%), operating profit 656億円 (6.1% margin, +56.4%), pre-tax profit 930億円 (8.6%, +36.9%) and profit attributable to owners 734億円 (6.8%, +32.2%). Core Components and Electronic Components grew on strong demand for high-value semiconductor packages and capacitors; Solutions grew excluding the sale of a US machine-tool subsidiary. One-time losses net of gains were about 341億円: real-estate gains +30億円, GaN device impairment −295億円, energy-product provision −76億円. Average rates were US$1 = ¥159 (¥13 weaker yen) and €1 = ¥184 (¥16 weaker); the weaker yen added about 630億円 to sales and 120億円 to pre-tax profit, and results still rose excluding currency effects.
Two-column layout: left KPI panel with four stacked metric rows (blue label pill, large blue figure, margin in parentheses, year-on-year change); right column with checkmark bullets and a rounded notes box on exchange rates.
Full-year sales forecast raised to a record 2兆1,200億円, up 400億円 from the July forecast, because demand for AI and semiconductor-related components beat expectations and is expected to stay firm from Q3. Profit targets are unchanged: operating profit 1,600億円 (7.5%), pre-tax profit 2,000億円 (9.4%), net profit attributable to owners 1,600億円 (7.5%), ROE 4.9%. Profit growth in each business plus a gain of about 150億円 from selling the chemical business to Sumitomo Bakelite (booked in Semiconductor Components and already in the forecast) offsets the first-half one-time losses. FX assumptions unchanged at US$1 = ¥155 and €1 = ¥180.
Same two-column highlight format as page 2 with five KPI rows (sales, operating profit, pre-tax profit, net profit, ROE) on the left and checkmark commentary plus a notes box on the right.
Left: the first plant at the Nagasaki Isahaya Plant was completed in September 2026, with about 680億円 to be invested by the year ending March 2028, making fine ceramic parts for chip-making equipment and ceramic semiconductor packages; equipment is being installed in stages, full production starts spring 2027 and output is targeted at 250億円 a year from the year ending March 2031. Right: a carbide-tool recycling system that recovers tungsten carbide with Kyocera's own shortened amino-acid process, with a new domestic smelting facility due to start in the year ending March 2031; the plan is certified by Japan's Ministry of Economy, Trade and Industry as a critical-mineral supply-security plan.
Split page: left has a four-row specification table above an aerial photo of the new factory; right has a heading, bullets and a circular recycling diagram with product photos linked by arrows.
Agenda in three parts: 1) H1 results overview for the year ending March 2027, 2) full-year forecast, 3) supplementary reference materials.
Minimal agenda page with three large numbered items, numbers in blue, on a white background.
Section divider introducing the first-half results for the year ending March 2027.
Section divider with a large title and blue section number above a thin blue rule.
Table in millions of yen comparing H1 of the prior year with this year: sales 991,385 to 1,078,337 (+8.8%); operating profit 41,945 to 65,609 (+56.4%, margin 4.2% to 6.1%); pre-tax profit 67,950 to 93,020 (+36.9%); profit attributable to owners 55,540 to 73,430 (+32.2%). Average US dollar rate ¥146 to ¥159, euro ¥168 to ¥184. Capex fell 7.7% to 81,897, depreciation rose 2.9% to 56,154 and R&D was flat at 57,184.
Financial comparison table with grey prior-year column, highlighted blue current-year column and change columns (amount and rate); ratios to sales shown in parentheses.
Breakdown of one-time items in operating and pre-tax profit: prior-year loss of about 21億円 on selling the silicon diode and power semiconductor business; this year real-estate sale income of about +30億円 (Electronic Components), GaN device impairment of about −295億円 (Other businesses) and an energy-product provision of about −76億円 (Solutions). Totals were about −21億円 last year and −341億円 this year, a −320億円 swing; after tax the impact on net profit is about −313億円 (−298億円 year on year). The impairment covers goodwill and some intangibles from the January 2021 acquisition of a US GaN laser developer, written down because commercialization in automotive and electronics will take longer than planned; the business will continue with a stronger organization.
Upper table listing four numbered one-time items across three columns with highlighted totals; lower three-row table explaining the impaired asset, reason and next steps.
Segment sales in millions of yen: Core Components 368,173 (+19.7%, 34.1% of sales), including Industrial & Automotive 134,073 (+12.8%) and Semiconductor Components 221,144 (+24.7%); Electronic Components 215,282 (+23.2%); Solutions 503,784 (−2.9%), where Industrial Tools fell 32.0% to 106,815 after the US subsidiary sale while Document Solutions rose 12.3% to 248,186 and Communications 8.2% to 106,898; Other businesses 7,575. Total 1,078,337 (+8.8%).
Segment table with sub-unit rows indented under three main segments; prior-year, current-year and change columns with composition ratios.
Business profit in millions of yen: Core Components 50,473 (13.7% margin, +68.1%), with Industrial & Automotive 19,209 and Semiconductor Components 31,480; Electronic Components 19,598 (9.1%) from 17 a year earlier; Solutions 56,999 (11.3%, +50.9%), including Industrial Tools 19,164, Document Solutions 29,634 and Communications 7,891; Other businesses −43,589 including the GaN impairment. Total business profit 83,481 (+49.8%), corporate items 9,539, pre-tax profit 93,020 (+36.9%). Footnotes flag the 76億円 provision and 295億円 impairment.
Same table format as page 9 showing profit and ratio to sales, with footnote markers on affected rows.
Sales and profit rose on higher sales of semiconductor packages for AI data centers and fine ceramic parts for chip-making equipment. H1 sales 3,077億円 to 3,682億円 (+19.7%); business profit 300億円 to 505億円 (+68.1%), margin 9.8% to 13.7%. Quarterly sales climbed from 1,618億円 to 1,901億円 (+6.7% quarter on quarter in Q2); quarterly profit reached 267億円 at a 14.0% margin (+11.8%). The organic materials business for semiconductor parts reached a double-digit margin through productivity gains.
Four-quadrant chart page: half-year sales and profit bar charts on top, five-quarter bar charts below, each with blue commentary headings for year-on-year and quarter-on-quarter changes; profit charts overlay a margin line.
Sales and profit rose mainly on AI data-center demand for small high-capacitance MLCCs and tantalum capacitors. H1 sales 1,747億円 to 2,153億円 (+23.2%); business profit rose by 196億円 from 0.2億円 to 196億円 (9.1% margin). Quarterly sales grew from 908億円 to 1,116億円 (+7.7% in Q2); quarterly profit 108億円 at 9.7% (+23.2%). Productivity at the KYOCERA AVX Components group improved with technical support from Kyocera.
Same four-quadrant bar-and-line chart layout as page 11.
Sales fell because of the completed sale of the US machine-tool subsidiary (about 707億円 less sales), but profit rose on better profitability across businesses despite a one-time loss. H1 sales 5,190億円 to 5,038億円 (−2.9%); business profit 378億円 to 570億円 (+50.9%), margin 7.3% to 11.3%. Q2 sales 2,562億円 (+3.4% on seasonal gains in Communications and Document Solutions); Q2 profit 267億円 (10.4%), down 12.1% quarter on quarter because of the 76億円 provision. The prior-year Q4 figure of 459億円 includes a gain of about 170億円 from the subsidiary sale.
Same four-quadrant chart layout, with a footnote explaining the Q4 one-time gain.
Interim dividend ¥28 per share (+¥3), forecast year-end dividend ¥28 (+¥1) and annual dividend ¥56 (+¥4); annual dividends went 50, 50, 52 and 56 yen over four years. From this year Kyocera uses dividend on equity (DOE) as its dividend metric and has adopted a progressive dividend policy. A ¥250 billion (2,500億円) buyback was approved in April 2026; by the end of September about 49 million shares worth about 1,780億円 had been repurchased. In June 2026 Kyocera sold about 54 million KDDI shares worth about 1,250億円 into KDDI's self-tender offer and will keep reducing cross-shareholdings.
Left: three dividend rows with call-out boxes for increases and a stacked bar chart of dividends per share; right: buyback and cross-shareholding sections with large blue figures.
Section divider introducing the forecast for the fiscal year ending March 2027.
Section divider with a large title and blue section number above a thin blue rule.
Forecast table in millions of yen comparing last year with the July and November forecasts: sales 2,070,203 to 2,080,000 (July) to 2,120,000 (November, +40,000 vs July); operating profit 118,138 to 160,000; pre-tax profit 168,994 to 200,000; net profit attributable to owners 140,969 to 160,000; EPS ¥102.70 to ¥122.04 (July) and ¥123.62 (November). FX assumption US$1 = ¥155 and €1 = ¥180 (last year ¥151 and ¥175). Capex 225,000 (from 149,099), depreciation 120,000 and R&D 120,000.
Forecast table with grey prior-year column, two highlighted blue forecast columns and change columns versus last year and versus the previous forecast.
Segment sales forecast in millions of yen: Core Components raised to 731,000 (+15,000 vs July), with Semiconductor Components up to 430,000 and Industrial & Automotive at 273,000; Electronic Components raised to 430,000 (+15,000); Solutions raised to 974,800 (+10,000), with Industrial Tools at 190,000, Document Solutions 490,000 and Communications 200,000; Other businesses 15,000. Total 2,120,000 (+40,000).
Wide segment table with prior-year, July forecast, November forecast and change columns, including composition ratios.
Segment profit forecast in millions of yen: Core Components raised to 112,000 (15.3% margin, +13,000), including Semiconductor Components 73,500 with the chemical-business sale gain; Electronic Components raised to 40,000 (9.3%, +14,000); Solutions raised to 99,000 (10.2%, +5,000) though its Other line falls to 7,000 because of the energy provision; Other businesses lowered to −58,000 (−32,000) because of the GaN impairment. Total business profit stays 193,000 and pre-tax profit 200,000 (9.4%).
Same wide table format as page 17 with three footnotes on one-time items.
As new President and CEO, Sakushima held town-hall meetings with the CFO for section managers and younger and mid-career employees to understand on-site issues and share the company's direction. From April 16 to October 5, 2026, 995 people took part across 15 sites: 833 managers at 11 sites (head office and main plants) and 162 younger and mid-career staff at 4 sites (head office, Tokyo office and others).
Left: one large and two small event photos; right: blue headline, short paragraph and a three-row participation table.
Section divider for the reference appendix, with a note that from this fiscal year element-technology research previously in Other businesses is managed under corporate items, and prior-year figures on page 22 are restated on the same basis.
Section divider with a large title, blue number, thin blue rule and a footnote at the bottom.
Bilingual quarterly sales table in millions of yen for two fiscal years. Prior year total 2,070,203 (quarters 478,038 / 513,347 / 530,611 / 548,207); this year Q1 525,383 and Q2 552,954. Core Components Q2 190,092, Semiconductor Components Q2 115,038, Electronic Components Q2 111,637, Solutions Q2 256,157, Industrial Tools Q2 49,973 (after the US subsidiary sale), Document Solutions Q2 126,094.
Dense quarterly data grid with Japanese and English row labels, grey prior-year header and blue current-year header; Q3, Q4 and full-year cells for this year are blank.
Quarterly business profit in millions of yen. Core Components Q1 23,826 and Q2 26,647; Electronic Components 8,782 and 10,816; Solutions 30,333 and 26,666; Other businesses −6,323 and −37,266 (the GaN impairment). Total business profit Q1 56,618 and Q2 26,863; pre-tax profit Q1 74,891 and Q2 18,129. Prior-year full-year pre-tax profit 168,994, restated for the new corporate-item classification.
Same bilingual quarterly grid as page 21, adding total business profit, corporate gains and pre-tax profit rows.
Quarterly orders in millions of yen. Total orders Q1 568,514 and Q2 589,501, compared with 503,166 and 515,898 a year earlier (prior full year 2,098,265). Core Components orders rose to 202,190 in Q2 (Semiconductor Components 116,867) and Electronic Components to 135,524, pointing to continued component demand.
Bilingual quarterly grid matching pages 21–22.
Quarterly capex in millions of yen by segment: total Q1 27,173 and Q2 54,724, against a prior-year total of 149,099. Core Components spent 41,600 in Q2, the bulk of the increase, consistent with the Nagasaki Isahaya plant build-out.
Short six-row bilingual quarterly grid with white space below.
Quarterly depreciation in millions of yen: total Q1 28,019 and Q2 28,135, against a prior-year total of 110,924. Core Components about 10,300 a quarter, Electronic Components about 8,000 to 8,200 and Solutions about 6,350.
Six-row bilingual quarterly grid matching page 24.
Quarterly R&D in millions of yen: total Q1 27,701 and Q2 29,483, against a prior-year total of 115,701. Solutions is the largest spender at about 8,700 to 8,900 a quarter; Other businesses rose to 6,441 in Q2.
Six-row bilingual quarterly grid matching pages 24–25.
Disclaimer that forward-looking statements involve known and unknown risks, listing 22 factors including economic conditions, exchange rates, competition, raw-material supply and prices, production delays, R&D outcomes, acquisitions, talent, cyber attacks, intellectual property, regulation, climate change, pandemics and conflicts, natural disasters, credit risk, impairment of fixed assets and goodwill, deferred taxes and accounting changes. Kyocera does not undertake to update them.
Centered title above a bordered text box with a numbered list of 22 risk factors.
Closing slide with the Kyocera logo and the Japanese company name.
Centered logo on white with the company name below and copyright at the bottom.
Algengar spurningar um þessa glæru og undirliggjandi kynningarefni.
The original deck is in Japanese. It is Kyocera's first-half earnings briefing material (決算説明会資料) for the fiscal year ending March 2027, published on TDnet, the Tokyo Stock Exchange's timely disclosure system, and presented on November 2, 2026. This page summarises every slide in English while keeping the company's own yen units such as 億円 (¥100 million) and millions of yen.
Kyocera's fiscal year runs from April to March. The slides label the year ending March 2027 as 2027.3期, and the English appendix calls it Fiscal 2027. This gallery names it FY2026 after the calendar year in which it starts, matching earlier Japanese entries. H1 covers April to September 2026.
Sales reached a record 1兆783億円 (about ¥1.08 trillion), up 8.8%. Operating profit rose 56.4% to 656億円, pre-tax profit rose 36.9% to 930億円 and profit attributable to owners rose 32.2% to 734億円, despite about 341億円 of one-time losses.
AI data-center demand. Core Components sales grew 19.7% on semiconductor packages and fine ceramic parts for chip-making equipment, and Electronic Components sales grew 23.2% on small high-capacitance MLCCs and tantalum capacitors. Electronic Components profit rose from almost zero to 196億円.
Yes. The sales forecast was raised by 400億円 to a record 2兆1,200億円. Profit targets were kept at 1,600億円 operating profit, 2,000億円 pre-tax profit and 1,600億円 net profit, with ROE of 4.9%, because profit gains and a 150億円 gain on selling the chemical business offset the first-half losses.
A GaN device business impairment of about 295億円, covering goodwill and intangibles from a 2021 acquisition of a US GaN laser company, and a provision of about 76億円 for energy-related products in Solutions, partly offset by about 30億円 of real-estate gains.
The annual dividend forecast is ¥56 per share (interim ¥28, year-end ¥28), up ¥4, under a new progressive dividend and DOE policy. Kyocera also approved a 2,500億円 buyback and had bought back about 49 million shares worth about 1,780億円 by the end of September 2026.
Yes. The original PDF can be downloaded from this page. Its structure (highlight pages, segment chart pages, forecast tables and a quarterly appendix) works well as a model for a half-year results presentation, and you can recreate a similar layout with 2Slides.
Original Japanese-language presentation filed on the Tokyo Stock Exchange timely disclosure system.

Create Your Own Slides
Turn your ideas into professional presentations in seconds with 2slides AI.
Sæktu innblástur í faglega hönnun, veldu þinn stíl og búðu til glærur með fullkominni textabirtingu. Knúið af Nano Banana—byrjaðu að búa til kynninguna þína núna.
Þinn AI-þjónn fyrir glærur. Sparaðu tíma, skín hraðar með snjallri kynningargerð.


© 2026 2slides. Allur réttur áskilinn.