
Hluti af safninu Dæmi um fjárfestakynningar · Dæmi um indverskar fjárfestakynningar
Hitachi Energy India Q2 FY27 Earnings Presentation — The 16-slide analyst conference call deck from Hitachi Energy India Ltd (NSE: POWERINDIA, BSE scrip code 543187), dated 12 November 2026 and filed with BSE and NSE (the Indian stock exchanges), covering July–September 2026 results with revenue of Rs 2,996.5 Crs, Operational EBITDA of Rs 494.4 Crs and an order backlog of Rs 33,335.4 Crs.
Notar forsíðu þessarar kynningar sem stílfyrirmynd fyrir glærur úr þínu eigin efni. Eða veldu hvaða síðu sem er hér fyrir neðan og notaðu uppsetningu hennar sem fyrirmynd.
Flýtileiðsögn
Merki
Deila glærunum
Hitachi Energy India Q2 FY27 Earnings Presentation — The 16-slide analyst conference call deck from Hitachi Energy India Ltd (NSE: POWERINDIA, BSE scrip code 543187), dated 12 November 2026 and filed with BSE and NSE (the Indian stock exchanges), covering July–September 2026 results with revenue of Rs 2,996.5 Crs, Operational EBITDA of Rs 494.4 Crs and an order backlog of Rs 33,335.4 Crs.
Ítarleg sýn á hverja glærusíðu, þar á meðal útlit, lykilefni og sjónræna þætti.
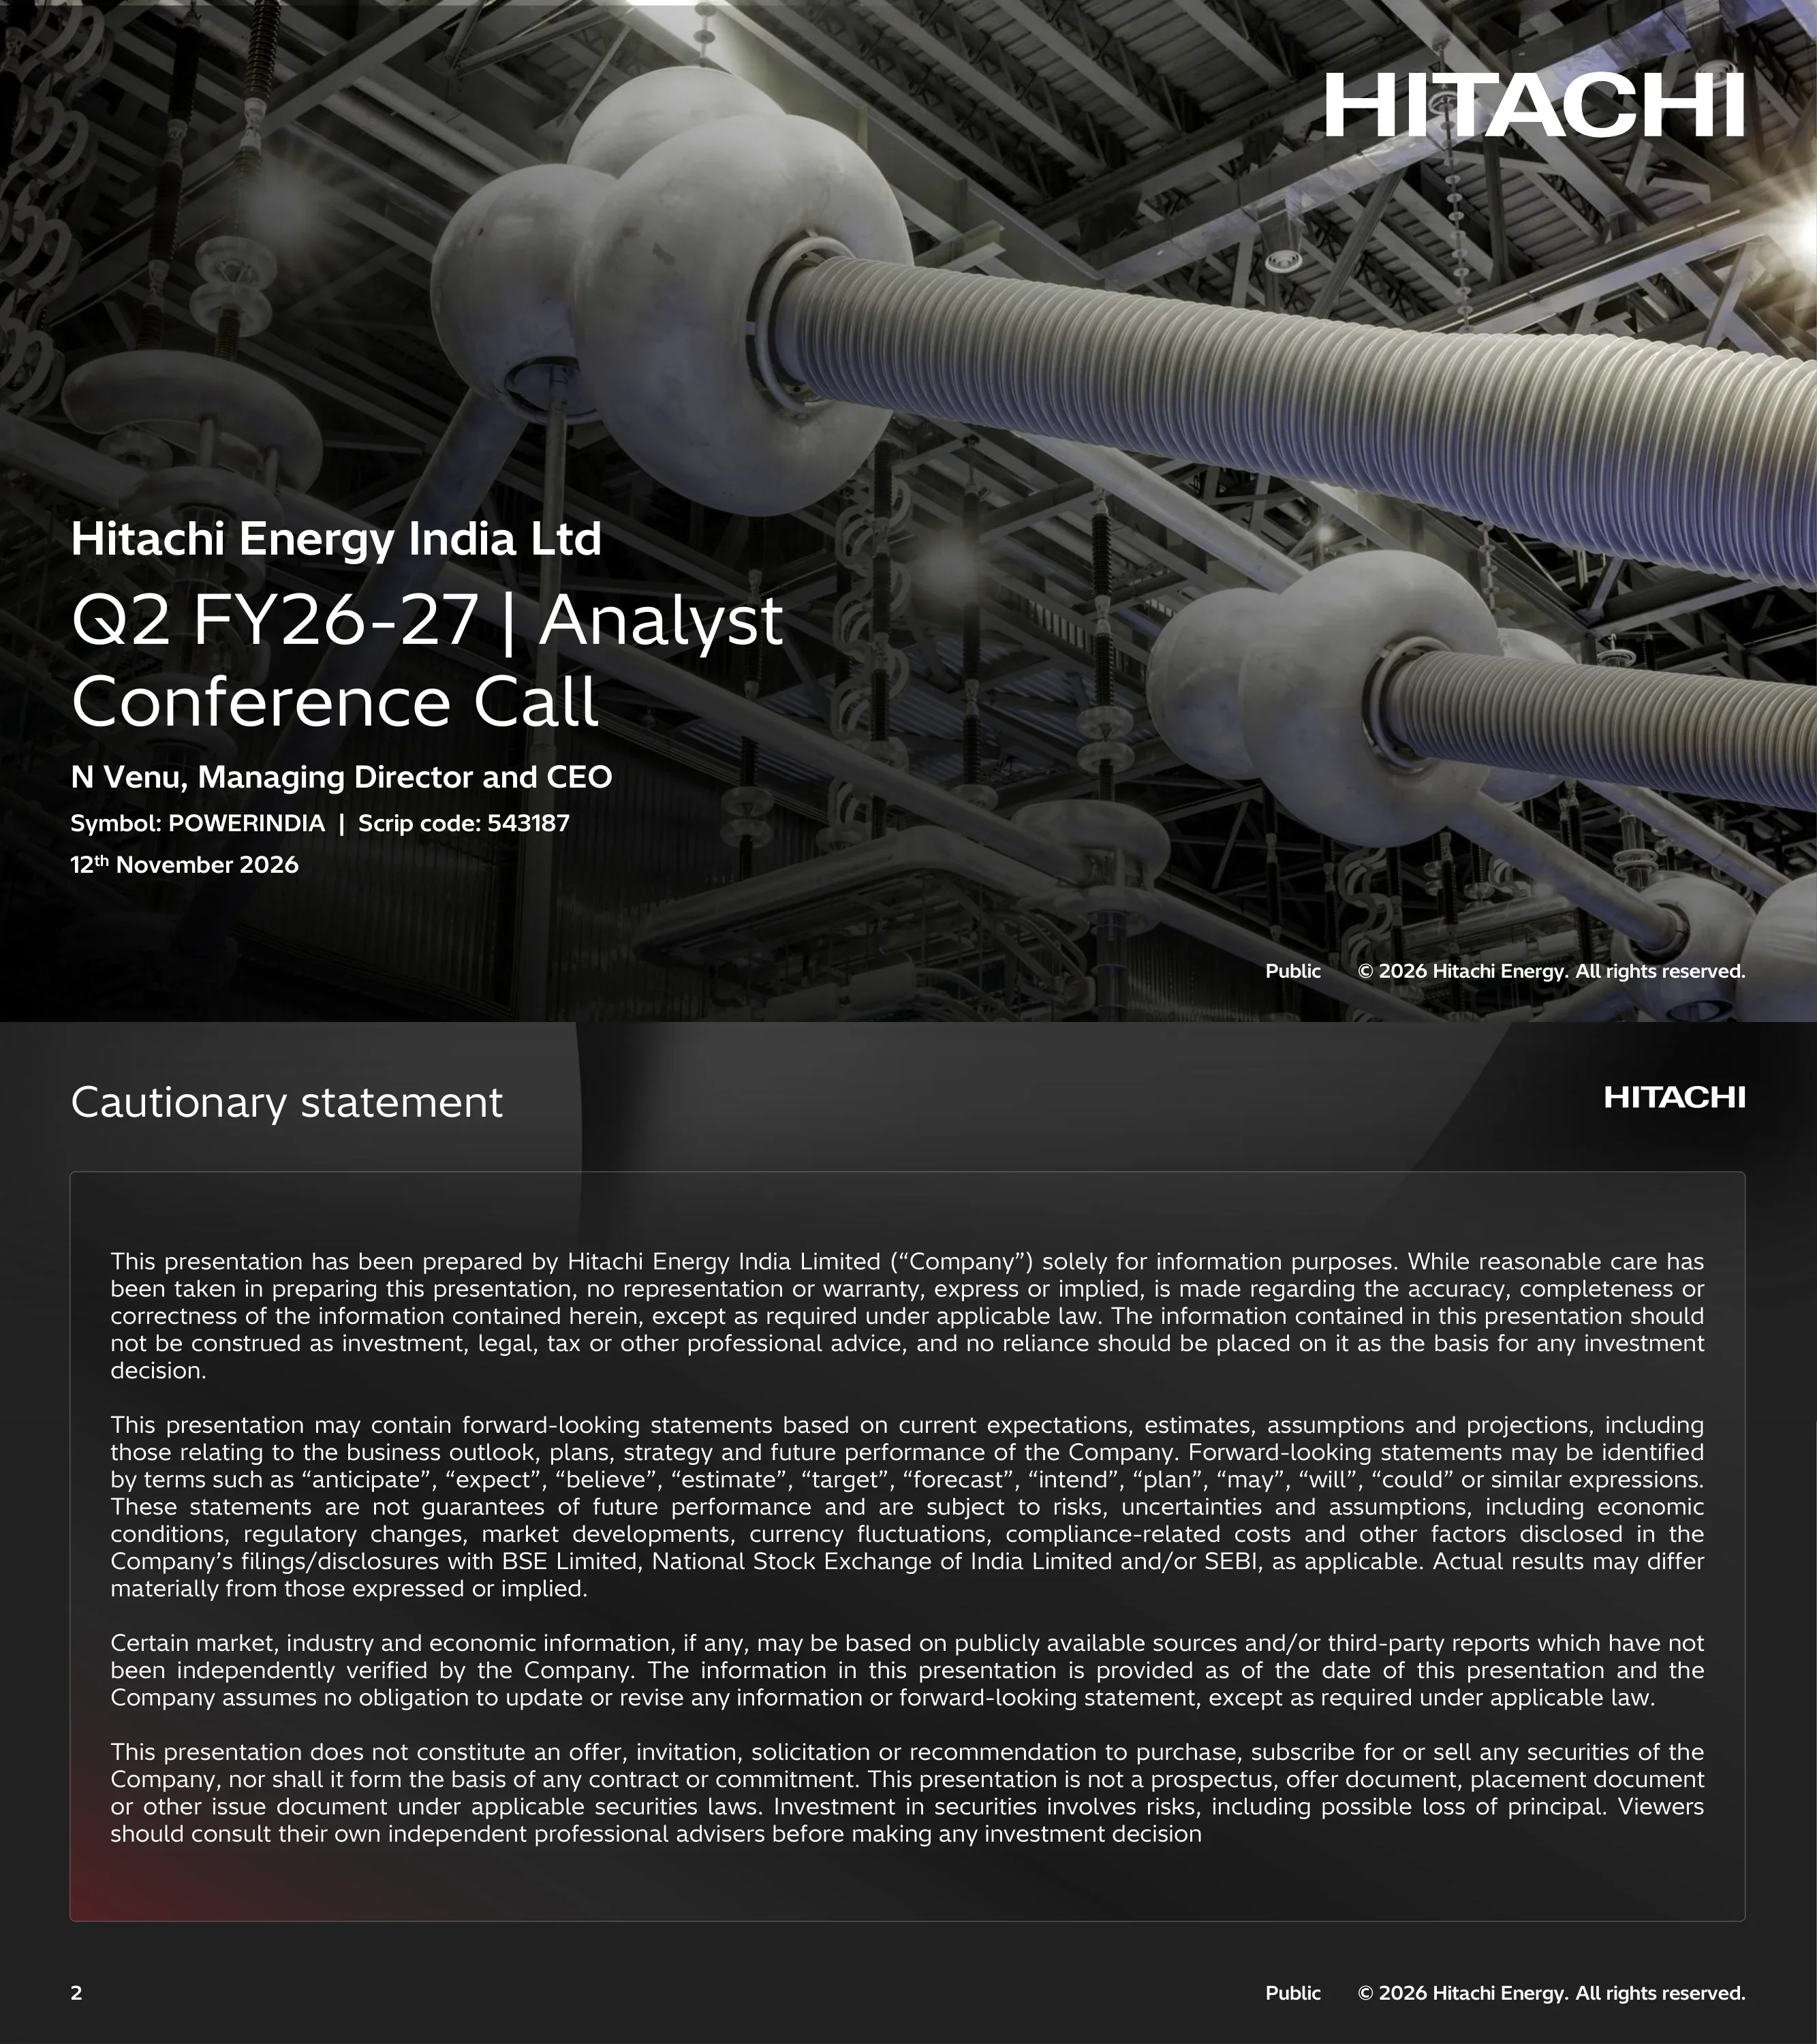
Title slide for Hitachi Energy India Ltd's Q2 FY26-27 analyst conference call, presented by N Venu, Managing Director and CEO. Shows symbol POWERINDIA, scrip code 543187 and the date 12 November 2026.
Full-bleed dark photograph of high-voltage bushings with the Hitachi logo top right; company name, title, presenter and listing details stacked at bottom left.
Standard disclaimer stating the presentation is for information only, may contain forward-looking statements subject to risks and uncertainties, refers to the Company's filings with BSE Limited, National Stock Exchange of India Limited and/or SEBI, and is not an offer or solicitation to buy or sell securities.
Title at top left; a single large rounded text panel holding four justified paragraphs.
Safety, Integrity and Quality KPIs: TRIFR (total recordable injury frequency rate) YTD of 0.10 against a target of 0.09; zero Non-Conformance Reports open and overdue; 1100+ lifesaving rules inspections; 98.75% of high risk hazards closed on time; 2000+ Safety Observation Tours performed.
Two columns of large-number KPI callouts with short captions on the left and centre; a three-arrow circular Safety, Integrity, Quality graphic on the right.
Planet: 74% CO2 reduction (86% excl. SF6) against a 50% target, 100% clean energy operations, 10% freshwater reduction against a 25% target, 99.59% of waste processed for recycling. People: zero-harm safety commitment and 10% gender diversity against a 16-18% target. Principle: zero-incident corruption commitment. CRISIL ESG score 69 in Sep'26 vs 61 in 2025; Peenya won an FKCCI Awards 2026 award for Excellence in Waste Management.
Three side-by-side tables (Planet, People, Principle) with icons, and a bottom band with the CRISIL ESG rating and an awards photo. Footnote: reduction targets vs 2019; waste means waste sent to landfill or incineration.
Growth drivers and catalysts: renewable capacity in India reached 299.25 GW in H1FY27 (33% of the 900 GW non-fossil target by 2036); PM Dhara GEC Phase III approves Rs 1.86 lakh cr (out of 7.93 lakh cr) to connect 135 GW of renewables including 50 Gwh of BESS; a 1150 kV system approved at about Rs 68,816 crs; data-centre electricity demand could reach 17 GW by 2031-32; draft SHANTI nuclear rules; Rs 1 lakh Crs of investment commitments under Semicon 2.0.
Subtitle line, then a two-column table with red pill headers (Growth drivers, Grid investment catalysts), six rows with icons, and numbered source links at the bottom.
Q2FY27 (Rs Crs): orders with HVDC 4,120.8 (+85.9% YoY, -19.1% QoQ); revenue 2,996.5 (+63.5% YoY); PBT 430.4; PAT 318.5; Op. EBITDA 494.4 (+69.5% YoY) at a 16.5% margin; order backlog 33,335.4 (+13.3% YoY). H1FY27 revenue 5,490.2 (+65.8%). Right panel lists Q2 order wins in transformers, grid automation, data centers, service and high voltage (Khavda South-Olpad HVDC project, 22 x 420 kV GIS bays).
Left: KPI table with green and red arrows for growth. Right: bordered panel 'Orders in Q2FY27' with five checkmarked bullets. The slide's own table prints 9.217.3 and 33.335.4 with periods as separators; slide 12 shows 9,217.3.
Four project showcases: Fatehgarh III STATCOM (first Grid Forming STATCOM in India, 400kV, 2x 550MVAR); grid automation for a leading utility, the largest pooling substation in the Southern Region, designed to evacuate 10.5 GW with 4.5 GW already connected, dedicated to the nation in August 2026; a 33/220 kV AIS main receiving substation at Pallet Plant 2.0, Sandur, Karnataka; and a 220 KV switchyard extension at Kalinganagar, Jajpur, Odisha.
Four columns, each with a coloured title block, one or two site photos and a bullet or text block of scope details.
Nine capacity projects: Karjan greenfield large power transformer; Savli high voltage factory expansion and GIS feeder factory; Mysuru insulation factory expansion; Halol dry bushing factory; Maneja power transformer factory expansion; Peenya grid automation, expansion, refurbishment and localization; Chennai HVDC and power electronics expansion; Mysuru ultra low carbon pressboard expansion; Doddaballapura capacitor factory expansion. Banner: majority of capex will complete by 2028.
3x3 grid of cards, each with a site name, scope line and a red progress bar (no percentages shown), and a full-width red banner at the bottom.
Four engagement highlights: India-Japan Annual Summit in the presence of the Prime Minister of India and the Prime Minister of Japan; CIGRE 2026, bringing global energy leaders, partners and customers together; engagement with the Tamil Nadu Chief Minister on shifts in India's clean energy future and talent demand; and hosting GEC Surat B. Tech students at Vadodara's Energy Technology Experience Center.
2x2 grid, each cell a photo beside a grey caption box with a bold heading.
Key segments growth: transmission (excl. HVDC), industries and data center up; railway and metro, and renewables (wind and solar) down. Order mix Q2FY26 to Q2FY27: Product 74% to 60%, Project 19% to 34%, Service 7% to 7%; Utilities 96% to 38%, Industries 2% to 34%, Transport & Infra 2% to 28%; DEU 87% to 62%, EPC 5% to 19%, OEM 6% to 16%, Dis 2% to 3%. Sector and channel data are domestic orders only.
Left: segment list with green or red arrows. Right: panel with three paired bar charts (Segment, Sector, Channel) comparing grey Q2FY26 bars with red Q2FY27 bars.
Service orders grew 77.1% in Q2 (Q2FY26 to Q2FY27) and 36.4% in H1; export orders grew 41.0% in Q2 and 184.4% in H1. Service wins include digitally enabled services and SLAs, augmentation and extension service, and orders including a major semiconductor customer. Exports came from Asia, Africa, the Middle East, Europe and the USA including a TenneT order. Bar heights have no absolute values in Rs Crs.
Two stacked sections (Service, Exports), each with two paired bar charts with growth arrows on the left and checkmark bullets on the right.
Rs Crs table: revenue from operations Q2FY27 2,996.5 vs Q2FY26 1,832.6 (+63.5%) and Q1FY27 2,493.7; PBT 430.4 (14.4% margin vs 19.3%); PAT 318.5 (10.6% vs 14.4%); Op EBITDA 494.4 (16.5% vs 15.9%); H1FY27 revenue 5,490.2 vs 3,311.5, Op EBITDA 894.3 (16.3% vs 13.9%). Footnote defines Operational EBITDA and states a notional loss of Rs 88.1 Crores for the quarter ended Sept 30, 2026 from unrealized FX movements.
Full-width table with columns Q2FY27, Q2FY26, YoY%, Q1FY27, QoQ%, H1FY27, H1FY26, YoY%, followed by a long footnote block with the last line in red.
Income statement in Rs Crs with percent of revenue for 3 months ended 30.09.2026, 30.06.2026, 30.09.2025, 6 months ended 30.09.2026 and 30.09.2025, and year ended 31.03.2026. For the quarter to 30.09.2026: revenue 2,996.5, total income 3,053.3, material costs 1,849.5 (61.7%), personnel 186.7, other expenses 497.9, total expenses 2,622.9, profit before tax 430.4, tax 111.9, profit for the quarter 318.5 (10.6%). Year ended 31.03.2026 profit 987.8.
Dense full-slide table with a light header row and paired Crs and % columns for six periods, grouped into Income and Expenses.
Markets: strengthen the core (renewables, utilities, HVDC, industries and transport); harness new segments (data centers, BESS, semiconductor); drive exports, service and digital. Business: strengthen BU service offerings; operational excellence including AI adoption; convert backlog into revenue and margin growth; capacity expansions. Function: reinforce safety culture, drive productivity and cost discipline, upskill workforce, build capacities for long growth.
Three outlined columns (Markets, Business, Function) with bullet-style lines over a darkened office photo.
Question and answer divider slide with the heading Q&A. No figures.
Full-bleed photo of a worker in a hard hat and safety glasses assembling equipment; large title at top left.
Closing contact slide naming Priyanka Bhagat, Investor Relation, with the email address priyanka.bhagat@hitachienergy.com.
Photo of a person with a tablet on the left; translucent contact card on the right.
Algengar spurningar um þessa glæru og undirliggjandi kynningarefni.
It covers Q2 FY26-27 (the three months ended 30 September 2026) and H1 FY27, with comparisons to Q2 FY26, Q1 FY27 and H1 FY26. It was presented at an analyst conference call on 12 November 2026.
Indian companies use a fiscal year from April to March. FY27 (shown as FY26-27) runs April 2026 to March 2027, so Q2 FY27 is July to September 2026 and H1 FY27 is April to September 2026.
Revenue from operations was Rs 2,996.5 Crs (+63.5% YoY), Operational EBITDA was Rs 494.4 Crs at a 16.5% margin, PBT was Rs 430.4 Crs and PAT was Rs 318.5 Crs. Orders including HVDC were Rs 4,120.8 Crs (+85.9% YoY) and the order backlog was Rs 33,335.4 Crs.
It was filed with BSE and NSE, the Indian stock exchanges, under symbol POWERINDIA and scrip code 543187, by Hitachi Energy India Ltd.
It has 16 slides: title, cautionary statement, safety KPIs, ESG progress, market drivers, results and orders, project execution, capacity expansion, stakeholder engagement, order mix charts, export and service growth, financial performance and statement tables, priorities, Q&A and an investor contact slide.
For domestic orders it compares Q2FY26 with Q2FY27. Project orders rose from 19% to 34% of the mix while product orders fell from 74% to 60%. Industries rose from 2% to 34% of the sector mix, and EPC rose from 5% to 19% of the channel mix.
Nine projects are listed, including Karjan (greenfield large power transformer), Savli, Halol, Maneja, Peenya, Chennai (HVDC and power electronics), Doddaballapura and two at Mysuru. The slide states the majority of capex will complete by 2028.
The deck is presented here as 16 slide images that follow the original 16-slide presentation. The last slide lists Priyanka Bhagat, Investor Relation, as the contact.

Create Your Own Slides
Turn your ideas into professional presentations in seconds with 2slides AI.
Sæktu innblástur í faglega hönnun, veldu þinn stíl og búðu til glærur með fullkominni textabirtingu. Knúið af Nano Banana—byrjaðu að búa til kynninguna þína núna.
Þinn AI-þjónn fyrir glærur. Sparaðu tíma, skín hraðar með snjallri kynningargerð.


© 2026 2slides. Allur réttur áskilinn.