
Hluti af safninu Dæmi um fjárfestakynningar
Frasers Logistics & Commercial Trust (FLCT, SGX: BUOU) FY2026 Results Presentation, lodged with SGX on 2026-11-06, covering the financial year ended 30 September 2026 (October 2025 to September 2026). The 47-page deck reports FY2026 DPU of 5.90 Singapore cents (FY2025: 5.95), total distributable income of S$224.4 million, revenue of S$494.1 million (+4.8%) and adjusted net property income of S$347.6 million (+6.6%). It also covers the 2HFY26 distribution of 2.95 Singapore cents, a 118-property portfolio valued at S$7.2 billion across Australia, Germany, Singapore, the UK and the Netherlands, 96.2% occupancy, a 4.9-year WALE, aggregate leverage of 39.2%, FY2026 rent reversions of 10.4% (incoming vs outgoing) and 24.0% (average vs average), ESG results and market data for each country.
Notar forsíðu þessarar kynningar sem stílfyrirmynd fyrir glærur úr þínu eigin efni. Eða veldu hvaða síðu sem er hér fyrir neðan og notaðu uppsetningu hennar sem fyrirmynd.
Flýtileiðsögn
Merki
Deila glærunum
Frasers Logistics & Commercial Trust (FLCT, SGX: BUOU) FY2026 Results Presentation, lodged with SGX on 2026-11-06, covering the financial year ended 30 September 2026 (October 2025 to September 2026). The 47-page deck reports FY2026 DPU of 5.90 Singapore cents (FY2025: 5.95), total distributable income of S$224.4 million, revenue of S$494.1 million (+4.8%) and adjusted net property income of S$347.6 million (+6.6%). It also covers the 2HFY26 distribution of 2.95 Singapore cents, a 118-property portfolio valued at S$7.2 billion across Australia, Germany, Singapore, the UK and the Netherlands, 96.2% occupancy, a 4.9-year WALE, aggregate leverage of 39.2%, FY2026 rent reversions of 10.4% (incoming vs outgoing) and 24.0% (average vs average), ESG results and market data for each country.
Ítarleg sýn á hverja glærusíðu, þar á meðal útlit, lykilefni og sjónræna þætti.
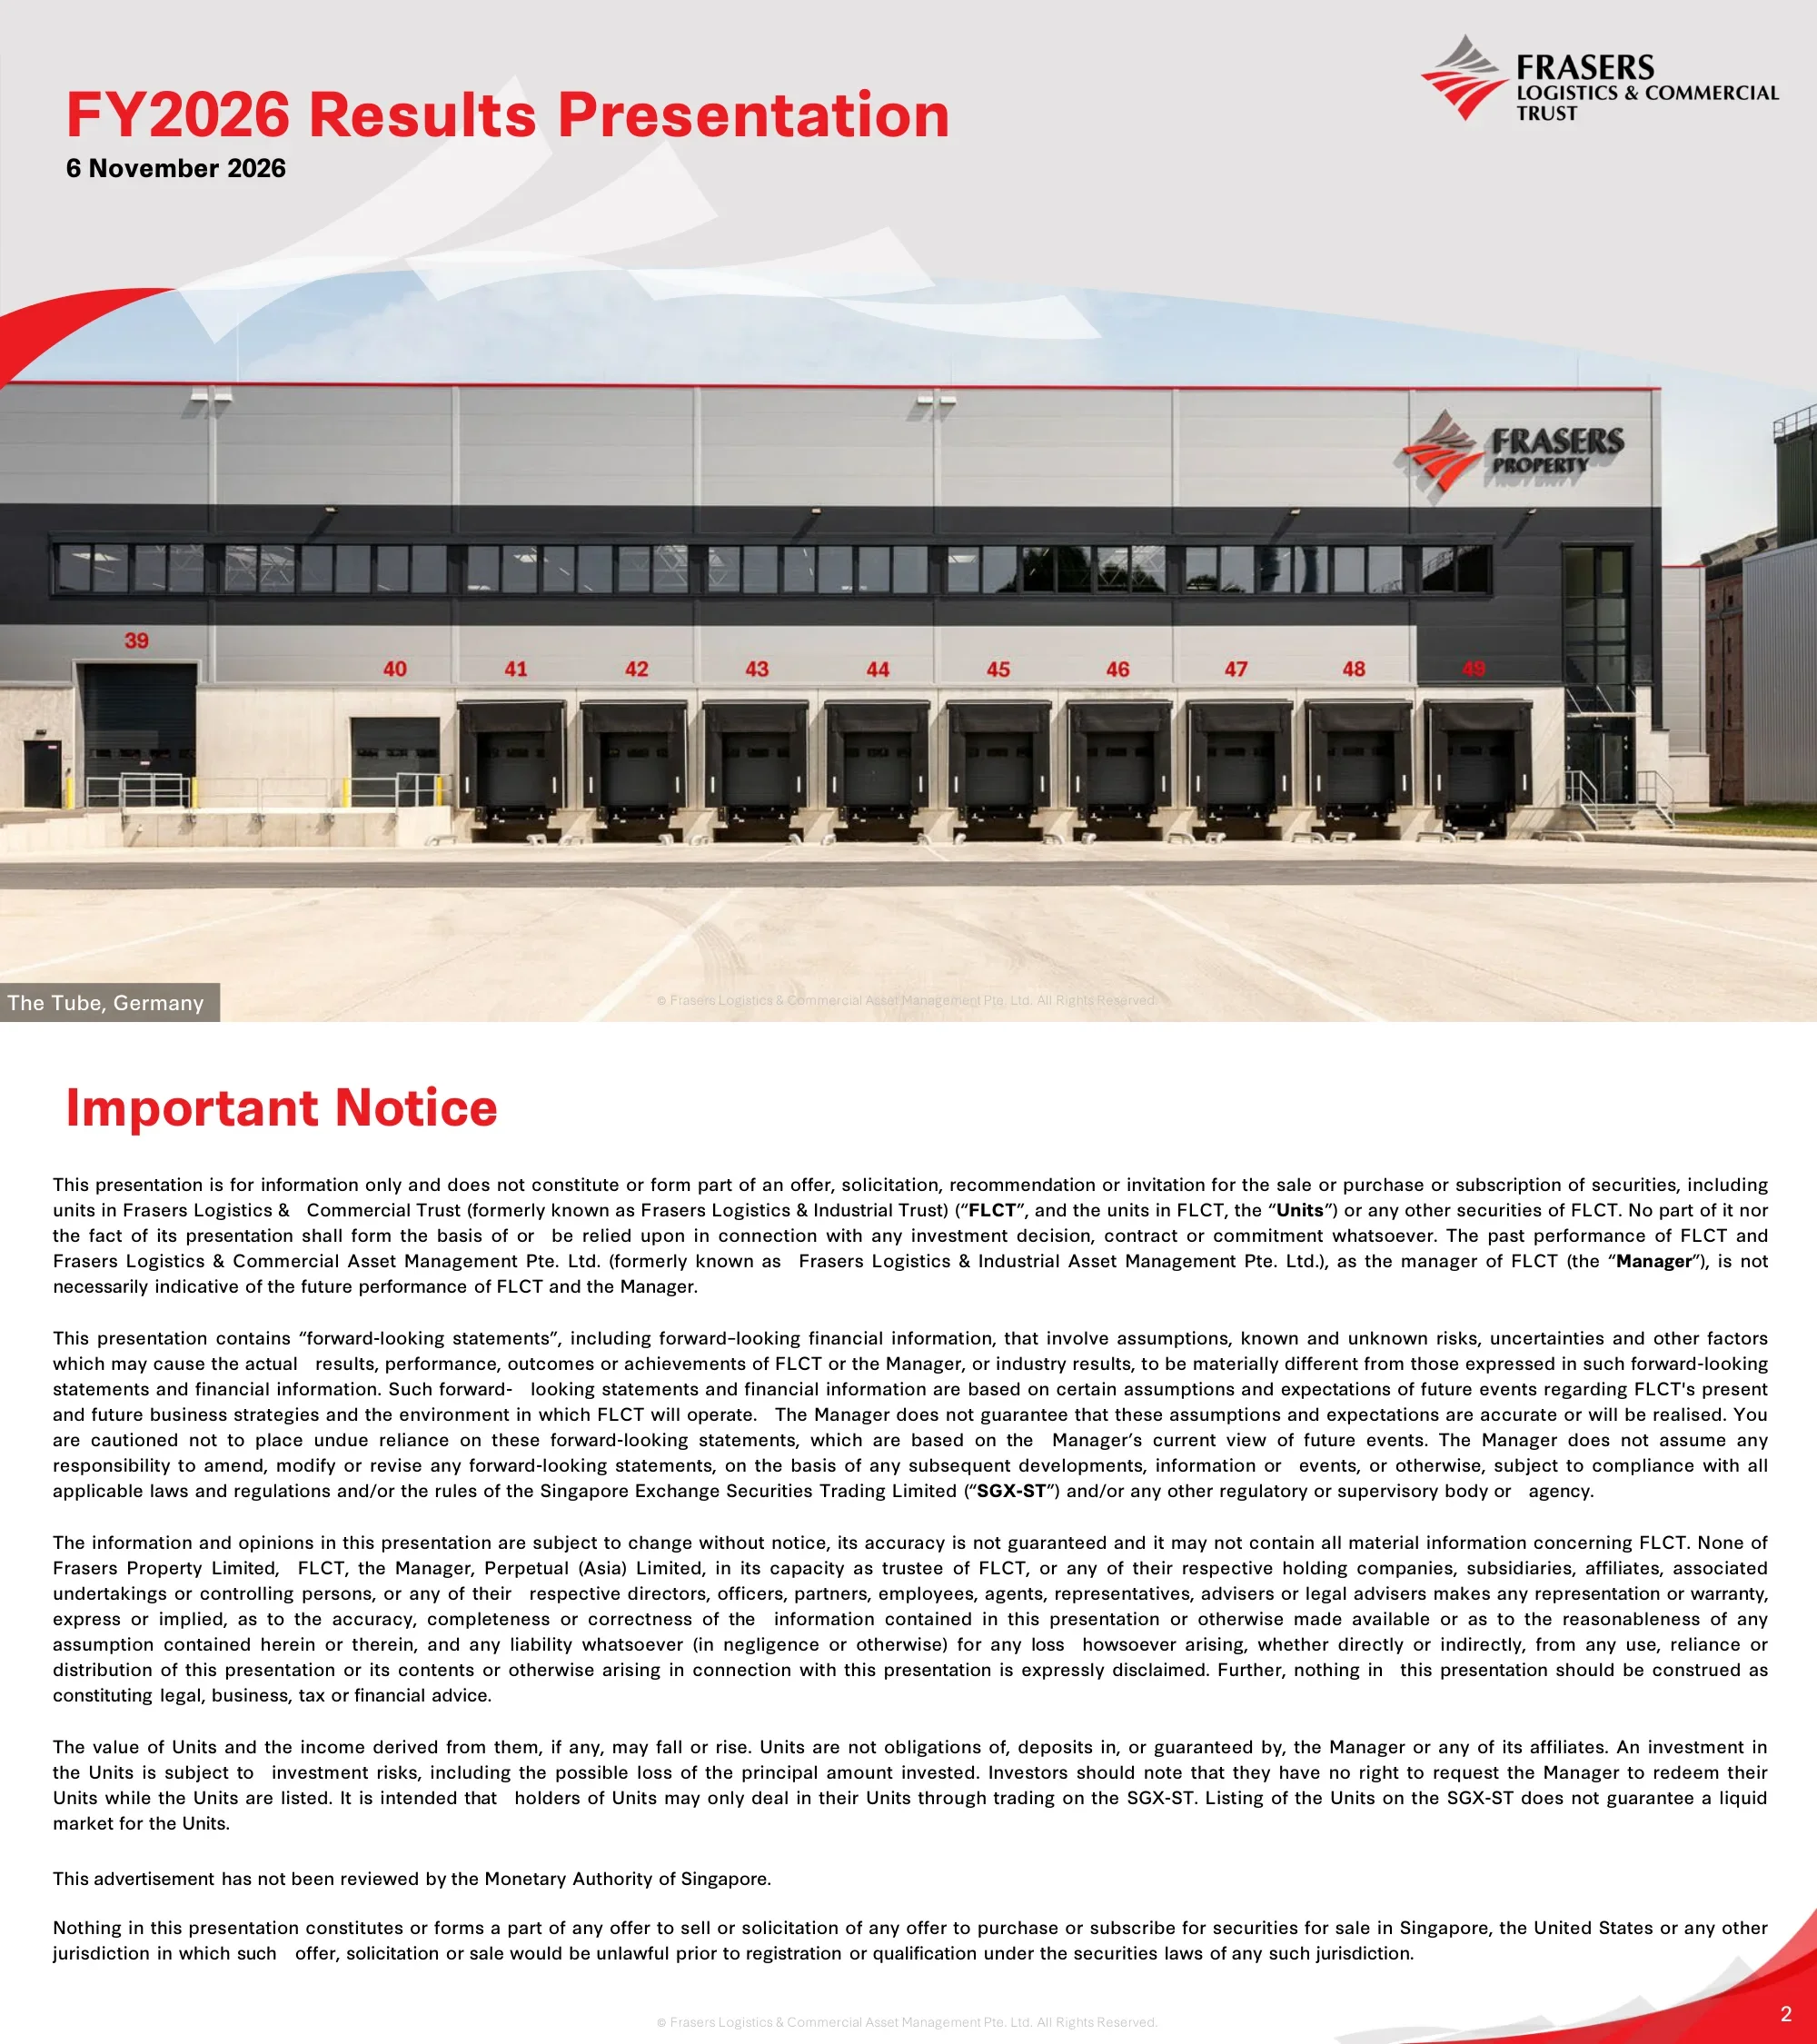
Cover page with the title FY2026 Results Presentation, the date 6 November 2026 and the FLCT logo over a photo of The Tube logistics property in Germany.
Full-bleed property photo in the lower two-thirds, red title and date top left, logo top right, red swoosh accent
Legal disclaimer: the presentation is not an offer of units, contains forward-looking statements, units trade only on the SGX-ST, and the material has not been reviewed by the Monetary Authority of Singapore.
Red title over six justified paragraphs of body text
Defines Frasers entities, currencies (A$, €, £, S$), acronyms such as WALE, WALB, DPU, GRI and ICR, and how the two rental reversion measures are calculated.
Two-column text list with bold group headings
Six sections: key highlights, portfolio highlights, sustainability highlights, outlook and key themes, market information and additional portfolio information.
Property photo on the left; numbered circles 01-06 joined by red lines on the right
Section divider for the key highlights, with a photo of 2 Tuas South Link 1 in Singapore.
Photo on the left with a curved page-peel edge; red section title bottom right
Eight KPI tiles: 5.90 Singapore cents DPU, S$224.4m distributable income, 4.9-year WALE, 96.2% occupancy, 3.2% cost of borrowing, 39.2% aggregate leverage, and face rent reversions of 10.4% and 24.0%.
2x4 grid of white KPI cards over a faded warehouse background
118 properties worth S$7.2b with 3.0m sqm lettable area; split 78.1% logistics & industrial, 17.8% business park and 4.1% office; by country Australia 44.6%, Germany 28.8%, Singapore 11.9%, UK 8.3%, Netherlands 6.4%; GRESB Global Sector Leader for the third year.
Double-ring donut chart on the left, L&I/Commercial/Total table on the right, four stat callouts along the bottom
FY2026 vs FY2025: revenue S$494.1m (+4.8%), adjusted NPI S$347.6m (+6.6%), finance costs +4.6%, distributable income before divestment gains +10.0%, total DPU 5.90 vs 5.95 cents; 6.7% annualised distribution yield at S$0.88 per unit.
Bullet commentary on the left with three headline figures beneath; financial table with change indicators on the right
Second half ended 30 September 2026: revenue S$255.2m (+6.7%), adjusted NPI S$180.6m (+9.6%), total distributable income S$112.5m (+0.8%) and DPU of 2.95 cents, unchanged year on year.
Same layout as page 8: commentary left, half-year comparison table right
Stacked bars for 1HFY25 to 2HFY26 show DPU before divestment gains rising from 2.52 to 2.88 cents while the divestment-gain part falls from 0.48 to 0.07; at least 75% of FY2027 management fees to be paid in units and divestment gains capped at 5% of DPU.
FY total summary boxes above a stacked bar chart on the left; DPU commentary bullets on the right
Investment properties up 5.8% to S$7,398m from acquisitions, capex and FX, offset by S$173.6m net fair value losses; total assets S$7,616.8m; NAV per unit S$1.07 (from S$1.10); 39.2% leverage and 3.1-year debt maturity.
Bullet explanation left with three red KPI figures; balance sheet table right
Debt maturity profile for FY2027 to FY2032+ by currency (total gross borrowings $2,857m; 60% EUR, 28% SGD, 7% AUD, 5% GBP); credit metrics include 3.2% cost of debt, 70.9% fixed rate, 4.5x ICR and about S$100m headroom to 40% gearing; +50 bps would cut DPU by 0.11 cents.
Stacked maturity bar chart with a currency donut on the left; key credit metrics table with quarterly changes on the right
2HFY26 distribution of 2.95 Singapore cents for 1 April to 30 September 2026, a full payout; ex-distribution 18 November 2026, record date 19 November 2026, payment 23 December 2026.
Container yard photo on the left; distribution summary text and a two-column date table on the right
Section divider for portfolio highlights, with a photo of Hazeldonk 6308 in the Netherlands.
Photo on the left with page-peel curve; red section title bottom right
118 properties valued at S$7,247.2m, down 2.3% on carrying value: L&I S$5,659.6m (Australia A$3,043.9m, Germany €1,443.3m, Netherlands €318.5m, UK £156.9m, Singapore S$143.0m) and commercial S$1,587.6m.
Full-width table grouped into L&I and Commercial with shaded subtotal and grand total rows
L&I valued at S$5,659.6m, down 0.4%; Australia up 0.3%, Germany and the Netherlands down 1.3% to €1,761.8m, UK up 1.7%; Australian average cap rate 5.89%, German/Dutch net initial yield 4.88%, UK 5.10%.
Bullet summary on top; table of states and countries with cap rate and yield ranges below
Commercial assets valued at S$1,587.6m, down 8.7%: Australian assets down 10.8% to A$594.5m, Alexandra Technopark down 0.5% to S$722.0m, UK business parks down 19.5% to £199.4m; property-level cap rates and equivalent yields shown.
Bullet summary on top; property-by-property valuation table grouped by country
4QFY26 leasing of 31 leases over 152,631 sqm with 13.7%/26.2% portfolio reversions; FY2026 total 96 leases over 641,892 sqm with 10.4%/24.0% reversions; passing rents about 9% below market.
Wide leasing table by segment, country and region with total rows
Portfolio occupancy 96.2% (L&I 99.1%, commercial 89.7%); Singapore L&I fell to 74.4% from 95.0%; Farnborough and Blythe Valley improved; a lease signed after quarter end lifted backfilling of ex-Google space at Alexandra Technopark from 83% to about 90%.
Two occupancy tables on the left; large red occupancy figures and a grey ATP callout box on the right
Lease expiries by GRI from Sept-27 to Sep-36 and beyond, split L&I and commercial; 4.9-year WALE and 86.2% of leases with CPI-linked or fixed escalations.
Stacked column chart on the left two-thirds; two large stats on the right
Top 10 tenants make up 24.5% of GRI with none above 5% and a 5.8-year average WALE; led by the Commonwealth of Australia (4.0%), Hermes Germany (3.5%), CEVA Logistics and DSV (3.0% each).
Column chart of tenants with country flags and a WALE row beneath; side notes on the right
Tenant sectors by GRI: 3PL, transport & freight 32.8% L&I plus 1.4% commercial, materials & industrials 17.4% + 4.0%, consumer discretionary 14.9% + 3.1%; 71.8% of GRI from L&I tenants and 89.2% from government-linked, resilient and new economy sectors.
Horizontal stacked bar chart by sector with two large stats on the right
The Aspen and Elder buildings at Blythe Valley Business Park, UK were sold in October 2026 for £3.3m (about S$5.6m), 17.9% above their £2.8m valuation, to a private property company for own use and investment.
Annotated aerial photo of the business park with building inset photos on the left; bullet text on the right
Section divider for sustainability, with a photo of rooftop solar panels being installed at The Tube, Germany.
Photo on the left with page-peel curve; red section title bottom right
Net-zero target for Scopes 1-3 by 2050; over 90% of portfolio GFA green-certified or pursuing certification; 28.0 MW solar capacity; GRESB score of 90.0 (Global Sector Leader, 4-Star); Best Annual Report (Bronze) at the Singapore Corporate Awards 2026.
Three-column card for goals, certification and decarbonisation, with an awards strip below
Section divider for the outlook, with a photo of Alexandra Technopark in Singapore.
Photo on the left with page-peel curve; red section title on the right
Six trends (location preferences, demand drivers, supply chain resilience, L&I market dynamics, grid constraints, macro uncertainty including Middle East conflict and container freight rates up about 2.4 times since February 2026) next to FLCT's strategy.
Icon list of trends on the left; red-headed strategy panel with bullets on the right
Appendix divider for market information, with an aerial photo of a European logistics warehouse.
Red background with white title and a diagonal photo band
GDP, unemployment, e-commerce growth, CPI, interest rate and 10-year bond yield for Australia, Germany, the Netherlands, Singapore and the UK, e.g. Singapore GDP +1.4% for 2Q2026 and 2.0% unemployment.
Six-column comparison table with country flag rows
Industrial prime net face rents for Sydney Outer Central West (A$232/sqm), Brisbane (A$190) and Melbourne (A$166); Perth prime CBD office rent A$690/sqm; national industrial and CBD office supply vs 10-year averages.
Four-quadrant chart grid: two line charts on top, two column charts below
Record Q3 2026 gross take-up of 630,500 sqm; 99,562 sqm of new supply; Outer Central West prime rents A$232/sqm, up 1.4% over 12 months and forecast to grow 3.5%; incentives at 25.0%.
Supply, demand, rents and vacancy bullets on the left; supply column chart and rent forecast line chart on the right
Q3 2026 take-up of 441,800 sqm led by the West precinct; 58,667 sqm completed; prime rents flat at A$171/sqm in the South East, with JLL forecasting growth to A$177/sqm; vacancy 4.7%.
Bullet commentary left; supply columns and rent forecast line on the right
Take-up rose to 298,700 sqm including Amazon's 150,000 sqm pre-lease in North Maclean; Northern precinct rents up 8.3% to A$201/sqm; vacancy 3.0% in 1H26.
Bullet commentary left; supply columns and rent forecast line on the right
No new supply in Q3 2026; net absorption 11,274 sqm; prime net face rents up 1.9% to A$690/sqm with 46.7% incentives; headline vacancy 15.39%, prime 13.19%.
Bullet commentary left; supply columns and rent forecast line on the right
Q2 2026 net take-up fell to 491,100 sqm; vacancy 3.5%; prime yields up 10 bps to 4.50%; prime rents up 3.2% year on year to €111.00/sqm/yr; H1 investment just under €2.5 billion.
Bullets left; combined column (take-up) and line (prime rent) chart right
Q2 2026 net take-up of 444,212 sqm; H1 net absorption 0.98 million sqm; vacancy 5.6%; prime rents stable around €101/sqm/yr; Q2 investment about €528 million; prime yields 4.75%.
Bullets left; dual-axis combo chart right including a negative Q4 2024 bar
South East office take-up fell to 260,600 sq ft in Q2 2026 with 9.0% vacancy; West Midlands logistics take-up reached 2.0 million sq ft in Q3 2026, vacancy 3.99%, prime big box rents £10.75 psf.
Two stacked sections (South East commercial, West Midlands industrial), each with bullets left and a CBRE chart right
Business park rents flat at S$6.15 psf per month (City Fringe) and S$3.55 (Rest of Island); leasing mostly renewals; island-wide vacancy 21.9% in Q3 2026.
Bullets left; rent line chart and supply-demand combo chart right
Prime logistics warehouse rents up 0.5% quarter on quarter in Q3 2026; occupancy rose to 96.1%; ground floor, prime logistics and upper floor warehouse rents at S$1.91, S$1.88 and S$1.39 psf per month.
Bullets left; three-line warehouse rent chart right
Appendix divider for additional portfolio information, with a photo of an Australian industrial facility.
Red background with white title and diagonal photo band
111 L&I properties worth about S$5.7B with a 4.8-year WALE and 99.1% occupancy; by country: Australia 61 properties (48%), Germany 35 (37%), the Netherlands 10 (8%), UK 4 (5%), Singapore 1 (2%), with lettable area, age, WALE and tenure.
Country comparison table with four large stats in a right sidebar
Seven commercial properties worth about S$1.6B with a 5.3-year WALE and 89.7% occupancy; Alexandra Technopark makes up 45% of commercial value; per-property ownership, lettable area, WALE and occupancy.
Seven-column property table with large stats in a right sidebar
Top 10 L&I tenants make up 20.7% of portfolio GRI with a 5.7-year average WALE, led by Hermes Germany (3.5%), CEVA Logistics and DSV (3.0% each), with Peugeot and Martin-Brower on the longest leases.
Column chart with tenant names, country flags and a WALE row
Top 10 commercial tenants make up 11.2% of portfolio GRI with a 7.3-year average WALE, led by the Commonwealth of Australia (4.0%) and Rio Tinto (2.2%); two Singapore tenants are unnamed at their request.
Column chart with tenant names, flags and WALE row
L&I lease expiries by country from vacant (0.9%) to Sep-36 and beyond (13.6%), with peaks of 16.8% in Sept-28 and 17.8% in Sept-30.
Stacked column chart by country with a totals row beneath
Commercial lease expiries for Australia, the UK and Singapore: 10.3% vacant, 16.5% in Sept-30 and 21.8% in Sep-36 and beyond.
Stacked column chart by country with a totals row beneath
Closing page with the Frasers tagline over four photos of people at work, in hospitality and at industrial sites.
Red background with white tagline and a diagonal four-photo strip
Algengar spurningar um þessa glæru og undirliggjandi kynningarefni.
It is Frasers Logistics & Commercial Trust's (SGX: BUOU) results deck for the year ended 30 September 2026, lodged with SGX on 6 November 2026. It covers FY2026 and 2HFY26 financials, DPU, the balance sheet and debt, the 2HFY26 distribution timetable, property valuations, leasing, occupancy, tenants, ESG, outlook, and market data for Australia, Germany, the Netherlands, the UK and Singapore.
FLCT's financial year ends on 30 September, so FY2026 runs from 1 October 2025 to 30 September 2026. 1HFY26 is October 2025 to March 2026, and 2HFY26 is April to September 2026.
Singapore REITs such as FLCT report full financial results half-yearly, at the half year and the full year, and pay distributions on the same half-yearly cycle. In the first and third quarters they publish shorter business updates with operating data such as occupancy and gearing, not full results.
FY2026 DPU was 5.90 Singapore cents (FY2025: 5.95) on total distributable income of S$224.4 million. Revenue rose 4.8% to S$494.1 million and adjusted net property income rose 6.6% to S$347.6 million. DPU before capital distribution of divestment gains rose 9.4% to 5.70 cents.
Results are reported in Singapore dollars (S$) and DPU in Singapore cents. Property valuations are also shown in local currency: Australian dollars (A$) for Australia, euros (€) for Germany and the Netherlands, and pounds (£) for the UK, converted at S$0.8875 per A$, S$1.4470 per € and S$1.6949 per £ as at 30 September 2026.
As at 30 September 2026, aggregate leverage was 39.2%, cost of borrowing 3.2% (trailing 12 months), 70.9% of borrowings were at fixed rates, interest coverage was 4.5x and average debt maturity 3.1 years. NAV per unit was S$1.07 and Fitch rates FLCT BBB+ / Stable.
The 2HFY26 distribution of 2.95 Singapore cents per unit has an ex-distribution date of 18 November 2026, a record date of 19 November 2026 and a payment date of 23 December 2026.
Yes. It follows a standard REIT results structure: KPI tiles, results and balance sheet tables, DPU and debt maturity charts, valuation and leasing tables, lease expiry and tenant charts, an ESG summary and a market appendix. The pages are in English and can be downloaded to study or adapt.

Create Your Own Slides
Turn your ideas into professional presentations in seconds with 2slides AI.
Sæktu innblástur í faglega hönnun, veldu þinn stíl og búðu til glærur með fullkominni textabirtingu. Knúið af Nano Banana—byrjaðu að búa til kynninguna þína núna.
Þinn AI-þjónn fyrir glærur. Sparaðu tíma, skín hraðar með snjallri kynningargerð.


© 2026 2slides. Allur réttur áskilinn.