
Hluti af safninu Dæmi um fjárfestakynningar
Chunghwa Telecom Q3 2026 Earnings Presentation — 3Q 2026 Operating Results (November 4, 2026)
Notar forsíðu þessarar kynningar sem stílfyrirmynd fyrir glærur úr þínu eigin efni. Eða veldu hvaða síðu sem er hér fyrir neðan og notaðu uppsetningu hennar sem fyrirmynd.
Flýtileiðsögn
Merki
Deila glærunum
Chunghwa Telecom Q3 2026 Earnings Presentation — 3Q 2026 Operating Results (November 4, 2026)
Ítarleg sýn á hverja glærusíðu, þar á meðal útlit, lykilefni og sjónræna þætti.
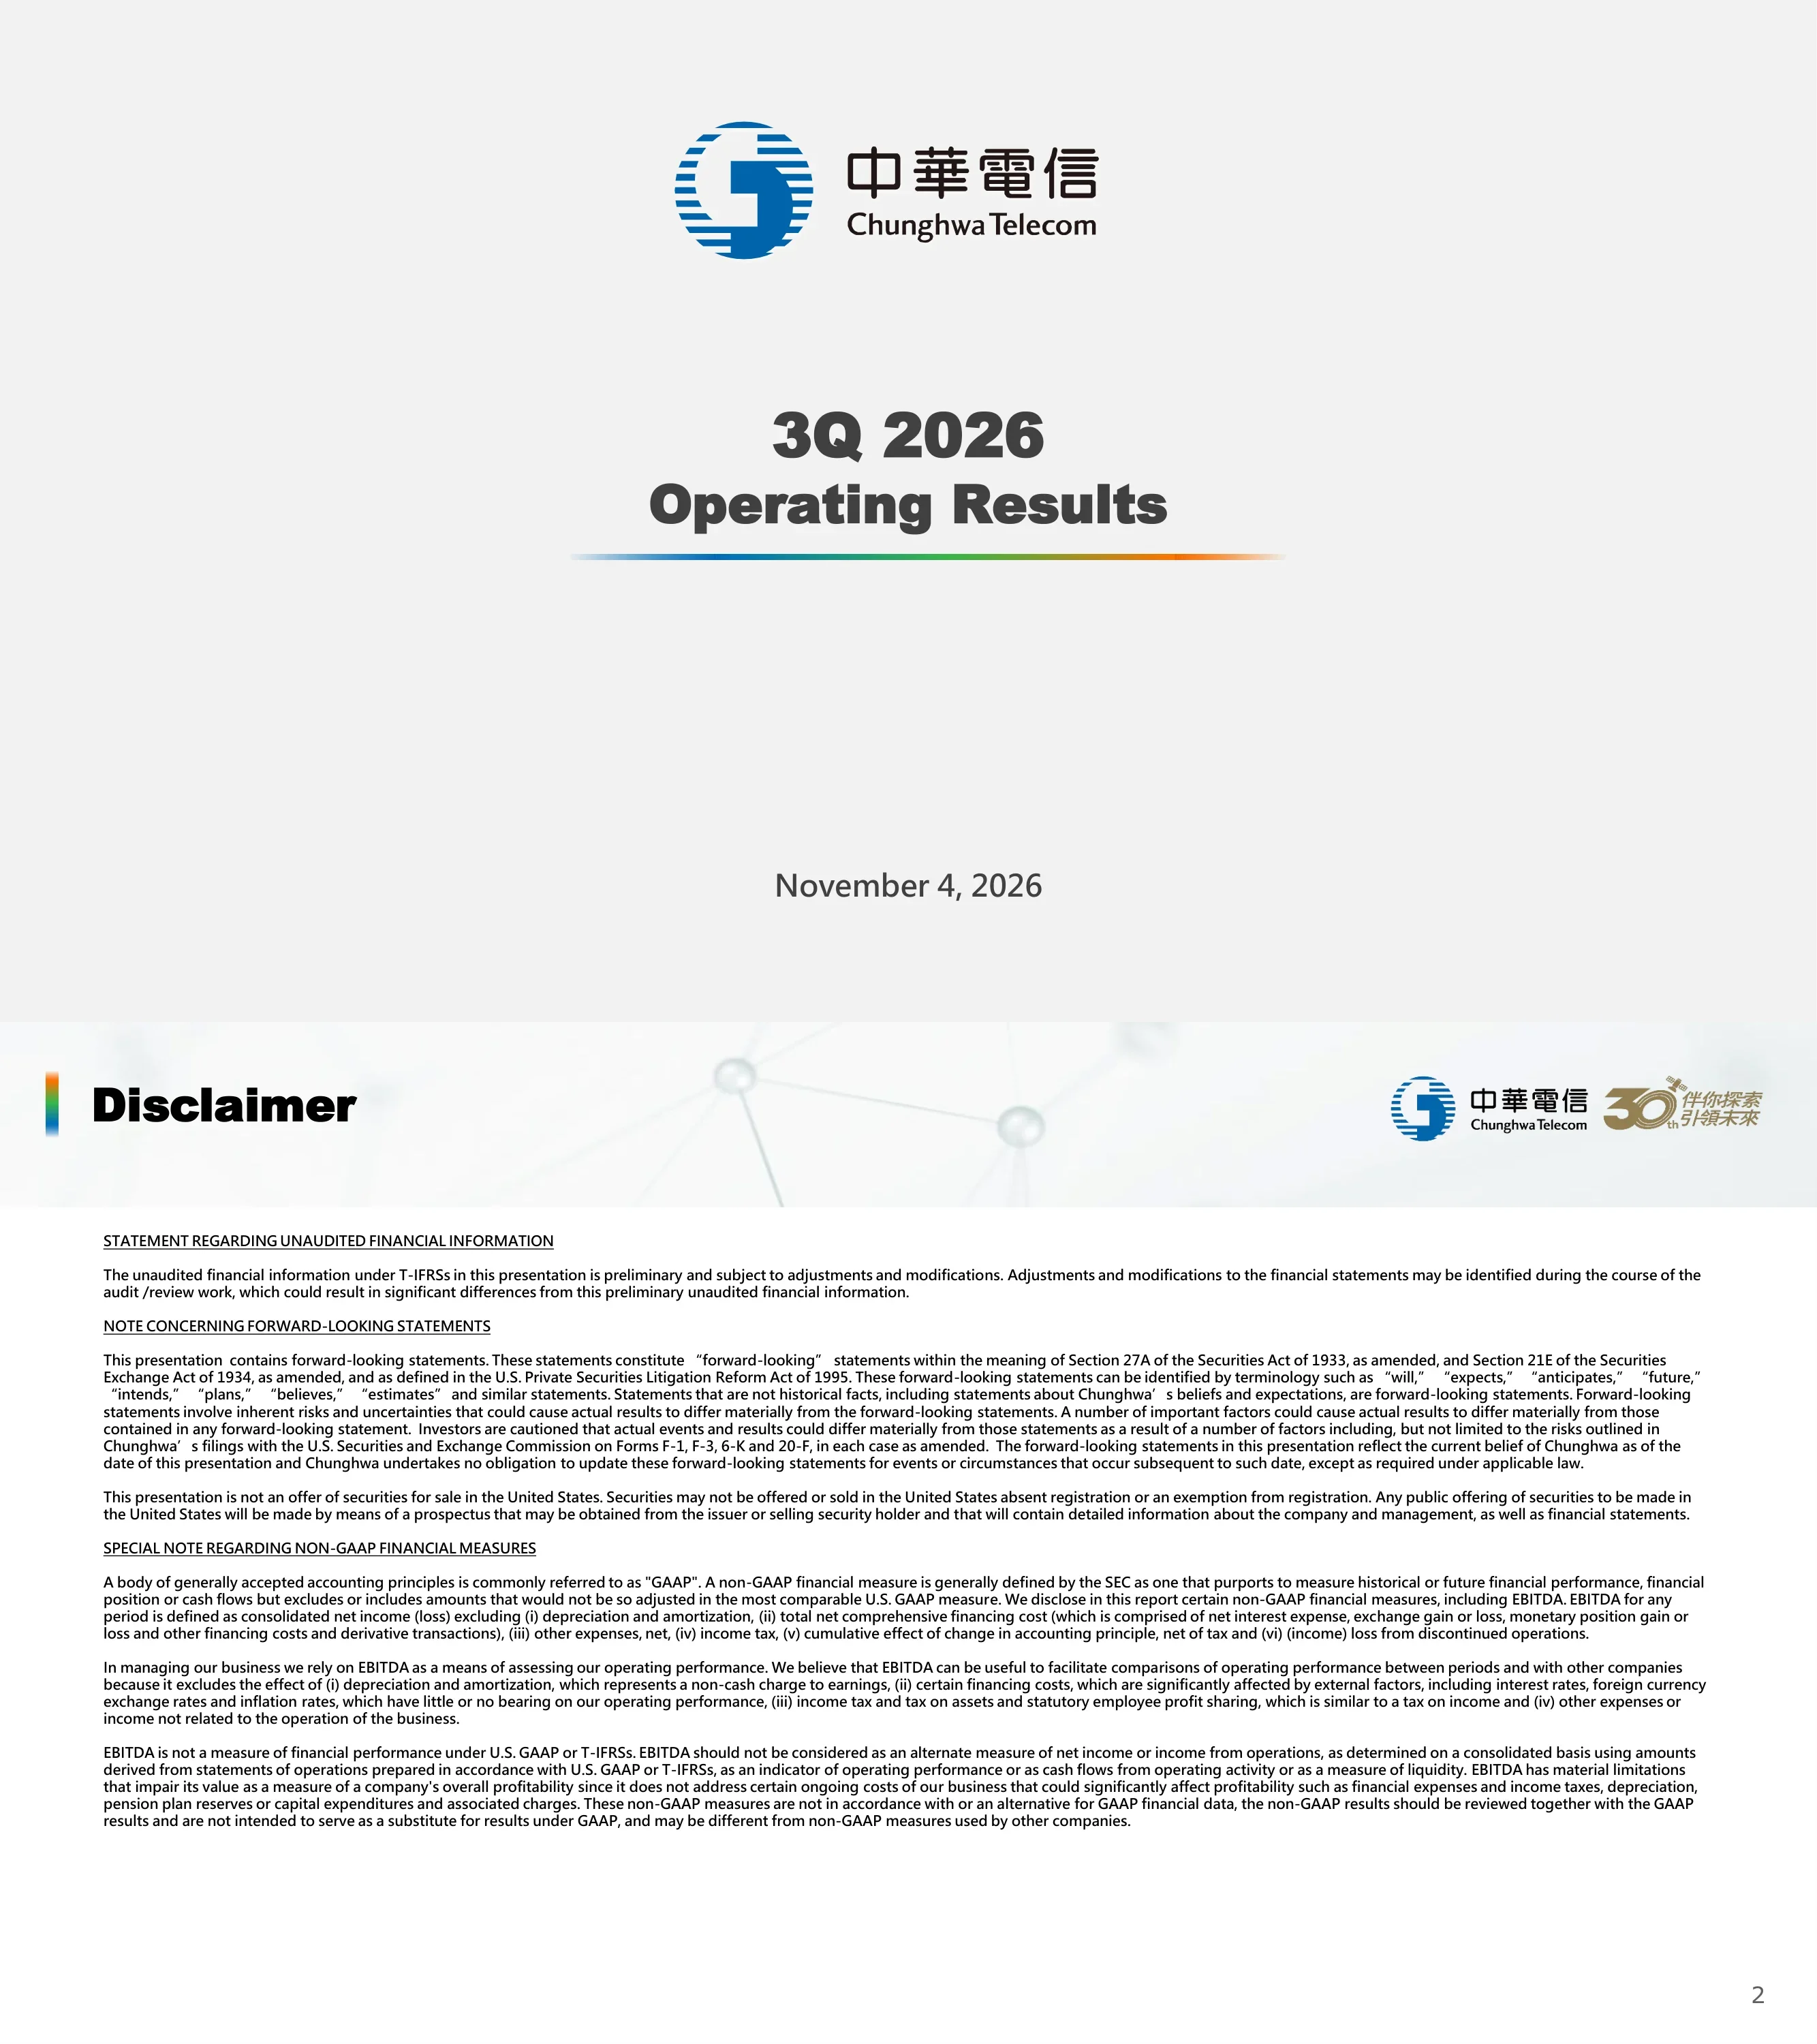
Cover of Chunghwa Telecom's third-quarter 2026 operating results presentation, dated November 4, 2026.
Centered composition on light grey: company logo at top, two-line bold title in the middle, blue-green-orange gradient rule beneath, date at the bottom.
Legal notices: the T-IFRS figures are unaudited and preliminary; forward-looking statements under the US Securities Act and Exchange Act with reference to Chunghwa's SEC filings (Forms F-1, F-3, 6-K, 20-F); no US securities offer; and a non-GAAP note defining EBITDA and explaining why management relies on it.
Light grey header band with faint network-node graphic, bold dark title top-left with a vertical rainbow accent bar, Chunghwa Telecom logo and gold 30th-anniversary mark top-right; full-width body of dense small text under four underlined section headings.
Three boxed themes. Financial: 3Q26 revenue, operating income, net income, EBITDA and EPS all beat the high end of guidance and were the highest of any third quarter since 2009; ICT revenue hit its best third quarter since 2021; asset revitalization made a one-off contribution. Pre-6G & AI: 5G SA deployed in major metros targeting >50% population coverage by end-2026 for network slicing, a Google partnership on consumer AI services, GenAI governance and AgentHub services via subsidiary CHT InventAI, and the October carve-out of CHT Intelligent Vision Solutions (computer vision, video analytics, edge AI for smart cities). ESG: one of the first companies globally to get BSI's AI Mark of Trust, Top 1% in TIME's World's Most Sustainable Companies, Frost & Sullivan 2026 Best Practices Awards, Taiwan FINI 100 for a second year, and Harvard Business Review recognition.
Light grey header band with faint network-node graphic, bold dark title top-left with a vertical rainbow accent bar, Chunghwa Telecom logo and gold 30th-anniversary mark top-right; three stacked full-width outlined boxes (blue, orange, green), each with a tab label, a coloured headline and checkmark bullets with keyword highlights.
Section divider opening the business review of mobile, broadband, consumer, enterprise ICT, international and business-group results.
Centered logo above a bold section title and gradient rule on a white background.
Mobile Market Leadership: CHT holds 41.2% of mobile revenues, 39.9% of mobile subscribers and 39.4% of 5G subscribers versus two peers (NCC statistics, Jul–Sep 2026), so revenue share exceeds subscriber share. Value creation: a 40% monthly-fee uplift when users migrate from 4G to 5G, 49.6% 5G penetration among smartphone users, 0.41% 090 postpaid churn and roaming revenue up 18% YoY. Mobile services revenue (including IoT) rose from NT$17.31 billion in 3Q25 to NT$17.80 billion in 3Q26 (YoY +2.9%); 090 postpaid ARPU moved 562 → 572 → 573 → 569 → 573 NT$ across five quarters (YoY +NT$11).
Light grey header band with faint network-node graphic, bold dark title top-left with a vertical rainbow accent bar, Chunghwa Telecom logo and gold 30th-anniversary mark top-right; two-column layout — left: blue banner over horizontal 100% stacked share bars plus a four-icon 'Value Creation' KPI row; right: green banner over a five-quarter bar chart and an ARPU line chart, each with a large YoY callout.
Fixed broadband revenue up 3.0% YoY (+NT$0.35 billion) to NT$12.04 billion in 3Q26 (from 11.68 in 3Q25); fixed broadband ARPU up 1.6% (+NT$12), moving 810 → 819 → 818 → 824 → 822. Subscribers grew from 4,447k to 4,478k. Higher-speed adoption: 300 Mbps+ subscribers up 14.4% (+243k) and now 43% of the base (from 38% a year earlier); 1 Gbps+ subscribers up 52.3% YoY.
Light grey header band with faint network-node graphic, bold dark title top-left with a vertical rainbow accent bar, Chunghwa Telecom logo and gold 30th-anniversary mark top-right; two blue banners (ARPU Growth, Higher-Speed Adoption) each with two headline metrics in orange, above four small five-quarter charts in a row.
Multiple-play (fixed broadband + mobile + Wi-Fi) package subscriptions grew for the 19th consecutive quarter, up 13% YoY, and Wi-Fi penetration among broadband subscribers reached 58%. IPTV (MOD) plus OTT (Hami Video) kept video subscribers above 3 million, and its content earned 12 Golden Horse nominations, the most in the industry. Consumer cybersecurity subscriptions stayed above 1 million (YoY +12%) and direct carrier billing (DCB) transacting users rose 5% YoY.
Light grey header band with faint network-node graphic, bold dark title top-left with a vertical rainbow accent bar, Chunghwa Telecom logo and gold 30th-anniversary mark top-right; three equal columns with blue, orange and green banners, bullet text on top and a five-quarter trend line with a speech-bubble callout below; partner logos at the bottom right.
Group enterprise ICT revenue and ICT recurring revenue both grew 19% YoY, shown as a five-quarter bar-and-line chart (absolute values not labelled). Application revenue growth: cloud services +45%, IDC +26%, cybersecurity +22% and AIoT +14%, with 10 consecutive quarters of YoY growth. ICT contract value for 9M26 already exceeds 1.4 times the full-year 2025 total, and 3Q26 order intake rose 84% YoY, with wins in government security (infrared surveillance), AI data centre (AIDC) construction, AI-powered smart transportation, and digital-trust credential projects.
Light grey header band with faint network-node graphic, bold dark title top-left with a vertical rainbow accent bar, Chunghwa Telecom logo and gold 30th-anniversary mark top-right; left column: green banner over a combo bar/line chart with two callouts, then a second banner over four application icons with growth rates; right column: green banner over a horizontal contract-value bar comparison (2025 vs 9M26) and bullet list of contract wins.
International subsidiaries' revenue rose 7.8% YoY; U.S. market revenue grew 27% on large AI supply-chain projects in California and Texas, and Southeast Asia revenue grew 3%. Network-resilience revenue: IPLC up 33% (driven by the SJC2 and Apricot undersea cables) and satellite-related revenue up 9.8%. Contract wins: a new Guatemala branch opened in October as a Central/South America ICT base with a local government data-centre project, follow-on work from high-tech clients in Japan and the US, sports-tech ICT projects in Thailand, and satellite-related wins above NT$250 million as of Q3.
Light grey header band with faint network-node graphic, bold dark title top-left with a vertical rainbow accent bar, Chunghwa Telecom logo and gold 30th-anniversary mark top-right; top band split into a wide green 'Global Market Highlights' panel (bar chart plus world map with location pins and callouts) and a narrower 'Network Resilience' panel (globe with satellites); bullet lists across the bottom.
Consumer Business Group revenue rose 6.3% to NT$37.38 billion (mobile 15.19, fixed-line 10.78, sales 10.64, others 0.77); sales revenue +19.5% on iPhone demand; income before tax +1.4%. Enterprise Business Group revenue rose 8.2% to NT$20.46 billion (mobile 2.47, fixed-line 8.47, ICT 8.50, others 1.01) as ICT revenue grew 23.2% and mobile 2.1%; income before tax -3.1%. International Business Group revenue rose 6.6% to NT$2.48 billion (fixed-line 1.29, ICT 1.02, others 0.16) with ICT down 6.7% on a high one-off base; income before tax +12.2%.
Light grey header band with faint network-node graphic, bold dark title top-left with a vertical rainbow accent bar, Chunghwa Telecom logo and gold 30th-anniversary mark top-right; three columns with blue, orange and green banners, bullet commentary on top and a 3Q25-vs-3Q26 stacked column chart with boxed totals beneath each.
Section divider introducing the consolidated financial statements and guidance comparison.
Centered logo above a bold section title and gradient rule on white.
Q3 2026 revenue NT$67.59 billion (+16.7% YoY from 57.92); operating costs 52.21 (+14.0%); income from operations 15.38 (+27.1%); income before tax 15.55 (+26.8%); net income attributable to the parent 12.22 (+29.5%); EPS NT$1.57 vs 1.22 (+29.5%); EBITDA 25.66 (+16.1%) at a 37.97% margin (38.17% a year earlier). Nine months: revenue 188.95 (+10.8%), operating income 41.74 (+12.3%), net income 32.97 (+12.1%), EPS 4.25 vs 3.79, EBITDA 72.48 (+7.8%), margin 38.36% vs 39.43%. 2026 figures are unaudited T-IFRS.
Light grey header band with faint network-node graphic, bold dark title top-left with a vertical rainbow accent bar, Chunghwa Telecom logo and gold 30th-anniversary mark top-right; full-width financial table with blue header row (Q3 2026, Q3 2025, Growth %, 9M 2026, 9M 2025, Growth %), alternating grey bands and footnotes.
As of September 30, 2026: total assets NT$527.00 billion (-1.7% vs end-2025, +2.7% YoY), including cash 32.52, receivables 31.92, inventories 18.43 (+39.8%), other current monetary assets 19.11, PP&E 279.26 and other assets 145.76. Total liabilities 132.73 (contract liabilities 30.60, bonds payable 24.94, other 77.19); total equity 394.27. Current ratio 135.78% (vs 148.68%), debt ratio 25.19%, and net debt/EBITDA 0 (vs 4.50% a year earlier).
Light grey header band with faint network-node graphic, bold dark title top-left with a vertical rainbow accent bar, Chunghwa Telecom logo and gold 30th-anniversary mark top-right; full-width table with columns 2026.9.30, 2025.12.31, Growth %, 2025.9.30, Growth %; bold total rows and italic indented sub-items.
Nine-month 2026 operating cash flow NT$49.84 billion (+9.6% from 45.46); capital expenditure 16.17 (-6.5%), split mobile 4.70 and non-mobile 11.47; free cash flow 33.67 (+19.6% from 28.16), calculated as operating cash flow minus capex on a cash basis.
Light grey header band with faint network-node graphic, bold dark title top-left with a vertical rainbow accent bar, Chunghwa Telecom logo and gold 30th-anniversary mark top-right; compact five-row table with blue headers (9M 2026, 9M 2025, Growth %), whitespace below and footnotes.
Actuals against guidance. Q3 2026: revenue 67.59 vs 60.11–60.69 forecast (111.4–112.4% achieved); operating income 15.38 vs 12.21–12.93 (119.0–126.0%); net income 12.22 vs 9.46–10.18 (120.0–129.3%); EPS 1.57 vs 1.22–1.32; EBITDA 25.66 vs 22.98–23.70 (108.3–111.6%); EBITDA margin 37.97% vs 38.24–39.05% guided. Nine months: revenue 188.95 vs 174.03–174.92 (108.0–108.6%), net income 32.97 vs 27.68–28.44, EPS 4.25 vs 3.57–3.67, EBITDA 72.48 vs 66.77–67.49.
Light grey header band with faint network-node graphic, bold dark title top-left with a vertical rainbow accent bar, Chunghwa Telecom logo and gold 30th-anniversary mark top-right; full-width table with columns Q3 2026 (A), Q3 2026 (E), Achieving %, 9M 2026 (A), 9M 2026 (E), Achieving %.
Closing slide inviting questions from investors and analysts at the investor conference.
Centered bold 'Q & A' above the logo, 30th-anniversary mark and gradient rule on white.
Algengar spurningar um þessa glæru og undirliggjandi kynningarefni.
It is the English version of the deck Chunghwa Telecom filed on Taiwan's Market Observation Post System (MOPS) for its 3Q 2026 investor conference (法說會) on November 4, 2026. A Chinese-language version was filed on MOPS as well; this page reproduces the English one.
Revenue was NT$67.59 billion (+16.7% YoY), income from operations NT$15.38 billion (+27.1%), net income attributable to the parent NT$12.22 billion (+29.5%), EPS NT$1.57 and EBITDA NT$25.66 billion with a 37.97% margin. The company says these were the highest third-quarter levels since 2009 and above the high end of guidance; figures are unaudited T-IFRS.
Slide 15 shows Q3 revenue at 111.4–112.4% of the NT$60.11–60.69 billion forecast, net income at 120.0–129.3% of forecast and EBITDA at 108.3–111.6%. The EBITDA margin of 37.97% was slightly below the 38.24–39.05% guided range, as revenue grew faster than EBITDA.
CHT reports a 41.2% share of mobile revenue, 49.6% 5G penetration among smartphone users, a 40% fee uplift on 4G-to-5G migration, 0.41% postpaid churn, mobile service revenue of NT$17.80 billion (+2.9%) and 090 postpaid ARPU of NT$573. It is rolling out 5G SA with a target of over 50% population coverage by end-2026.
Group enterprise ICT revenue and recurring ICT revenue each grew 19% YoY, with cloud +45%, IDC +26%, cybersecurity +22% and AIoT +14%. Third-quarter ICT order intake rose 84%, and nine-month contract value already exceeds 1.4 times the full-year 2025 total.
All amounts are in NT$ (New Taiwan dollars), mostly in billions, prepared under T-IFRSs (Taiwan-endorsed IFRS). EBITDA is a non-GAAP measure defined in the disclaimer and table footnotes.
Yes. The original PDF of all 16 slides is available to download from this page for research and reference; slide images are also shown page by page above.
Original investor conference presentation filed November 4, 2026

Create Your Own Slides
Turn your ideas into professional presentations in seconds with 2slides AI.
Sæktu innblástur í faglega hönnun, veldu þinn stíl og búðu til glærur með fullkominni textabirtingu. Knúið af Nano Banana—byrjaðu að búa til kynninguna þína núna.
Þinn AI-þjónn fyrir glærur. Sparaðu tíma, skín hraðar með snjallri kynningargerð.


© 2026 2slides. Allur réttur áskilinn.