
Forma parte de Ejemplos de presentaciones para inversores · Ejemplos de presentaciones para inversores de Japón
Shionogi H1 FY2026 Earnings Presentation — Shionogi & Co., Ltd. (TSE: 4507) results for the six months ended September 30, 2026, an upward revision of the FY2026 forecast, the planned acquisition of IntraBio (AQNEURSA), and financial policy. This is a Japanese-language deck (original title 2026年度 第2四半期(中間期)決算説明資料) dated October 29, 2026 and published on TDnet, the Tokyo Stock Exchange's timely disclosure system; all figures are in ¥100 million (億円) unless noted.
Usa la portada de esta presentación como referencia de estilo para diapositivas creadas con tu propio contenido. O elige cualquier página de abajo para usar su diseño como referencia.
Navegación Rápida
Etiquetas
Compartir las diapositivas
Shionogi H1 FY2026 Earnings Presentation — Shionogi & Co., Ltd. (TSE: 4507) results for the six months ended September 30, 2026, an upward revision of the FY2026 forecast, the planned acquisition of IntraBio (AQNEURSA), and financial policy. This is a Japanese-language deck (original title 2026年度 第2四半期(中間期)決算説明資料) dated October 29, 2026 and published on TDnet, the Tokyo Stock Exchange's timely disclosure system; all figures are in ¥100 million (億円) unless noted.
Vista detallada de cada página de diapositiva, incluyendo diseño, contenido clave y elementos visuales.
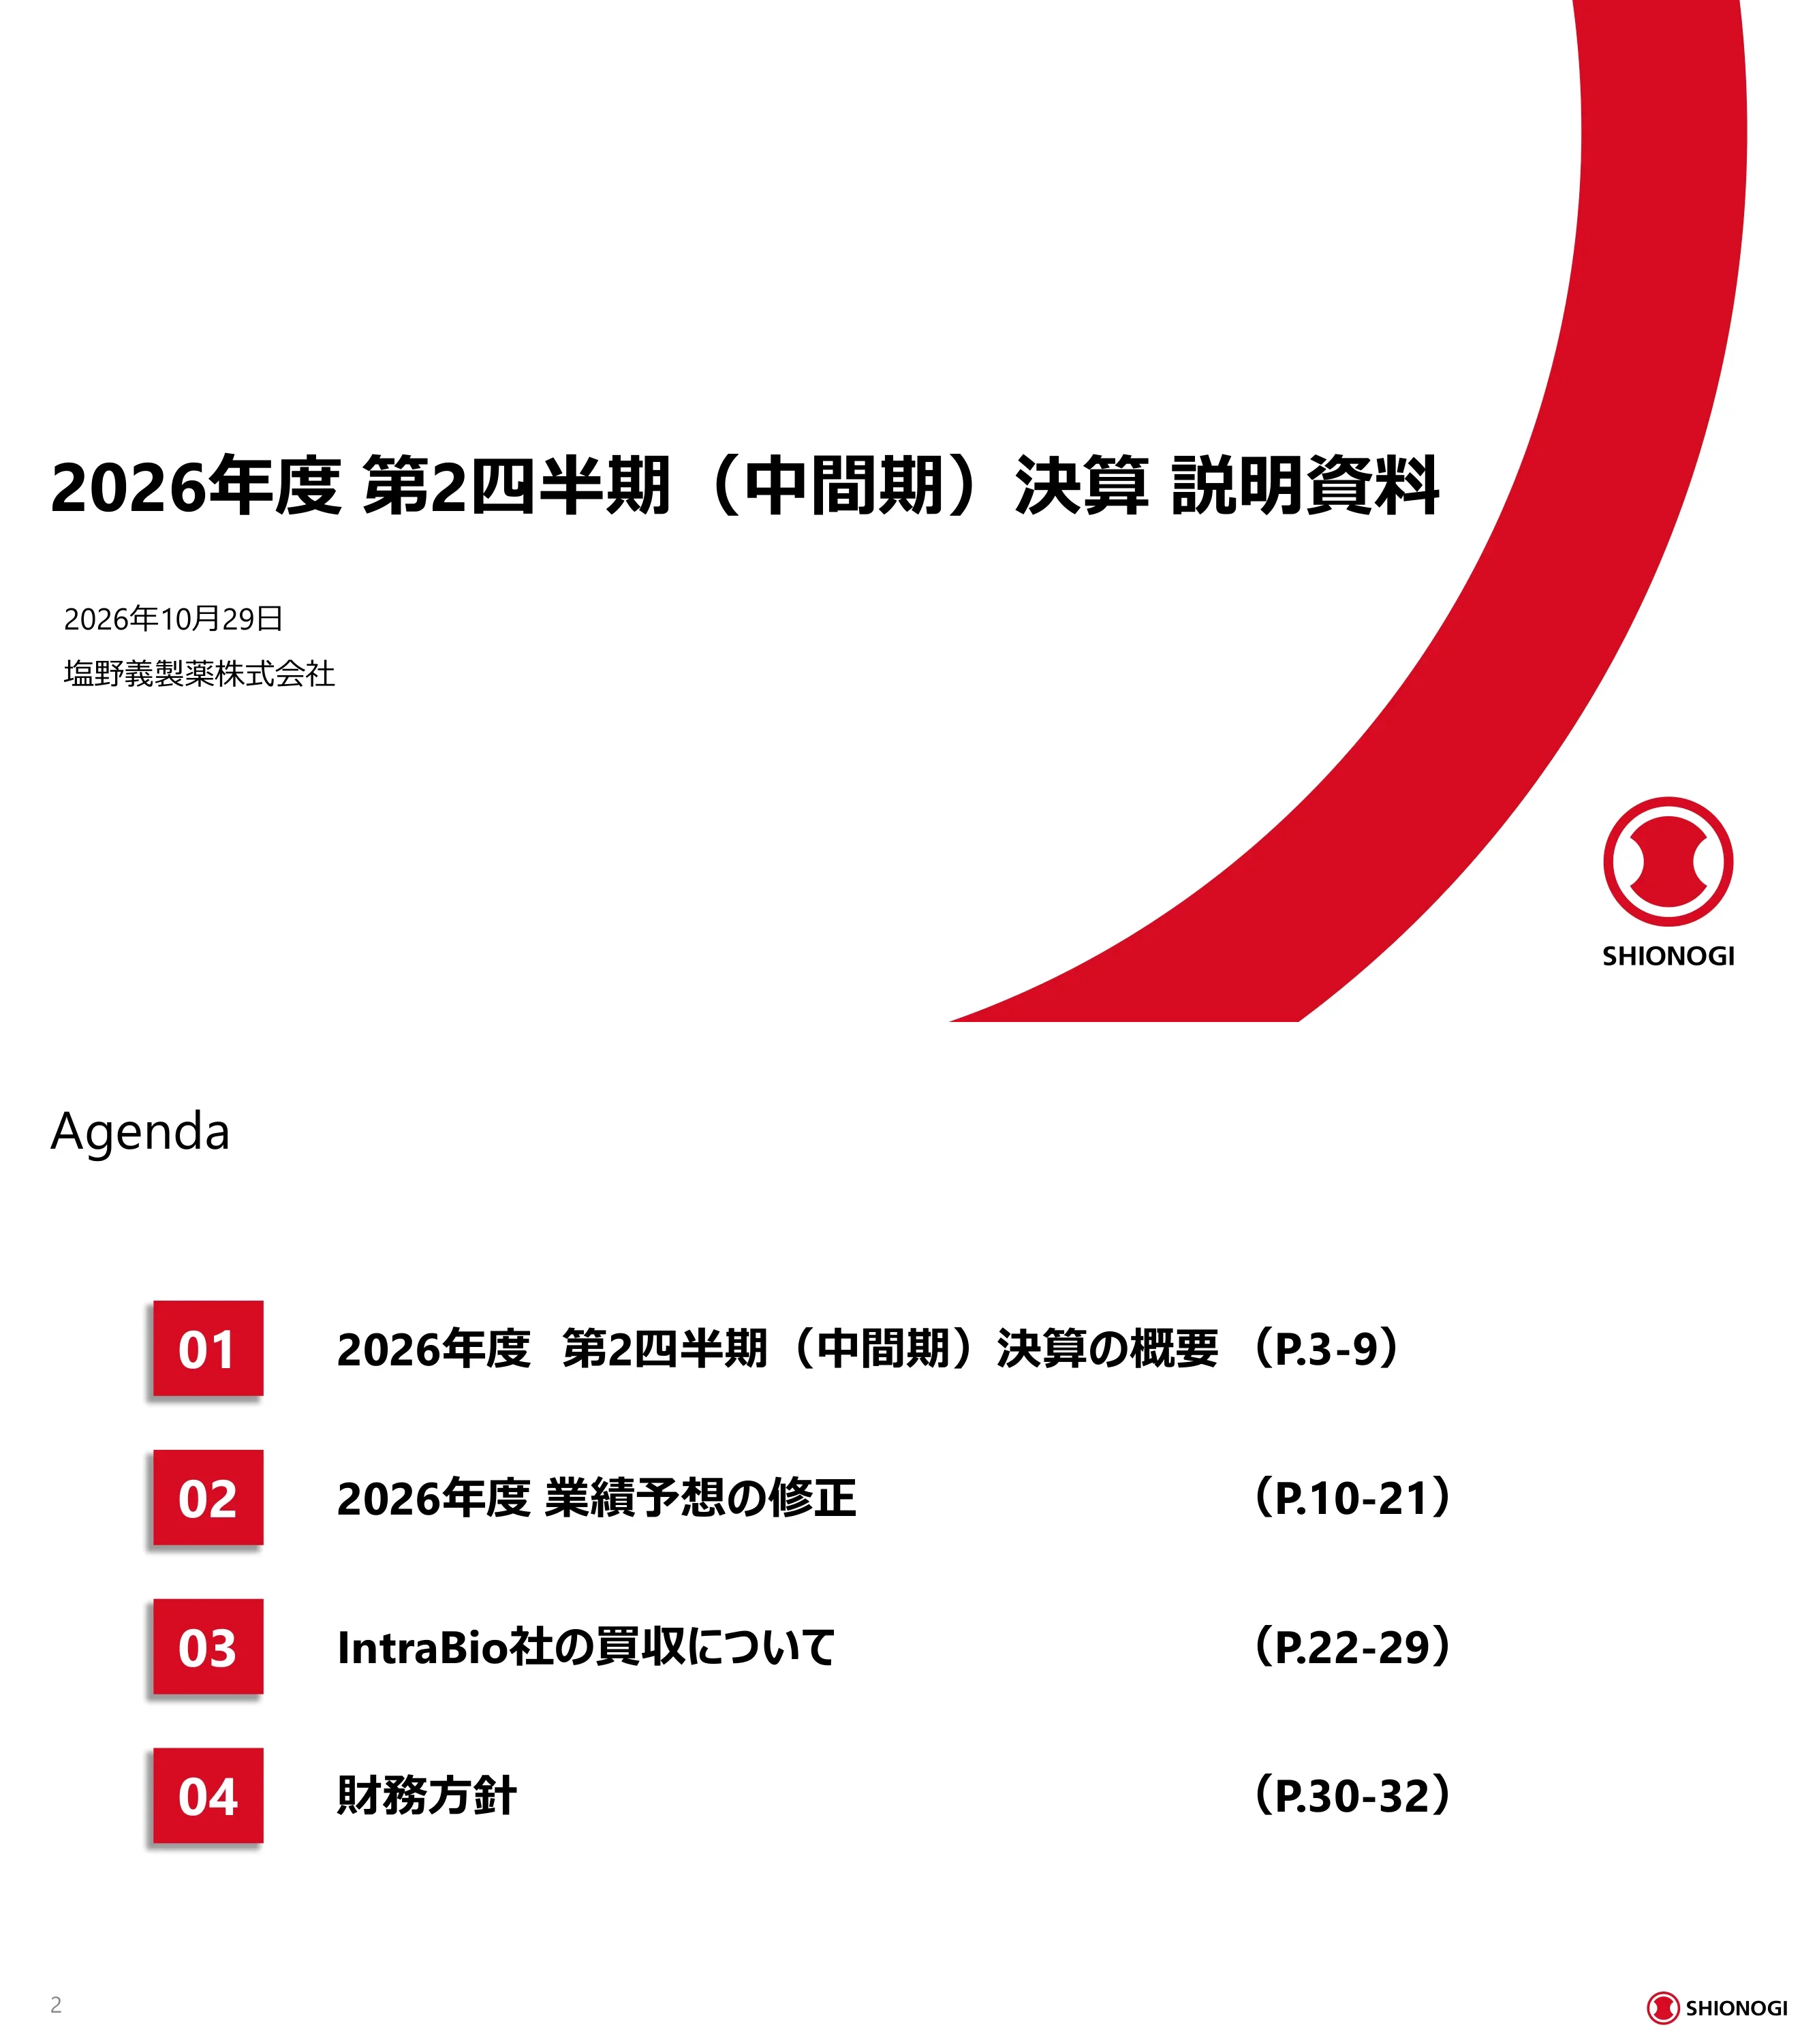
Title slide for Shionogi & Co., Ltd.'s FY2026 second-quarter (interim) results briefing (2026年度 第2四半期(中間期)決算 説明資料), dated October 29, 2026.
White background with a large left-aligned title, date and company name beneath it, and a sweeping red arc on the right ending in the circular Shionogi logo.
Four sections: 01 FY2026 Q2 (interim) results overview (p.3-9); 02 FY2026 forecast revision (p.10-21); 03 Acquisition of IntraBio (p.22-29); 04 Financial policy (p.30-32).
Vertical numbered list with red square number badges on the left, section titles in the middle and page ranges on the right.
Opens section 1, the overview of first-half FY2026 results.
Section divider reusing the cover's red arc and logo with a single left-aligned heading.
H1 revenue ¥3,504 (100 million yen) vs. plan ¥3,400 (103.1%) and +64.5% YoY (+¥1,374); operating profit ¥1,152 (120.0% of plan, +55.8%); profit before tax ¥1,073 (+9.9%); profit attributable to owners ¥1,195 (+44.0%); EBITDA ¥1,746 (+103.4%). Full-year plan at the time: revenue 7,000, operating profit 2,200. FY2025 figures restated after completing PPA for the JT Group pharma acquisition.
Headline message under a red rule, followed by a wide table: FY2026 full-year plan, H1 plan, H1 actual and achievement rate, FY2025 H1 actual, and YoY growth/change, with actual and YoY columns shaded pink.
Waterfall bridges from revenue to operating profit for Q1 (revenue 1,633, COGS 308, SG&A 602, R&D 318, other +107, OP 513) and Q2 (revenue 1,871, COGS 330, SG&A 605, R&D 356, other +61, OP 640). Q2 vs Q1: revenue +¥238 (100M yen, +14.5%), operating profit +¥127 (+24.8%), operating margin 31.4% → 34.2%.
Two side-by-side waterfall charts on the left two-thirds; a right-hand panel of three pink KPI cards with large red numbers.
Line-by-line P&L: COGS 638 (18.2% of revenue), gross profit 2,866, SG&A + R&D 1,881 (SG&A 1,206; R&D 674 at 19.2%), other income 167, finance income/costs -80 (vs +236 a year ago), PBT 1,073. Drivers: revenue up on royalties, domestic drugs and overseas; COGS up on Torii products and one-off edaravone inventory step-up; SG&A up on amortisation of acquired intangibles (JT pharma, edaravone) and US commercial costs; other income up on ViiV equity-method profit, partly offset by a loss on the planned sale of the China generics business; finance income down as ViiV dividends are now booked against the equity-method investment, plus FX losses; net profit lifted by recognition of deferred tax assets.
Dense P&L table on the left with ratio percentages in small red text above values; right column of grey-headed boxes explaining key YoY drivers per line.
Domestic prescription drugs 743 (+101.7%); overseas subsidiaries/exports 950 (+210.2%), including Shionogi Inc. (US) 740 with RADICAVA 509 and Fetroja 226, Shionogi B.V. (Europe) 131 with Fetcroja 104, China 27 (-8.8%); contract manufacturing 66; OTC 78; royalty income 1,654 (+27.9%), of which HIV franchise 1,485 and other 169 (+381.8%, from former JT pharma royalties). RADICAVA US/Canada sales were US$319.0M vs US$323.7M a year earlier under Tanabe Pharma (-1.5%).
Segment table with indented sub-lines on the left and three driver boxes on the right; dashed footnote box beneath for RADICAVA.
Acute respiratory infection drugs (Xocova for COVID-19; Xofluza and Rapiacta for influenza) 49, down 44.0%; Quviviq 40 (+843%); Zurzuvae 4 (42.4% of plan); Radicut 35; Symproic 35 (+19.4%); oxycodone products 23; Torii-related products 394 (+614.4%, or +17.3% on a like-for-like basis vs ¥33.6bn under JT); other 162. Domestic total 743 (+101.7%).
Product-level table with plan, actual, achievement and YoY columns; two dashed footnote boxes at the bottom.
Growth investments made in FY2025 are paying off: H1 revenue 2,130 → 3,504 (+64.5%), operating profit 740 → 1,152 (+55.8%), EBITDA 858 → 1,746 (+103.4%).
Three paired bar charts (FY2025 H1 vs FY2026 H1) with dotted red growth arrows; the revenue bars are stacked by business.
Opens section 2 on the revised full-year forecast.
Red-arc section divider with a single heading.
Revenue and all profit lines raised. Revenue: domestic Quviviq and Torii products up, acute respiratory drugs cut for the H1 shortfall (H2 unchanged), Zurzuvae slower; overseas Shionogi Inc./B.V. up, AQNEURSA revenue to be booked after the IntraBio deal closes, cefiderocol solid; HIV royalties from ViiV strong. Costs: COGS up for inventory step-up after closing; SG&A up for intangible amortisation and AQNEURSA launch, with cost management continued; R&D reprioritised across the integrated pipeline. Other income up on ViiV equity-method profit, offset by the China generics divestment loss.
Four grey-headed panels (Revenue, COGS, Expenses, Other income/expense) with bulleted text; red marks positive and blue negative factors.
FY2026 forecast revised: revenue 7,000 → 7,200 (+200), operating profit 2,200 → 2,300 (+100), PBT 2,200 → 2,205, profit attributable to owners 2,100 → 2,125, EBITDA 3,150 → 3,360 (+210). Versus FY2025 actual: revenue +44.1% (4,997), operating profit +35.1% (1,703), net profit +1.6% (2,092), EBITDA +79.0%. Revenue, operating profit and net profit all at record levels.
Table comparing original vs revised forecast and FY2025 actual, with red-highlighted revised columns.
Revised full year: COGS 1,250 (17.4%), gross profit 5,950, SG&A 2,650 (+250), R&D 1,400 (-150), other income 400, operating profit 2,300 (31.9% margin), finance costs -95. Implied H2: revenue 3,696, operating profit 1,148 (-92 vs original H2), net profit 930.
Wide P&L grid with full-year and H2 blocks (original, revised, change) plus FY2025 actual and YoY columns; ratios in red.
Domestic 1,786 → 1,720 (-67); overseas 1,752 → 1,913 (+160), of which Shionogi Inc. 1,505 (RADICAVA 1,003), Shionogi B.V. 253, China 52; contract manufacturing 133; OTC 173; royalties 3,106 → 3,235 (+129), HIV franchise 2,890. Total 7,200, +44.1% vs FY2025.
Segment forecast table with original/revised/change for full year and H2, FY2025 actual and YoY.
Acute respiratory infection drugs cut 416 → 302 (-113); Quviviq raised 67 → 89; Zurzuvae cut 40 → 10; Radicut 70 unchanged; Symproic 70; oxycodone 46; Torii products 792 (+16); other 340. Domestic total 1,720, +39.3% vs FY2025.
Product-level forecast table mirroring page 14 with a footnote box listing the respiratory drugs.
Strong growth in QOL (quality-of-life) disease areas expands the domestic earnings base to a forecast ¥172.0bn. Infectious diseases: continued preparation for respiratory seasons with Xocova, Xofluza and Rapiacta. QOL: Quviviq (insomnia) adoption rising in psychiatry and internal medicine; psychiatric presence extended to Zurzuvae (depression); co-promotion of Torii's Corectim and Vtama; Radicut ALS early-diagnosis awareness.
Stacked bar chart (FY2024, FY2025, FY2026 forecast) on the left; right side panels for infectious and QOL franchises with product boxes and process icons.
Overseas forecast ¥191.3bn, driven by infectious disease and a RADICAVA-anchored rare-disease franchise. Rare disease: RADICAVA early-diagnosis and persistence support; AQNEURSA (after closing) for NPC and A-T. Infectious disease: cefiderocol growth in the US/EU and new indications/regions; ensitrelvir US expansion and EU approval.
Stacked bar chart (infectious, rare disease, other) on the left; blue rare-disease and green infectious-disease panels on the right.
2011: entered China by acquiring C&O Pharmaceutical (network to ~300,000 clinics, hospitals and pharmacies). 2020: Ping An Shionogi JV formed with Ping An Insurance (51/49), cefiderocol filing and early access, AI drug discovery. 2025 onward: acquired Ping An's 49% stakes, making the Shanghai and Hong Kong JVs wholly owned (Shionogi China) and shifting to a new-drug-centred model.
Three-column timeline with grey headers, bullets, and a row of chevron arrows progressing from light pink to red.
Due to price pressure from policy changes and intensifying competition, China revenue fell about 50% over three years; Shionogi will sell the generics subsidiaries (a Shenzhen sales company and a Nanjing development/manufacturing company), recording a loss of about ¥7.2 billion (72億円) after reassessing asset values.
Left: bullet points and a declining bar chart FY2020-FY2025 with a red arrow and '~50% down in 3 years' badge. Right: org chart of the two subsidiaries to be divested inside a dashed box.
Aim to build a new-drug business in China that contributes to global growth. Two pillars: (1) continued new-drug launches — approved cefiderocol and naldemedine (sales agreement with Chia Tai Tianqing), pipeline olorofim (invasive aspergillosis) whose Phase 3 met its primary endpoint; (2) strengthening the business base with stable earnings and product-specific approaches.
Left column with two numbered pillars and product boxes; right side a blue gradient background with a large red upward arrow and slogan text.
ViiV's long-acting injectable (LAI) sales grew +£144M (+30%) YoY at constant exchange rates. CY2026 Q3: Cabenuva (cabotegravir + rilpivirine, treatment) £478M, +35%; Apretude (cabotegravir, PrEP) £143M, +21%.
Quarterly stacked bar chart CY2021-CY2026 Q3 in £M on the left; two rounded KPI cards with product logos on the right.
Opens section 3. Closing is subject to antitrust waiting periods and regulatory clearances; expected closing November-December 2026.
Red-arc divider with heading and a short legal note beneath.
Accelerate rare-disease expansion by acquiring a promising commercial asset and expertise: (1) further expand the overseas business with a marketed product, leveraging the US RADICAVA infrastructure; (2) strengthen rare-disease development via IntraBio's network with patient groups, KOLs and researchers.
Two equal white cards with red circular icons, joined by a large grey multiplication sign.
IntraBio Inc. (private), founded November 2015, headquartered in Texas, ~60 employees, revenue about US$68 million (FY ended December 2025, AQNEURSA sales). Lead product AQNEURSA (levacetylleucine), an oral small molecule improving lysosomal function and energy metabolism, approved for neurological manifestations of NPC (US/EU) and ataxia in A-T (US). Strong partnerships with NPC and A-T patient groups.
Company-profile table on the left; product card with AQNEURSA logo and indications on the upper right; red partnership box below.
Rare inherited lysosomal disorder caused by NPC1/NPC2 mutations that lead to lipid accumulation; symptoms include ataxia, cognitive decline, eye-movement disorder and hepatosplenomegaly. Incidence about 1 in 100,000; about 400 diagnosed patients in the US and 500 in the EU5. Existing therapies mainly slow progression.
Left: lysosome illustration with membrane-transport diagram and four symptom tiles. Right: three stacked KPI cards (incidence, diagnosed patients, treatment landscape).
Serious rare genetic disease from ATM mutations impairing DNA repair, affecting the nervous, immune and respiratory systems; symptoms include ataxia, immunodeficiency, recurrent infections, lung disease, higher cancer risk and telangiectasia. Incidence about 1 in 40,000-100,000; about 1,500 diagnosed patients in the US and 800 in the EU5. AQNEURSA is the first approved therapy.
Same template as page 25: DNA/cell illustration with six symptom tiles on the left, three KPI cards on the right.
Global Phase 3 trials IB1001-301 (NPC, NCT05163288) and IB1001-303 (A-T, NCT06673056) in children and adults, 12 weeks, primary endpoint improvement in SARA score. NPC: 1.97 vs 0.60 placebo (N=59/58, p<0.001). A-T: 1.92 vs 0.14 placebo (N=69/72, p<0.001). No drug-related serious adverse events.
Top band with trial design; lower-left SARA explainer with daily-function bubbles; lower-right efficacy and safety text plus two bar charts.
NPC: Phase 3 started June 2022; US filing Jan 2024, approval and launch Sept 2024; EU filing June 2024, approval Jan 2026. A-T: Phase 3 started March 2025; US filing March 2026, approval and label expansion Sept 2026; EU filing June 2026.
Two horizontal swim-lane timelines (blue for NPC, red for A-T) with milestones for Phase 3 start, filing, approval and launch.
US: combine IntraBio's network (patient groups, specialist centres, KOLs) with RADICAVA's patient-support infrastructure to accelerate AQNEURSA uptake. Europe: use the newly approved rare-disease drug to build a rare-disease organisation (talent, patient-group ties) and establish presence.
Two columns (US in pink, Europe in red) with icon rows, downward chevrons and outcome boxes with red text.
Opens section 4 on financial policy.
Red-arc divider with heading.
Cash available ¥940.0bn (9,400億円): operating cash flow before R&D ¥480.0bn plus carried-over cash ~¥460.0bn. Planned uses: R&D ¥155.0bn, business/capital investment ¥720.0bn (with flexibility for higher dividends, buybacks or debt repayment) and dividends ¥65.0bn. H1 progress: R&D ~¥68.0bn, investments ~¥335.0bn (assuming the US$2.0bn IntraBio share purchase), dividends ¥32.3bn. Policies: investment judged against cost of capital; return quickly to a net cash position; DOE target of 4% or more and opportunistic buybacks.
Cash-in vs cash-out block diagram on the left, H1 progress column in the centre, policy panels on the right.
Record dividend increase: interim raised by ¥2 and year-end by ¥8 versus prior guidance, for an annual dividend of ¥86 per share (interim ¥40, year-end ¥46), up ¥15 from ¥71 in FY2025 — the 15th consecutive increase. DOE forecast 4.2%. History table shows buybacks, cancellations, ROE and DOE from FY2012 (split-adjusted for the October 2024 3-for-1 stock split).
Bullet points top-left; bar chart of dividends per share FY2012-FY2026 with the FY2026 bar in pink/red; data table beneath with buybacks, ROE and DOE.
Opens the appendix.
Red-arc divider with 'Appendix' heading.
Average-rate assumptions: USD ¥153.0 (May 12) → ¥159.0 (Oct 29), actual Apr-Sep ¥159.49; GBP ¥205.0 → ¥213.4, actual ¥214.16; EUR ¥184.0 → ¥184.4, actual ¥184.44.
Single centred table with grey header and red-highlighted actual column.
Q1 results were restated to reflect completed edaravone PPA and provisional ViiV PPA: amortisation of product intangibles reduced by 9 (158 → 150), other income cut by 165 (272 → 107), so operating profit falls from 669 to 513, PBT from 737 to 581 and net profit from 977 to 818. Revenue unchanged at 1,633.
Reconciliation table with pre-restatement, change and restated columns plus a description column.
Q1 (Apr-Jun): operating profit 513 + finance income 68 + tax benefit 237 (deferred tax asset recognition) = net profit 818 (+306). Q2 (Jul-Sep): operating profit 640 - finance costs 148 - income tax 114 = net profit 377 (-262), with FX weighing on finance results.
Two waterfall charts side by side, red increments for Q1 and blue decrements for Q2, with central callout badges.
Dermatology 116 (+9.5%): Corectim 53 (+15.2%), Vtama 12 (-21.4%); allergen and other 278 (+20.8%). Torii-related total 394, +17.3% vs 336 under JT Group in the prior-year period.
Compact product table with plan, actual, achievement and YoY columns.
Full-year Torii-related revenue raised 776 → 792: dermatology 225 (Corectim raised to 105, Vtama cut to 28), allergen and other 567 (+21). +15.4% vs FY2025 pro forma 686.
Forecast table with full-year and H2 original/revised blocks plus FY2025 and YoY.
2025 sales: Cabenuva (CAB+RPV LAI, IM every 2 months, treatment) £1,402M; Apretude (CAB LAI, PrEP) £439M; Dovato (DTG+3TC oral) £2,678M; Juluca (DTG+RPV oral) £656M; Tivicay (DTG) £1,323M; Triumeq (DTG+ABC+3TC) £991M.
Colour-banded product table (blue LAIs, red two-drug orals, yellow single/three-drug) with formulation, compound, route, frequency, indication and sales columns.
No competing integrase-inhibitor LAI expected to be approved before 2030. Shionogi/ViiV combined proof that two-drug oral regimens work (Dovato, Juluca) with a compound that sustains blood levels. Cabotegravir is the world's only approved integrase-inhibitor LAI: dolutegravir-like potency and resistance barrier, dosing every two months (SOLAR study), and patent protection to 2040 via additional patents.
Left grey panel with two overlapping circles and a multiplication sign; arrow to right panel with three icon-led strength boxes.
Extending Cabenuva's dosing from six to three times a year: reliability from Cabenuva clinical experience; treatment days cut from 365 (daily oral) to 3; about 2x clinic capacity; capture switching from orals and competitors. Phase 3 CUATRO study started June 2026; approval targeted CY2028; aim to extend protection to 2047 (cabotegravir compound patent expires 2031).
Regimen card on the left feeding four numbered benefit tiles; schedule and patent-strategy boxes below.
Two-drug regimen of S-365598 (VH184, third-generation integrase inhibitor with a distinct resistance profile) and VH499 (capsid inhibitor with low drug-drug interaction risk), aiming for six-month dosing for the broadest patient population. VH184 INNOVATE Phase 2b ongoing; VH499 Phase 2b CINERGY study to start CY2026 H2; Phase 3 start CY2028. Compound patents expire in the 2040s, with protection targeted to at least 2047.
Same template as page 41: regimen card, four numbered tiles, schedule and patent boxes.
Single-agent cabotegravir for PrEP every four months: reliability proven by Apretude (over 99% efficacy and 4+ years of real-world evidence), one IM injection per visit, schedule aligned with routine STI testing, favourable injection-site reaction and DDI profile. EXTEND 4M pivotal data in CY2026 H2; approval targeted CY2027; protection sought to 2045.
Same four-tile pipeline template with schedule and patent boxes.
Standard disclaimer: the deck contains forward-looking statements subject to risks including economic conditions, FX, clinical and regulatory outcomes, healthcare reforms and manufacturing; product information is not advertising or medical advice; the deck is not a solicitation to invest.
Full-width bulleted text slide.
Preguntas comunes sobre esta diapositiva y el contenido de la presentación subyacente.
It covers Shionogi's results for April-September 2026 (the first half of FY2026, which runs April 2026 to March 2027), the upward revision of full-year guidance, the planned acquisition of IntraBio and its rare-disease drug AQNEURSA, the China restructuring, the ViiV long-acting HIV pipeline, and cash allocation and dividend policy, across 44 slides.
Yes. The original is a Japanese-language results briefing deck (決算説明資料, titled 2026年度 第2四半期(中間期)決算説明資料) released on October 29, 2026 via TDnet, the Tokyo Stock Exchange's timely disclosure system, under securities code 4507. The page-by-page summary on this page is written in English, with amounts kept in the company's ¥100 million (億円) units.
Revenue was ¥350.4 billion (+64.5% YoY), operating profit ¥115.2 billion (+55.8%), profit attributable to owners ¥119.5 billion (+44.0%) and EBITDA ¥174.6 billion (+103.4%). Royalty income, mostly from ViiV's HIV franchise, was ¥165.4 billion.
Full-year revenue was raised from ¥700.0 billion to ¥720.0 billion, operating profit from ¥220.0 billion to ¥230.0 billion and EBITDA from ¥315.0 billion to ¥336.0 billion. The annual dividend forecast rose to ¥86 per share, up ¥15 and the 15th consecutive increase.
IntraBio markets AQNEURSA (levacetylleucine) for Niemann-Pick disease type C and ataxia-telangiectasia. Shionogi plans to use its US RADICAVA infrastructure to grow AQNEURSA and to build a rare-disease presence in Europe. The deal assumes a share purchase of about US$2.0 billion and is expected to close in November-December 2026.
Yes. The page offers the original PDF and an editable PPTX converted from it. Because the source is Japanese, the slide text in both files is in Japanese; the conversion may need minor layout touch-ups.
Investors and analysts covering Japanese pharma or the HIV long-acting injectable market, BD teams studying rare-disease acquisitions, and IR professionals who want a well-structured example of a half-year results deck with a forecast revision and an M&A section.
Original Japanese-language PDF filed on TDnet on October 29, 2026.

Create Your Own Slides
Turn your ideas into professional presentations in seconds with 2slides AI.
Referencia diseños profesionales, elige tu estilo y genera diapositivas con renderizado de texto perfecto. Impulsado por Nano Banana—comienza a crear tu presentación ahora.
Tu Agente IA para diapositivas. Ahorra tiempo, brilla más rápido con la creación inteligente de presentaciones.


© 2026 2slides. Todos los derechos reservados.