
Forma parte de Ejemplos de presentaciones para inversores · Ejemplos de presentaciones para inversores de Australia
Life360 Q3'26 Investor Update: a 40-page quarterly presentation from Life360, Inc. (ASX: 360, Nasdaq: LIF), lodged with the ASX and dated 9 November 2026 (U.S. PT) / 10 November 2026 (AEDT). It covers the three months ended 30 September 2026 for the family safety membership service. Headlines are total revenue of $174.1 million (+40% YoY), Adjusted EBITDA of $34.6 million (20% margin), global MAU of about 107.7 million and about 3.4 million Paying Circles. All figures are in US dollars (the deck states 'All values are stated in US dollars unless otherwise stated'), shown as $ in the deck.
Usa la portada de esta presentación como referencia de estilo para diapositivas creadas con tu propio contenido. O elige cualquier página de abajo para usar su diseño como referencia.
Navegación Rápida
Etiquetas
Compartir las diapositivas
Life360 Q3'26 Investor Update: a 40-page quarterly presentation from Life360, Inc. (ASX: 360, Nasdaq: LIF), lodged with the ASX and dated 9 November 2026 (U.S. PT) / 10 November 2026 (AEDT). It covers the three months ended 30 September 2026 for the family safety membership service. Headlines are total revenue of $174.1 million (+40% YoY), Adjusted EBITDA of $34.6 million (20% margin), global MAU of about 107.7 million and about 3.4 million Paying Circles. All figures are in US dollars (the deck states 'All values are stated in US dollars unless otherwise stated'), shown as $ in the deck.
Vista detallada de cada página de diapositiva, incluyendo diseño, contenido clave y elementos visuales.
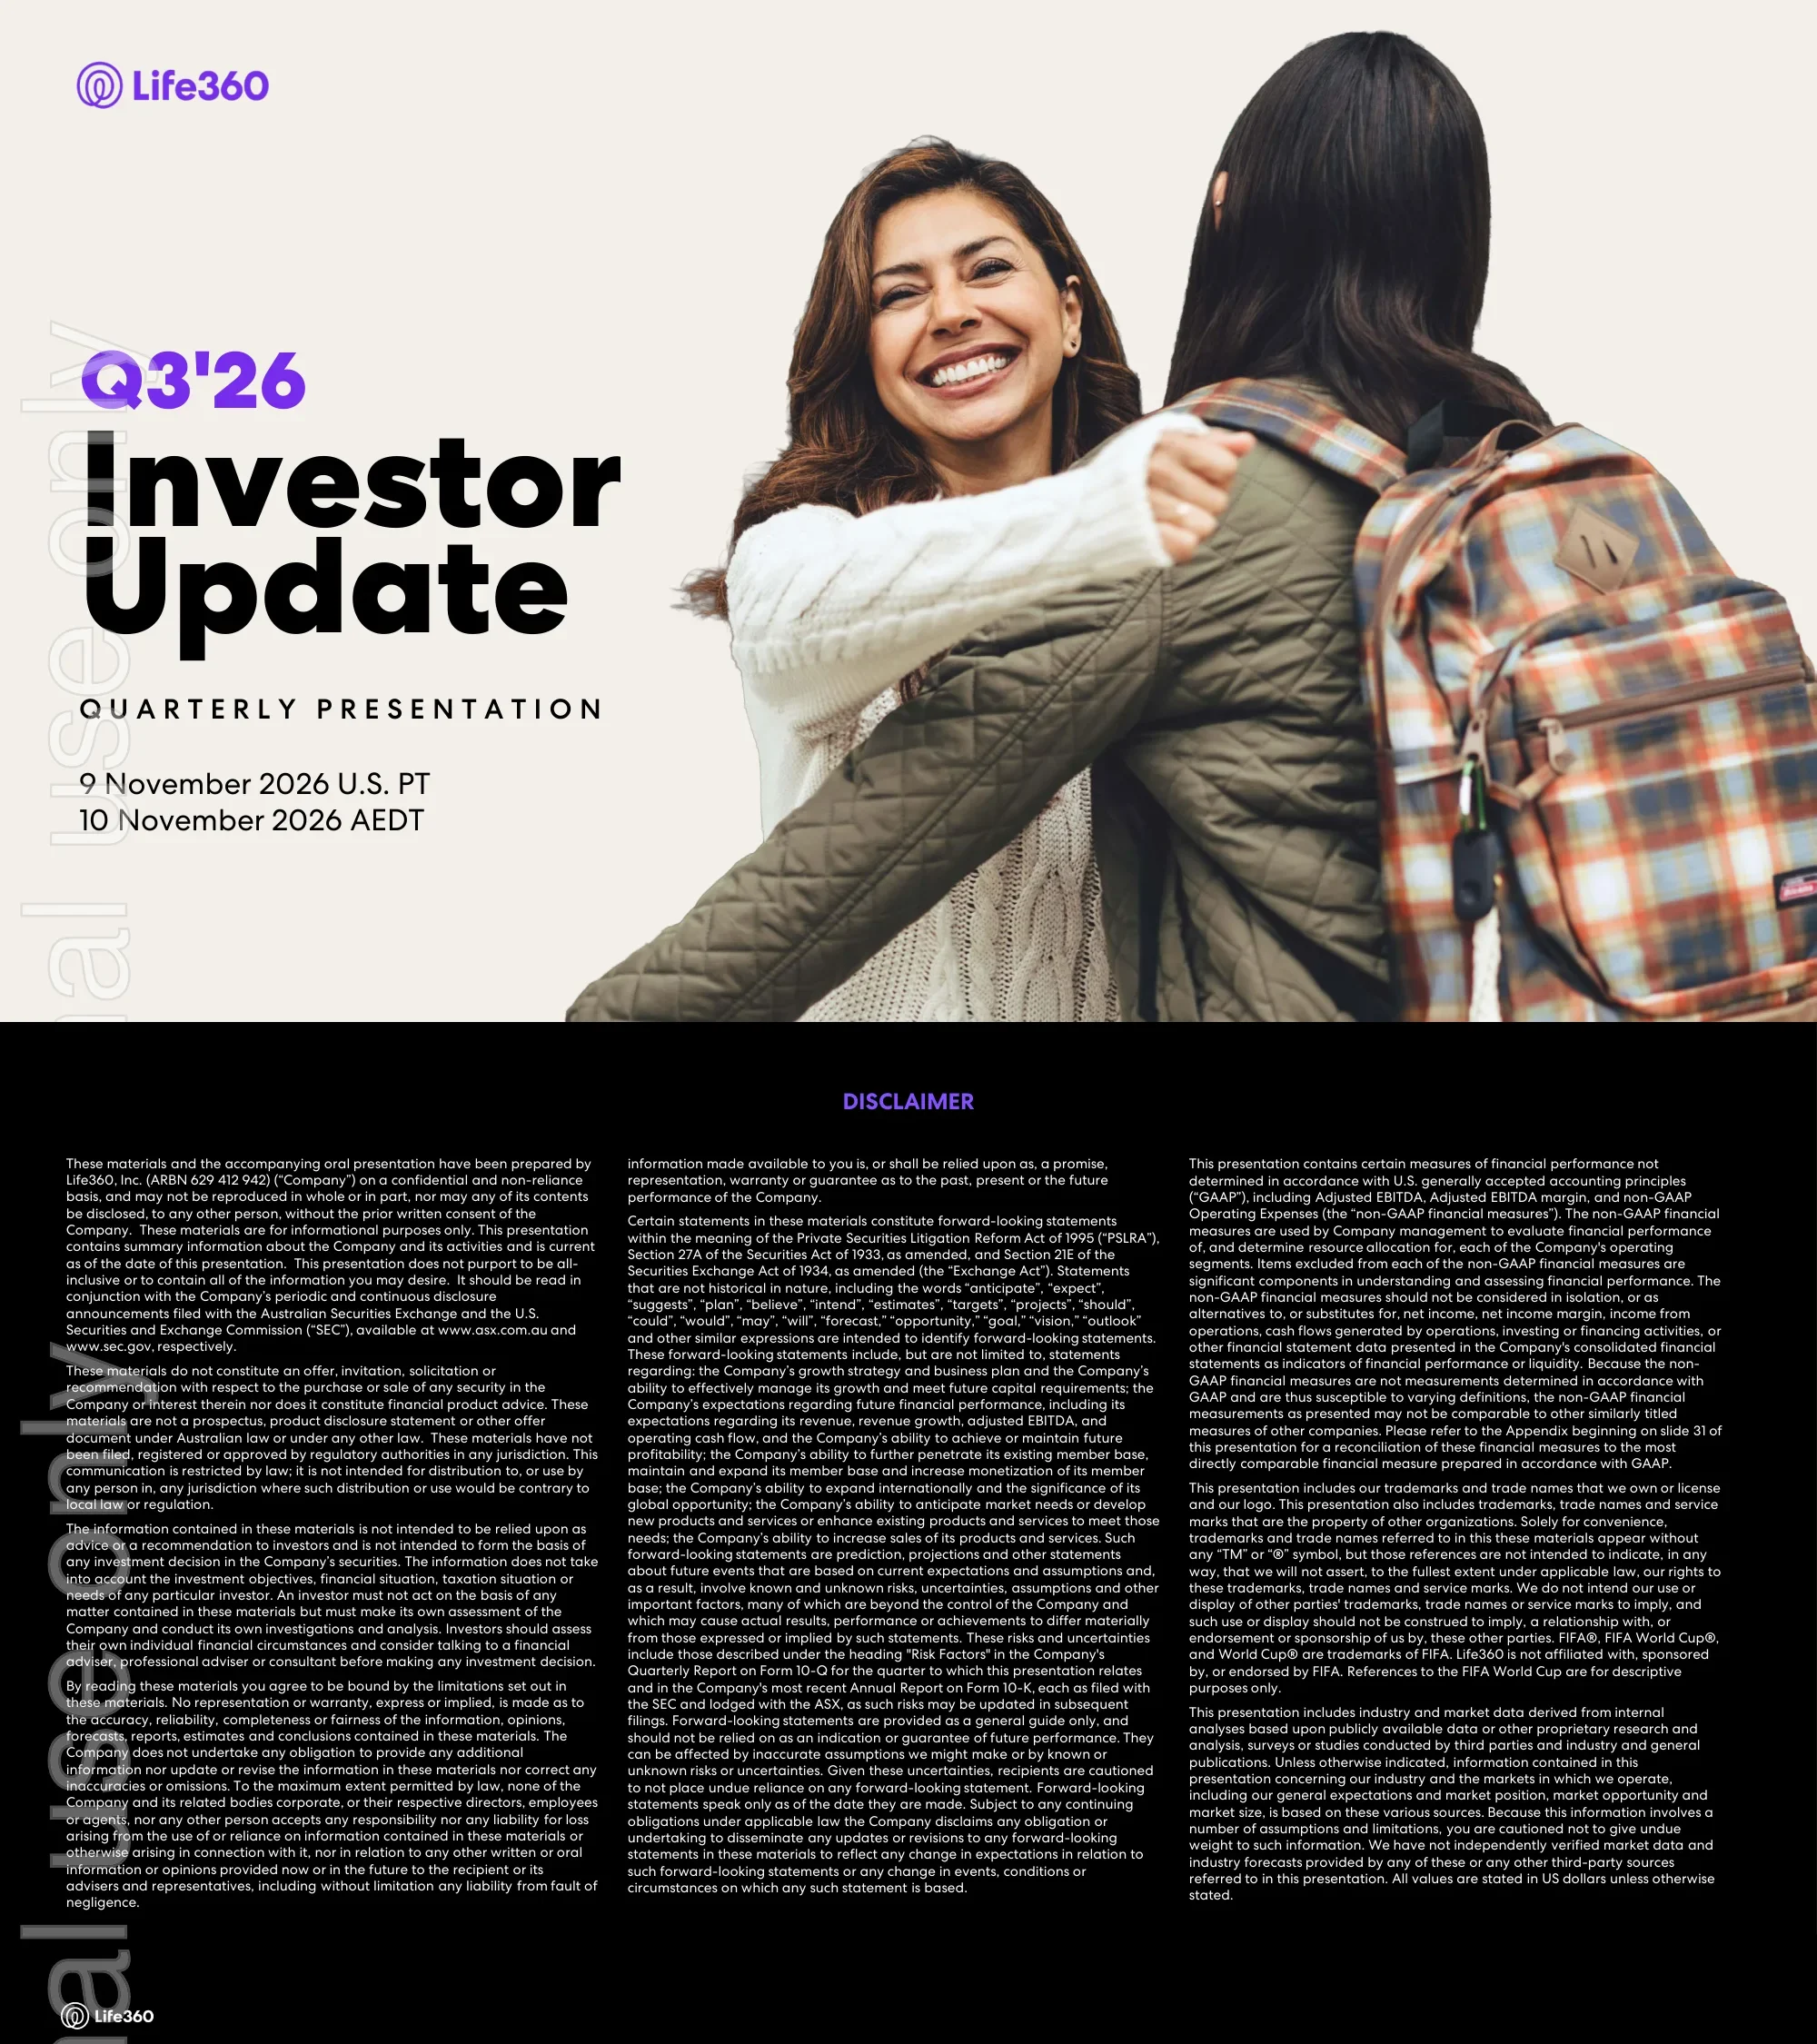
Cover slide titled 'Q3'26 Investor Update, Quarterly Presentation', dated 9 November 2026 U.S. PT and 10 November 2026 AEDT.
Left-aligned large black title with purple Q3'26 label on a cream background; cut-out photo of two people hugging on the right; Life360 logo top left.
Legal disclaimer from Life360, Inc. covering forward-looking statements, non-GAAP financial measures (Adjusted EBITDA, Adjusted EBITDA margin, non-GAAP operating expenses), a reference to the appendix on slide 31 and a statement that all values are in US dollars unless otherwise stated.
Dark background with a purple heading and three dense columns of small white text; small logo bottom left.
Agenda of six sections: Q3'26 Result Highlights (pp. 4-5), Financial Performance (6-9), Operational Performance (10-24), AI Highlights (25-28), FY'26 Outlook (29-30) and Appendix (31-39).
Title on the left; six full-width colour bars on the right, each with number, section name and page range; Appendix bar lists its sub-topics in small text.
Green section divider for 'Q3'26 Result Highlights, Investor Update' with no data on the page.
Solid green background, large number 01 and title at left, cut-out photo of a father and child in red plaid on the right; top navigation bar with 01 Highlights active.
Four themes: audience (about 107.7m global MAU, +17% YoY; 21% YoY growth in International MAU), paid offerings (about 3.4m Paying Circles, +26% YoY; 188k quarterly net adds, +10% YoY), new revenue streams (advertising $25.4m, +250% YoY) and profitability (revenue $174.1m, +40% YoY; Adjusted EBITDA $34.6m, 20% margin).
Landscape photo header with title and subtitle; four coloured pillar cards with icons, each with two big KPI numbers below; footnote on Adjusted EBITDA.
Pink section divider for 'Q3'26 Financial Performance'; no data on the page.
Pink background with large number 02 and title at left; product photo of a Life360 tracker with Mickey and Minnie Mouse artwork on the right; navigation bar with 02 active.
Total revenue $174.1m vs $124.5m (+40% YoY); subscription $124.2m (+29%), hardware $9.0m (-20%), advertising $25.4m (+250%), other $15.5m (+61%). Gross margin 77% vs 78%, operating expenses $126.0m (+38%), net income $22.5m, Adjusted EBITDA $34.6m (+41%, 20% margin), cash $335.8m and operating cash flow $27.2m.
Left: dark-header results table in $M comparing Q3'25 and Q3'26 with $ change and % YoY; right: lavender rounded commentary panel with eight bullets; rounding and footnotes under the table.
Pie chart of Q3'26 revenue: Subscription $124.2M (71%), Advertising $25.4M (15%), Other $15.5M (9%), Hardware $9.0M (5%). Text frames subscription as the core engine, advertising and partnerships as emerging streams (foundation built in 2026, ready to scale in 2027) and devices and pets as supporting streams.
Pie chart in a lavender rounded panel on the left; three icon-led text blocks (core, emerging, supporting streams) separated by rules on the right.
Three charts on Adjusted EBITDA margin by quarter (2025 vs 2026, YoY expansion expected in Q4'26E), GAAP operating expenses as % of revenue (improved YoY, further improvement expected in Q4'26E) and operating leverage (revenue vs COGS and Opex, FY21 to FY26E and beyond). Commentary notes revenue grew 40% YoY and Nativo costs were in the base from day one.
Purple background with three cream cards, each with a heading, takeaway statement, line chart and lavender commentary strip at the bottom.
Blue section divider for 'Q3'26 Operational Performance'; no data on the page.
Light blue background with large number 03 and title at left; cut-out photo of three young people looking at a phone on the right; navigation bar with 03 active.
States the path to 150M MAU and lists drivers: funnel improvements (Android performance, Google Sign-in, Live Progress), local-market conversion (MAU in the UK, Australia, New Zealand and Canada grew 24%), the AI monetization engine and scaling paid after the recent U.S. price change. App rating rose from 4.5 to 4.8.
Left: headline paragraph and four bold-lead bullets; right: three purple banner rows (app rating, Jamie Oliver partnership and influencer campaign, Live Progress and Zoomies pet care), each with overlapping phone screenshots.
Quarterly Core MAU stacked columns from Q1 2020 to Q3 2026 split into U.S. (56M in Q3'26, +14% YoY), International Triple Tier (14M, +24%) and Other International (38M, +20%); a second chart shows Triple Tier countries (ANZ, UK, Canada, +31% YoY combined). Net adds were +5.3M, with International contributing 3.5M.
Two side-by-side stacked bar charts with legends; YoY arrow badges at the right of each chart; note on rounding and Triple Tier definition at the bottom.
Net MAU additions of 1.8M (U.S.) plus 1.0M (International Triple Tier) in Q3'26, and 2.5M from Other International, which rebounded. Commentary says U.S. and Triple Tier additions have historically been in a narrow range, while Other International varies with viral surges.
Two bar charts in one cream panel on a lavender page, each with a one-bullet takeaway beneath; rounding note at the bottom.
U.S. state penetration maps for 2020 and 2026 with a line chart of the top 5 penetrated states rising from under 10% in Q3'20 to roughly 25% in Q3'26. Legend bands run Landing (<3%), Expanding (3-10%), Growing (10-20%), Scaling (20-30%) and Established (30%+).
Two choropleth U.S. maps flanking a central line chart, with a five-colour legend row beneath and source and footnote text.
World map with penetration 2020 to 2026: United States 6% to 18%, Canada 1% to 6%, United Kingdom 2% to 14%, Australia and New Zealand 3% to 15%, Europe 0.4% to 2%, Rest of World 0.2% to 0.6%. Icons mark Triple Tier countries.
Full-width tinted world map with callout boxes per region showing before and after percentages with chevron arrows; legend and Triple Tier key at bottom left.
Phased strategy matrix: monetize large user base (UK, Australia/New Zealand, Canada; subscription revenue up 45% in Q3'26), grow the user base (Germany and select European countries) and create strong product fit (Brazil, Italy, LATAM, Mexico, Spain). The Jamie Oliver campaign drove double-digit registration increases in the UK and Canada and nearly 100M social views.
Table-style grid with row labels at left (market features, focus countries, investment focus), three rounded strategy columns and a fourth highlight column with phone mockups; purple banner at the bottom on global efforts.
Q3'26 subscription revenue of $124.2M (+29% YoY) against $96.3M in Q3'25; Q1 was $108.2M and Q2 $115.6M in 2026. Global Paying Circles reached 3,409 thousand in Q3 26 (26% YoY growth); core Life360 subscription revenue grew 32%.
Grouped bar chart by quarter for 2024, 2025 and 2026 at left, single-series Paying Circles bar chart in the middle, four commentary bullets at right, all in one cream panel on a lilac page.
Paying Circles by geography (000s) to Q3'26: U.S. 2,380 (+24% YoY), International Triple Tier 427 (+34%) and Other International 602 (+29%), with total growth of 26%. Triple Tier countries show ANZ, UK and Canada, with Canada +47%, UK +34% and ANZ +30% YoY.
Two stacked bar charts with rotated value labels, YoY arrow callouts at the right of each and a legacy price-increase annotation.
Q3'26 net adds: U.S. 115 thousand and International Triple Tier 35 thousand in the first chart, and Other International 38 thousand in the second. Commentary says U.S. net adds grew 7% YoY and Triple Tier net adds grew 40% YoY and 28% QoQ.
Two bar charts in a cream panel on lavender with explanatory bullets beneath each; rounding note at the bottom.
Global ARPPC up 4% YoY; U.S. line ends at $167 (+4% YoY) and International at $88 (+10% YoY). International Triple Tier revenue is shown for Q3 24, Q3 25 and Q3 26, with growth of 69% combined, UK +41% and ANZ +43%.
Left: two-line chart over Q1 2020 to Q3 2026 with a large green +4% arrow; right: stacked bars for three Q3s with colour-coded YoY arrows; footnote about the August 2022 U.S. price increase.
Q3 hardware revenue of $9.0M in 2026 versus $11.3M in 2025 and $11.7M in 2024. 12% of U.S. Paying Circles have a device attached and 11% of U.S. free circles have a device or pet profile attached.
Left: grouped bars by quarter for 2024, 2025 and 2026; right: life-stage illustration timeline (before or without kids, the family years, after the kids leave) above three icon rows on audience, engagement and retention.
Q3'26 advertising revenue was $25.4M versus $7.3M in Q3'25 and $1.1M in Q3'24, a 250% YoY increase driven by managed advertising after the Nativo acquisition. Q1 and Q2 2026 were $19.7M and $22.0M.
Yellow chart panel at left, two phone screenshots (driver report prompts) in the centre, two icon headings and two bullets at right.
Annual advertising revenue of $5.8M (FY'24) and $31.0M (FY'25) with FY'26E shown as up more than 3x YoY (value not labelled); annual advertising gross profit of $5.6M (FY'24) and $29.1M (FY'25) with FY'26E unlabelled. Text covers advertiser demand and responsible growth.
Two yellow rounded chart cards with three bars each and a text column at the right with two headed paragraphs.
Q3'26 other revenue was $15.5M versus $9.6M in Q3'25 and $8.2M in Q3'24, up 61% YoY, driven by higher partnership revenue and data revenue. Q1 and Q2 2026 were $10.7M and $11.6M.
Green chart panel on the left, a phone map screenshot with line-art houses in the centre, two icon headings (first party data monetization, Hubble partnership) and a bullet at right.
Lavender section divider for 'Q3'26 AI Highlights'; no data on the page.
Lavender background with large number 04 and title at left; cut-out photo of a couple waving at a tablet on the right; navigation bar with 04 active.
Diagram of how a Life360 AI connector (MCP) lets external AI agents read and write family data, with example prompts such as 'Is everyone where they need to be?' and 'When should I place the dinner order?'. Family Intelligence is described as real-time data shared only with a member's permission.
Three columns (Users, Interface, Platform) with a phone screenshot, speech-bubble prompts, an AI robot illustration and connector lines in purple and blue.
Five points: members set the pace, durable data advantage, agents expand use cases, agents enhance the app and AI complements the core app, with new in-app AI experiences planned in coming quarters. Example notifications include 'Go Tigers!', 'Dinner Order' and 'Family's Home'.
Left: five rows with purple circular icons, coloured headings and short descriptions separated by rules; right: phone mockup with three floating notification cards.
Four-step flow (Family Intelligence, Engine Decides, Member Outcome, Data feeds back) with the delivery line 'The Right Message, to the Right Person, at the Right Time'. Recent wins cited: about 2x share of new subs to Platinum and more subscription starts shifted to web billing.
Four white rounded cards linked by arrows with a dashed feedback loop below; full-width purple banner; bold wins statement at the bottom.
Purple section divider for 'FY'26 Outlook'; no data on the page.
Solid purple background with large number 05 and title at left; cut-out photo of a boy taking a selfie with an older woman on the right; navigation bar with 05 active.
FY'26 guidance: MAU growth of 17% to 20% (unchanged); revenue of $665 million to $681 million (36% to 39% YoY, raised from $650 million to $685 million); subscription $483-488 million, hardware $35-40 million, advertising $98-102 million, other $49-51 million; Adjusted EBITDA $132-138 million, about a 20% margin.
Text-only slide with a large title, an introductory line, nested bullets for revenue components and a non-GAAP footnote.
Yellow section divider for the Appendix; no data on the page.
Yellow background with large coral number 06 and title at left; cut-out photo of two teens taking a selfie on the right; navigation bar with 06 active.
Illustrative unit economics: Year 1 revenue split 50% hardware and 50% subscription with gross margin of (45%) on hardware and 42% on subscription, net (3%); Year 2 subscription renewal gross margin 87%. The slide notes it is illustrative, not a forecast.
Left lavender card with horizontal bars for Year 1 and Year 2; right lavender card with a cumulative gross margin line chart over Years 1-4 and three bullets; long footnote.
Top 10 international MAU countries (66% of total International) led by United Kingdom, Brazil, Mexico, Australia and Italy; top 10 revenue countries (78% of total International) led by United Kingdom, Australia, Canada, Brazil and Mexico. Data as of Q3'26.
Blurred photo background with a large phone screenshot at left and two white rounded ranking cards at right.
Current Triple Tier bundles: Free $0.00/mo, Silver $9.99/mo (11% of U.S. Paying Circles), Gold $16.99/mo (84%) and Platinum $24.99/mo (5%), as of September 30, 2026. Features include Place Alerts, Location History, Stolen Phone Protection and, at Platinum, Credit Monitoring and Stolen Funds Reimbursement ($1M).
Four colour-coded tier cards with price headers, feature checklists, membership card artwork and percentage-of-paying-circles footers.
Five-quarter KPI table (Q3 2025 to Q3 2026): global MAU 107.7M (U.S. 55.8M, International 51.9M), Paying Circles 3.4M, ARPPC $143.56, subscriptions 3.9M, ARPPS $130.50, net hardware units shipped 0.6M, ASP $14.11 and Annualized Monthly Revenue $578.0M.
Full-width table with dark header row, grouped sections for Core, Consolidated and Additional KPIs, and footnotes on core metrics.
Three months ended September 30, 2026 vs 2025: total revenue $174.1M vs $124.5M, gross profit $134.0M vs $97.1M, total operating expenses $126.0M vs $91.4M, income from operations $8.0M vs $5.7M and net income $22.5M vs $9.8M.
Single left-aligned financial table with dark highlighted subtotal rows (total revenue, gross profit, income from operations, net income).
Balance sheet at September 30, 2026: total assets $1,085.7M, total liabilities $455.1M and stockholders' equity $630.6M. Nine-month cash flow: net cash from operating activities $68.2M, cash used in investing $(190.6)M, financing $(37.6)M; ending cash and restricted cash $335.8M.
Two dense tables side by side, balance sheet at left and nine-month cash flow at right, with dark total rows.
Cost of revenue reconciliation: GAAP $40.1M to non-GAAP $35.8M (2026) and $27.4M to $23.6M (2025). Operating expenses: GAAP $126.0M to non-GAAP $103.7M (2026) and $91.4M to $76.4M (2025).
Two side-by-side tables, Cost of revenue at left and Operating expenses at right, each listing GAAP lines, deductions and non-GAAP subtotals in dark rows.
Reconciliation of net income $22.5M to Adjusted EBITDA $34.6M for Q3'26 (Q3'25: $9.8M to $24.5M), after items such as the $17.5M fair value gain, $6.0M tax provision, $6.1M D&A and $20.2M stock-based compensation. A panel defines Adjusted EBITDA and why it is used.
Left: reconciliation table with three footnotes; right: tall lavender panel with the Adjusted EBITDA definition text.
Closing 'Thank You' slide with no figures.
Cream background with large black and purple 'Thank You' text at left and a cut-out photo of a dog wearing a pink Life360 pet GPS tracker on the right; navigation bar at top.
Preguntas comunes sobre esta diapositiva y el contenido de la presentación subyacente.
It is Life360's Q3'26 Investor Update, a quarterly presentation dated 9 November 2026 (U.S. PT) and 10 November 2026 (AEDT), lodged with the ASX. Life360, Inc. is listed on the ASX under the ticker 360 and also on Nasdaq as LIF, so it is dual-listed. The disclaimer notes it should be read with the company's filings on asx.com.au and sec.gov.
Q3 2026 is the three months ended 30 September 2026 (the income statement is labelled 'Three Months Ended September 30'), and the company reports on a calendar year, with the balance sheet comparing September 30, 2026 to December 31, 2025. Amounts are in US dollars; the disclaimer says 'All values are stated in US dollars unless otherwise stated'.
Total revenue was $174.1 million (+40% YoY), subscription revenue $124.2 million (+29%) and advertising revenue $25.4 million (+250%). Net income was $22.5 million and Adjusted EBITDA $34.6 million (20% margin). Global MAU reached about 107.7 million (+17%) and Paying Circles about 3.4 million (+26%).
The outlook slide guides to MAU growth of 17% to 20% (unchanged), revenue of $665 million to $681 million (raised from $650 million to $685 million) and Adjusted EBITDA of $132 million to $138 million, about a 20% margin. It also lists ranges for subscription, hardware, advertising and other revenue.
The structure transfers well: cover, disclaimer, contents, colour-coded section dividers with a top navigation bar, a results table with commentary, KPI charts and an appendix with financial statements and non-GAAP reconciliations. The branding, photos and figures are Life360's, so replace them with your own content and check the licensing of any imagery.
The deck reports monthly active users (MAU) and net adds, Paying Circles and net adds, and average revenue per paying circle (ARPPC), split by U.S., International Triple Tier and Other International. It also shows subscription, hardware, advertising and other revenue, plus Adjusted EBITDA, gross margin and operating expenses as a percentage of revenue.
It uses a bold, friendly style with a cream background, deep purple headings, large rounded sans-serif titles and a six-colour palette (green, pink, blue, lavender, purple, yellow) that marks each section. Cut-out lifestyle photos appear on dividers, while charts use stacked bars, YoY arrow callouts and rounded cards. Appendix tables use dark header rows.
Section 04 describes a Life360 AI connector (MCP) that opens family intelligence to external AI agents with member permission, and an AI engine that decides offer, plan and payment type. Recent wins cited are about 2x share of new subs to Platinum and more subscription starts moving to web billing. Advertising revenue of $25.4 million grew 250% YoY following the Nativo acquisition.

Create Your Own Slides
Turn your ideas into professional presentations in seconds with 2slides AI.
Referencia diseños profesionales, elige tu estilo y genera diapositivas con renderizado de texto perfecto. Impulsado por Nano Banana—comienza a crear tu presentación ahora.
Tu Agente IA para diapositivas. Ahorra tiempo, brilla más rápido con la creación inteligente de presentaciones.


© 2026 2slides. Todos los derechos reservados.